
Monitoring Core Web Vitals with New Relic
In today's digital landscape, user experience plays a crucial role in the success of a website. One key aspect influencing user experience is Core Web Vitals, a set of metrics that measure website performance. In this blog, we'll explore the significance of monitoring Core Web Vitals and how New Relic, a powerful observability platform, can simplify this process for you.
Why Core Web Vitals Monitoring Matters
Understanding how website performance impacts user satisfaction and search engine rankings is crucial. Core Web Vitals, including Largest Contentful Paint (LCP), First Input Delay (FID), and Cumulative Layout Shift (CLS), are key for delivering a smooth user experience and boosting SEO. Plus, there is a pending metric called Interaction to Next Paint (INP), which will replace FID on March 12, 2024. INP underscores the importance of responsiveness and interactivity in making users happy and improving site performance.
-
Largest Contentful Paint (LCP)
This metric measures how quickly the main content of a page loads. A fast loading speed is essential for keeping users engaged and preventing them from bouncing off your site due to long wait times. Monitoring this metric helps identify areas for improvement and ensures that our website loads swiftly across different devices and network conditions. -
First Input Delay (FID)
FID shows how long it takes for a page to respond after a user interacts with it. It tells us how quickly our site reacts to things like clicks or taps. FID matters because if there's a long delay, users can get frustrated and lose interest. By fixing FID, we can make sure our site is smooth and easy to use. -
Cumulative Layout Shift (CLS)
CLS measures unexpected changes in a page's layout while it's loading. Sudden changes can annoy users, especially if they accidentally click on the wrong thing because of a layout shift. By keeping an eye on CLS, we can find and fix things causing layout problems, making our site easier to use. -
Interaction to Next Paint (INP)
INP measures how long it takes for something to change visually after a user interacts with a page. While FID concentrates on the lag between a user's initial interaction and the browser's response, INP emphasizes the interval to visual feedback, emphasizing perceived responsiveness. It's important to make both INP and FID fast to give users the best experience possible.
By actively monitoring Core Web Vitals, we can identify performance issues, prioritize optimizations, and ultimately provide a better user experience on our website. This not only improves user satisfaction and engagement but also contributes to higher search engine rankings and increased conversions.
New Relic Overview
New Relic is a comprehensive observability platform that helps organizations monitor, troubleshoot, and optimize the performance of their digital systems and applications. It has many tools and features to help us understand how well our software and systems are working, so we can make sure users have a great experience. One of the key features of New Relic is its support for monitoring Core Web Vitals.
How Halodoc Monitors Core Web Vitals with New Relic
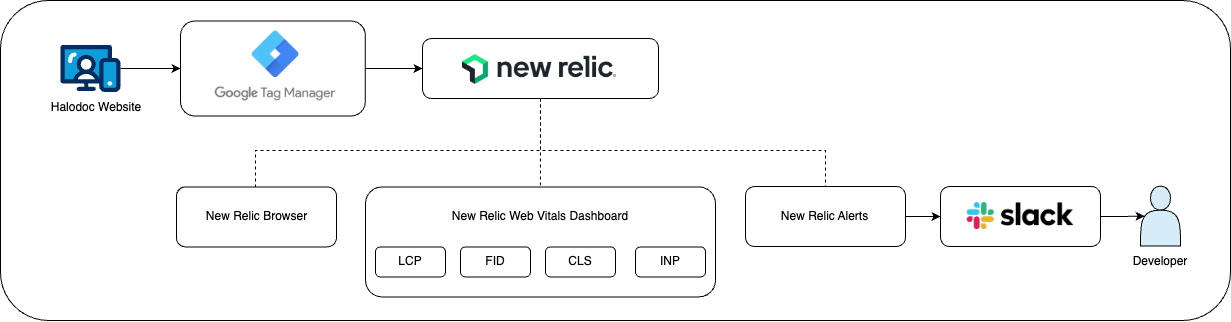
We are currently incorporating New Relic into our website using Google Tag Manager. This allows New Relic to monitor our Web Vitals scores in real-time, providing detailed insights within the New Relic Browser. We also create a custom dashboard to monitor Core Web Vitals specifically on our highest-traffic pages. In order to facilitate efficient communication, we've established integration between New Relic and Slack using New Relic Alerts. This ensures that our team receives immediate notifications in the event of any detected incidents, enabling our developers to remain well-informed and responsive to potential issues.
The blog post below provides details on our implementation process using GTM.
 Muhammad Nadzeri Munawar
Core Web Vitals Monitoring with New Relic Browser
New Relic Browser is a performance monitoring tool that provides insights into web application performance from the perspective of real users. By installing the New Relic Browser agent, developers can track Web Vitals scores, page load times, browser rendering, and user interactions, enabling them to optimize website performance and enhance the user experience.
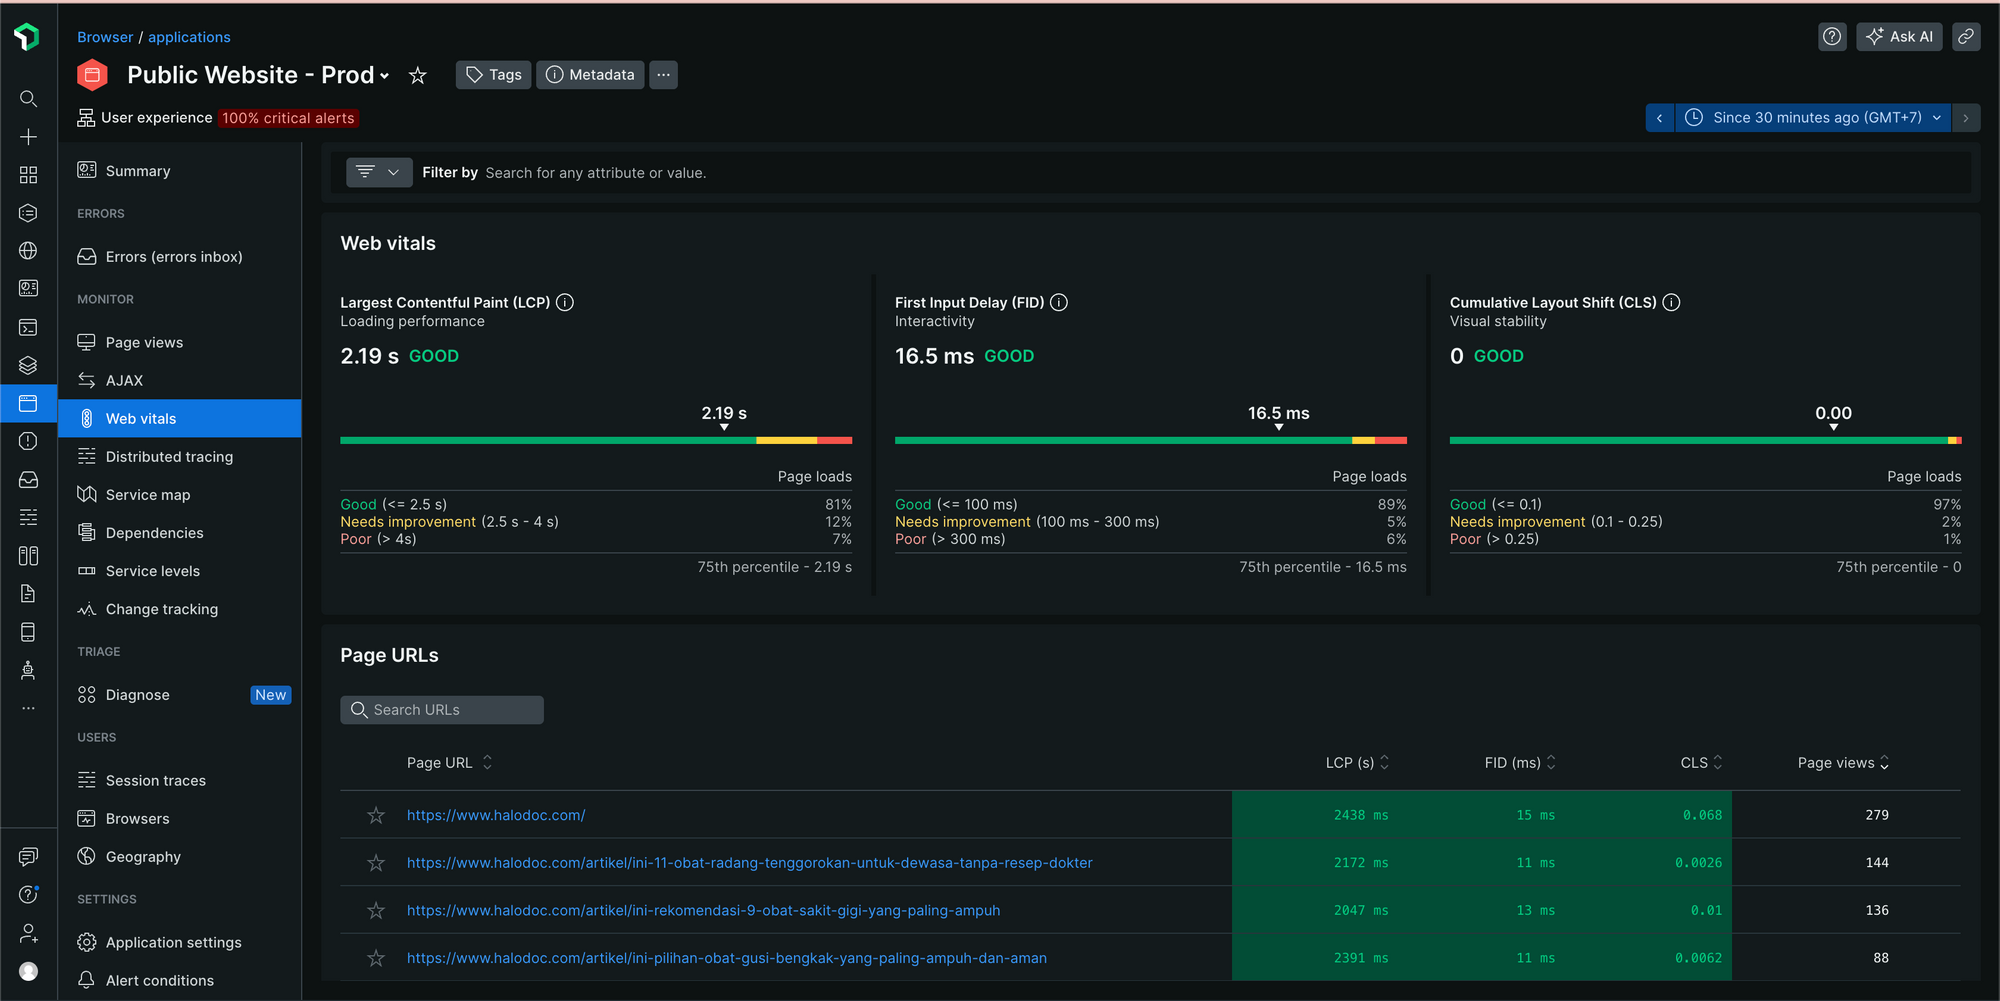
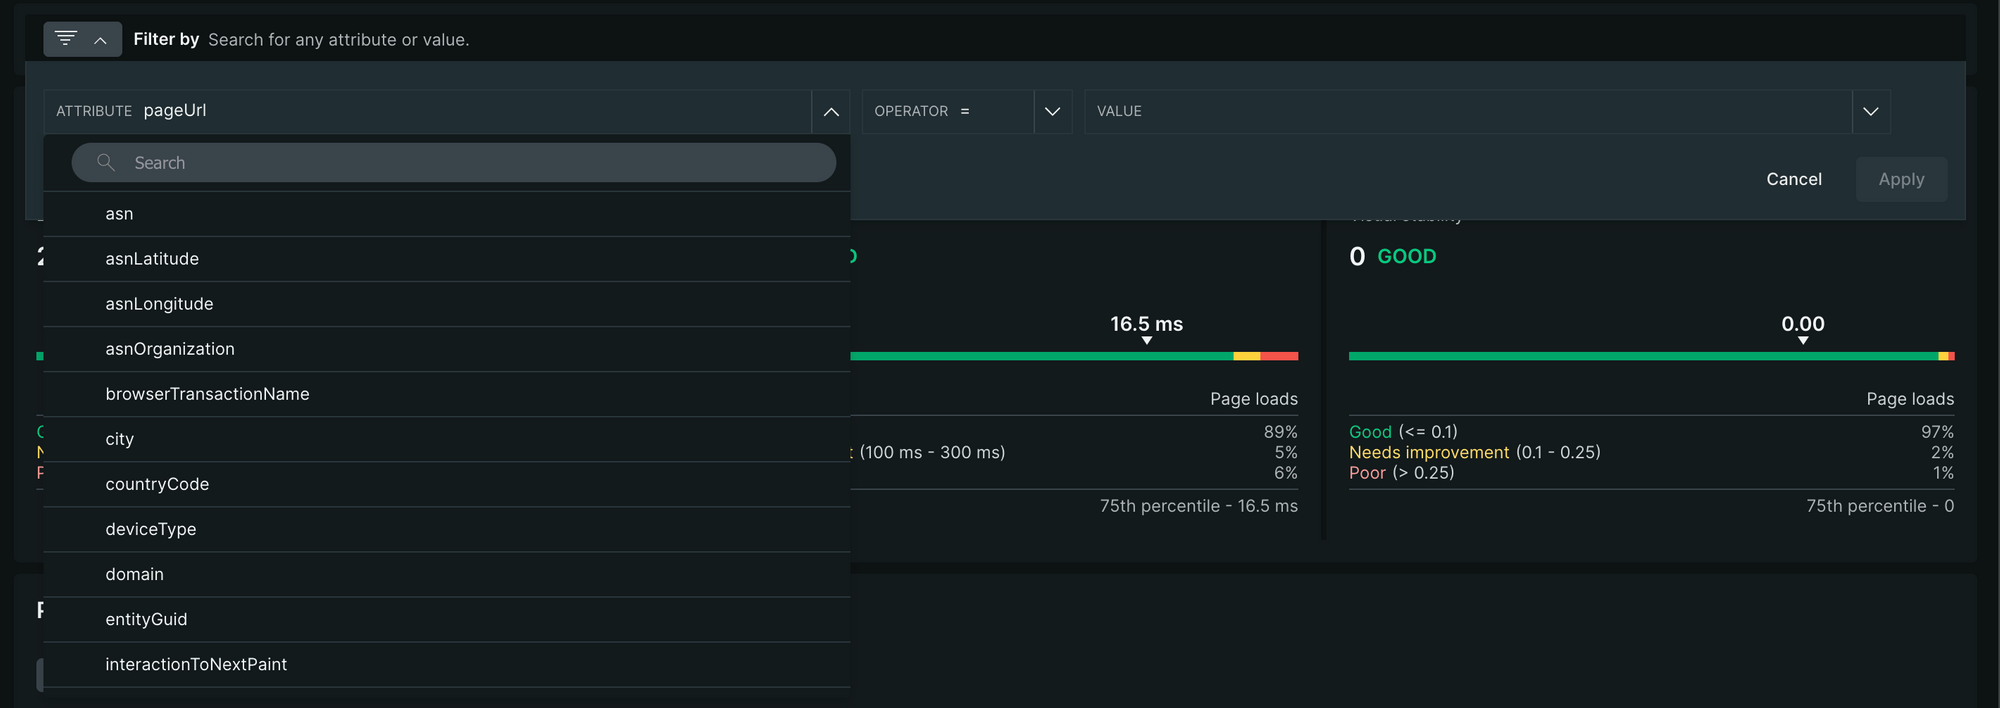
At the top of the dashboard, scorecards provide concise summaries of Core Web Vitals scores, offering a high-level overview of performance. Additionally, the dashboard offers robust filtering capabilities, allowing users to segment data based on various attributes such as countryCode, city, and pageUrl. This granular level of analysis enables teams to pinpoint performance issues and prioritize optimization efforts accordingly.
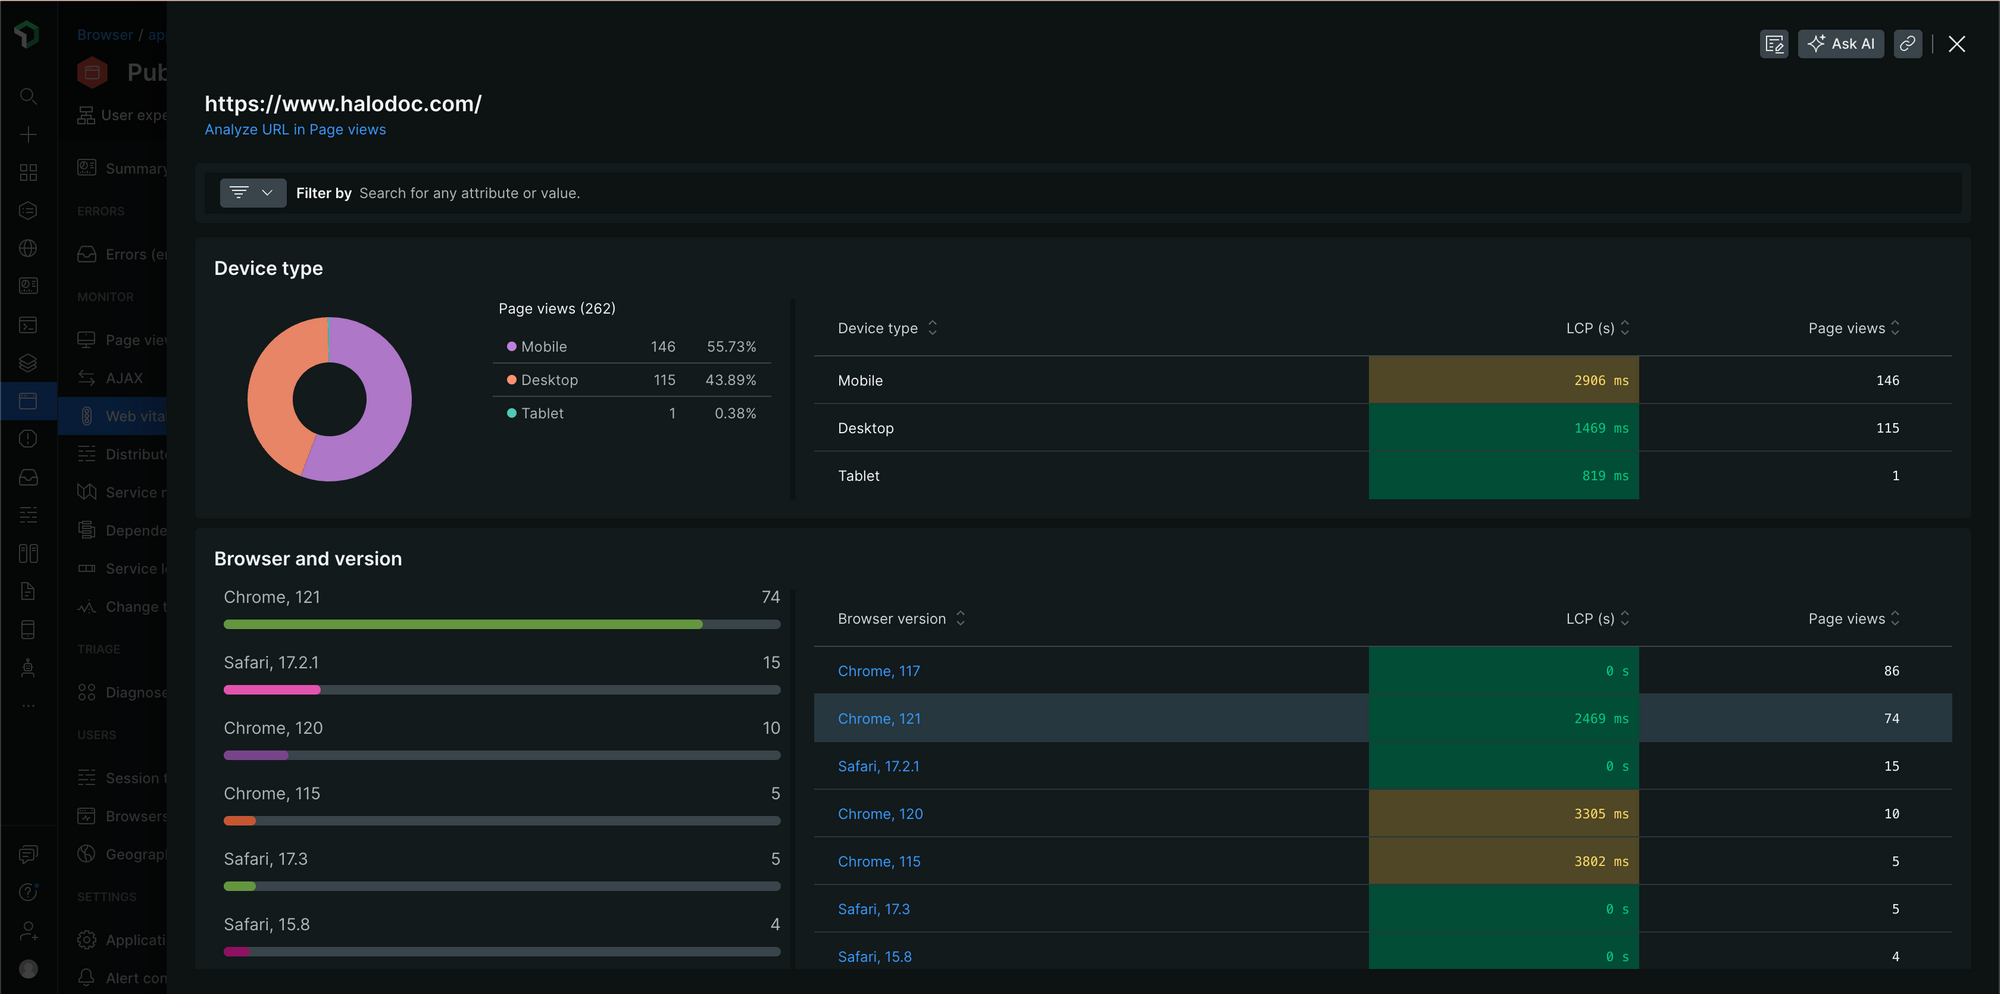
In the Page URLs section, users can explore the Core Web Vitals scores of all pages on the website. This detailed view provides insights into individual page performance, helping us identify specific areas for improvement. Moreover, New Relic goes beyond performance metrics by providing valuable information on user behavior, including device types, browsers, operating systems, and geographic locations of page access.
Setting up a Custom Dashboard
At Halodoc, we leverage New Relic's flexibility to create custom dashboards according to our specific requirements. One such instance is our customization of the Core Web Vitals dashboard, where we highlight crucial metrics like LCP, CLS, and INP for our highest-traffic pages.
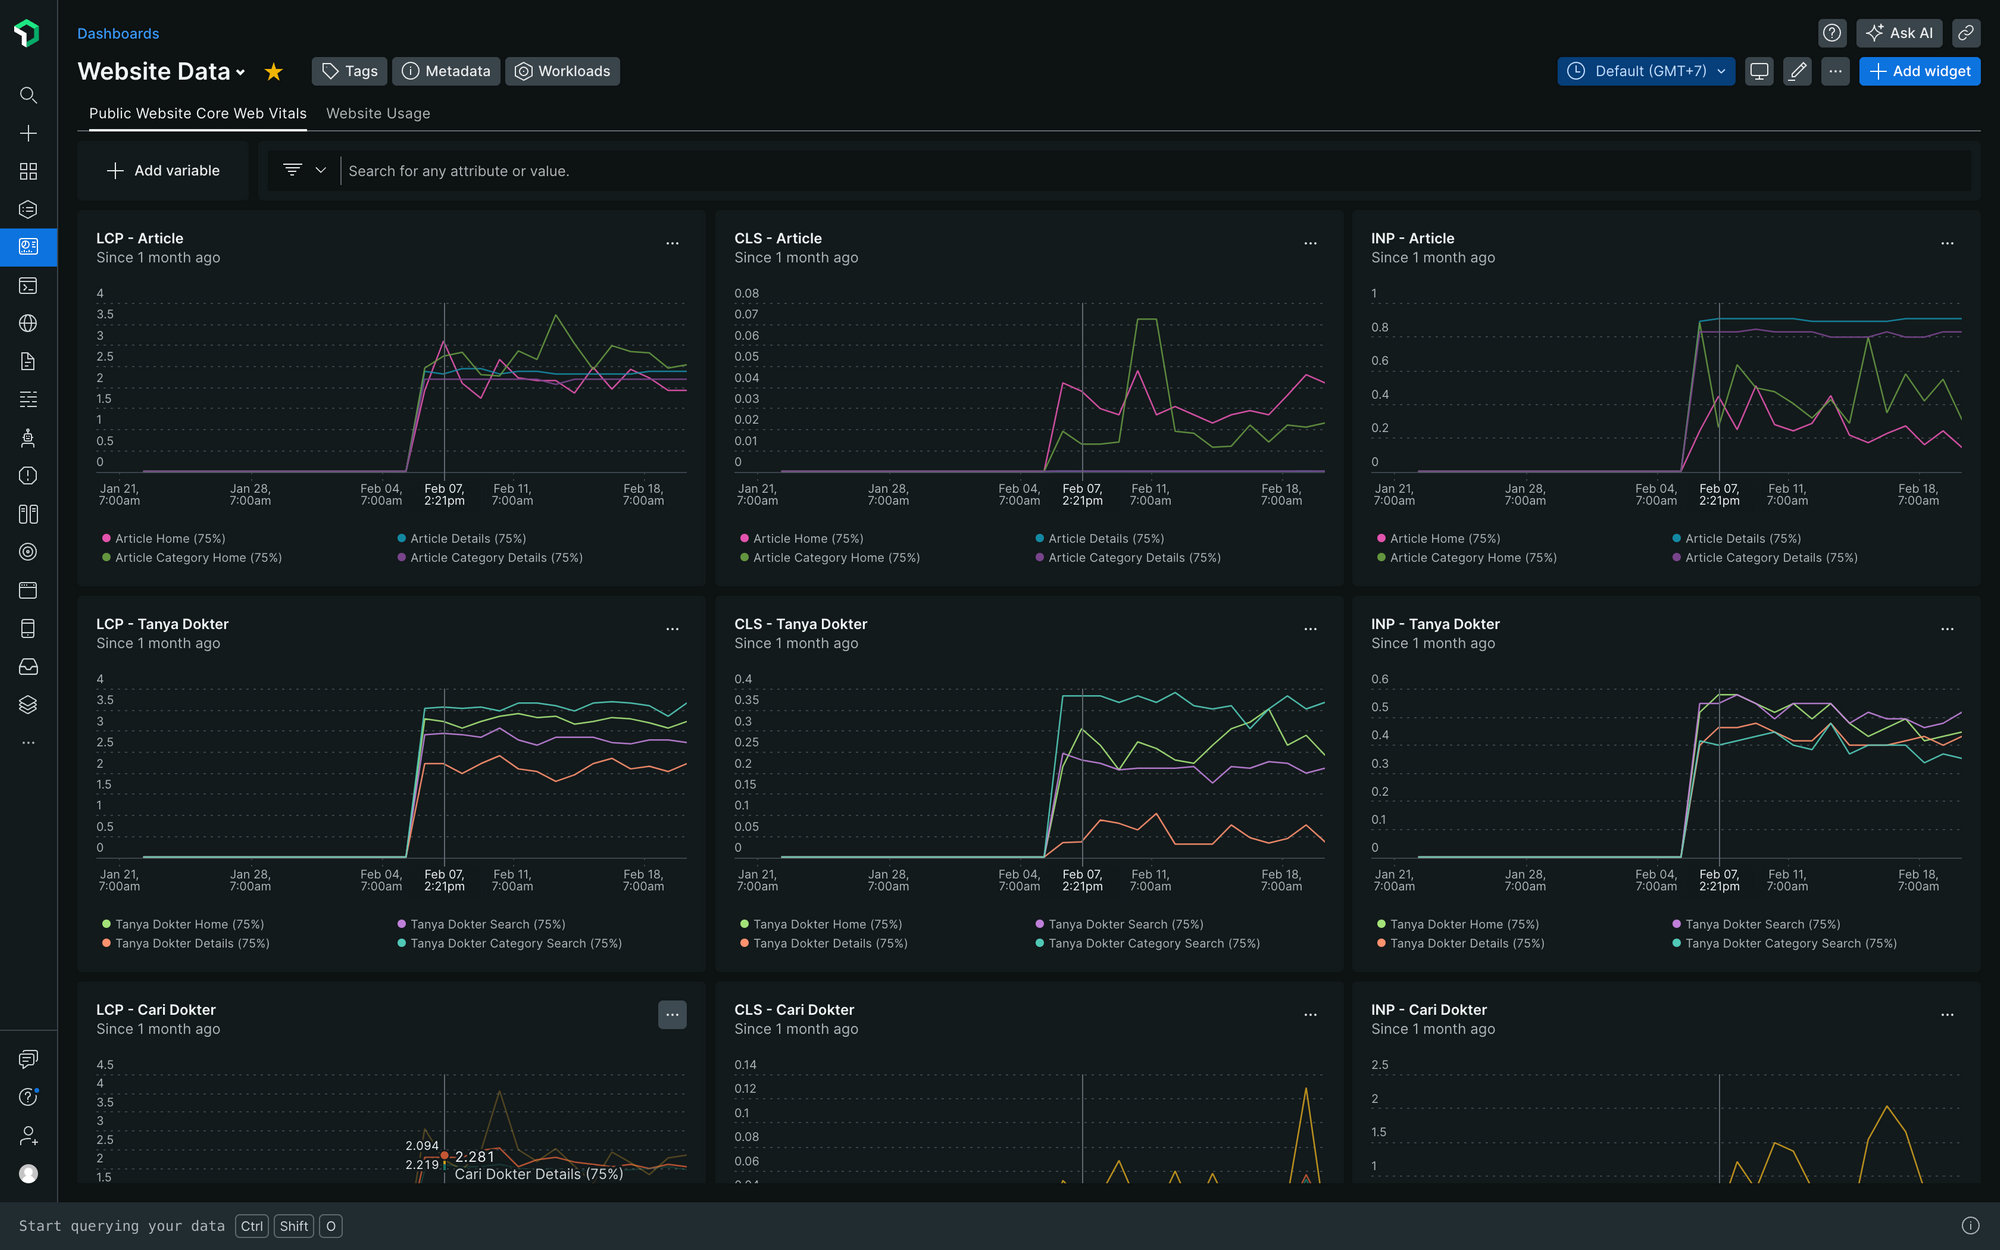
Here's how we crafted this dashboard:
- Go to the Dashboard menu.
- Choose "Create a dashboard" and fill in the required details.
- Find the new dashboard and select "Add widget".
At Halodoc, we use queries to visualize our data. The image below shows how we created a chart using a query.
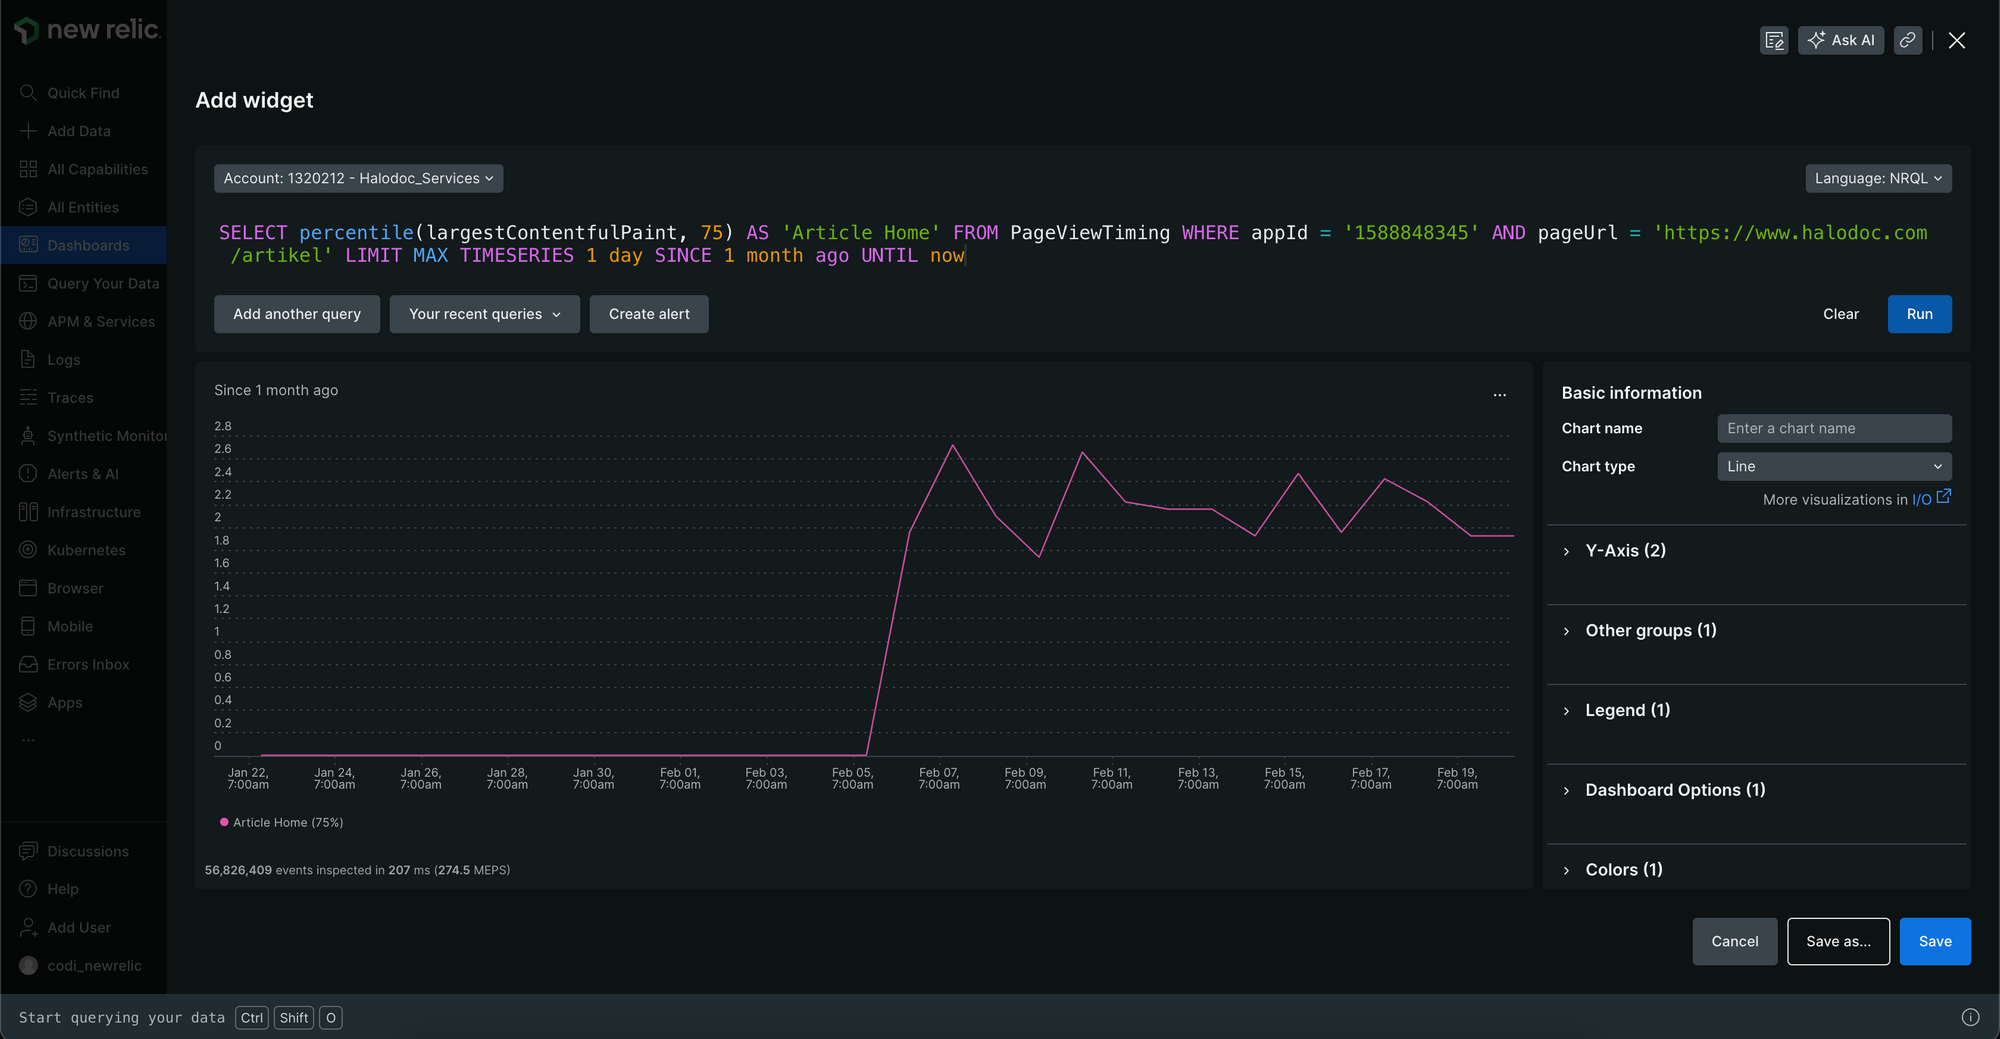
SELECT percentile(largestContentfulPaint, 75) AS 'Article Home' FROM PageViewTiming WHERE appId = '1588848345' AND pageUrl = 'https://www.halodoc.com/artikel' LIMIT MAX TIMESERIES 1 day SINCE 1 month ago UNTIL now
The above query is one example of how we can create custom visualizations to monitor specific metrics for different pages on our website. It calculates the 75th percentile of the Largest Contentful Paint (LCP) metric specifically for the "Article Home" page on our website. It retrieves data from the PageViewTiming table, filtering by the application ID and page URL. The query is limited to the maximum time series data available within the past month, providing insights into the LCP performance over time for this specific page.
4. Repeat the process for CLS and INP, making sure we cover all the essential metrics.
New Relic Alerts
New Relic Alerts play a crucial role in ensuring timely response to performance incidents. It will informs us when an incident happens to our website.
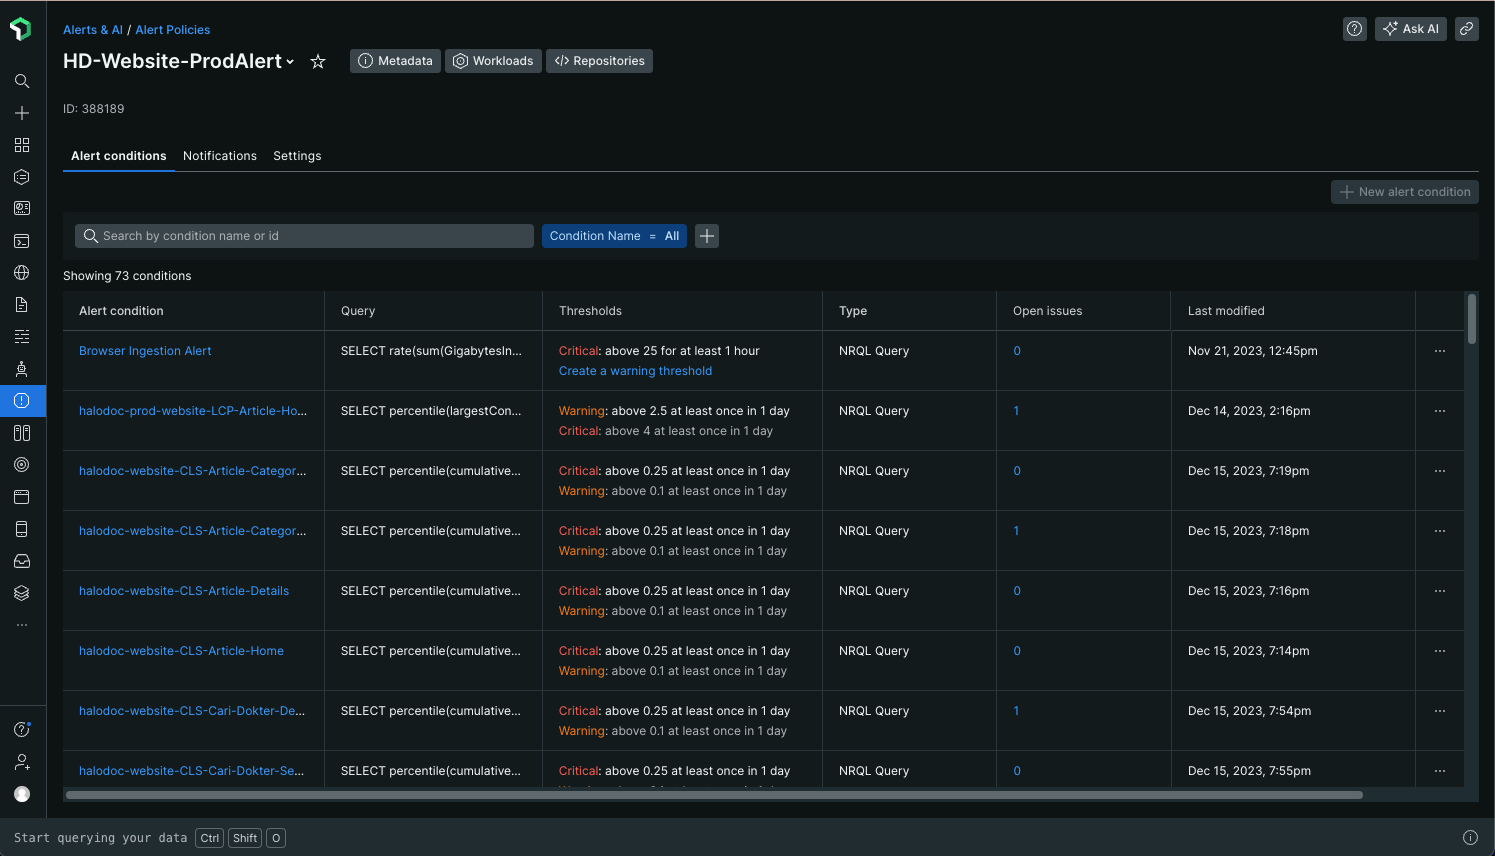
We will be notified when the defined Alert Conditions exceeds the threshold. New Relic provides several options for receiving notifications, including email, Slack, Webhook, Jira, etc.
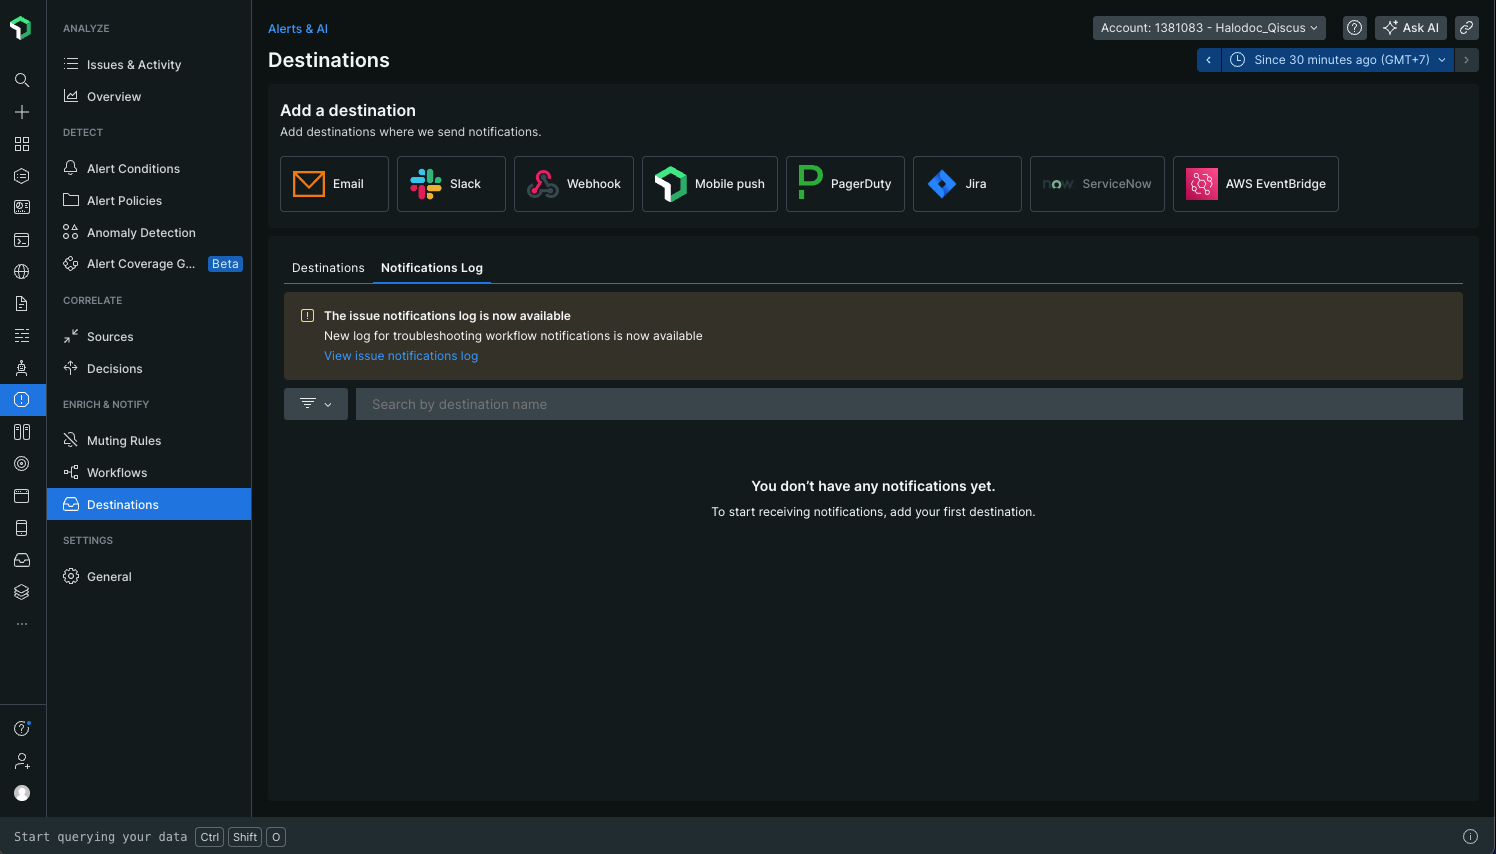
At Halodoc, we send the notification of the Core Web Vitals Alerts to Slack.
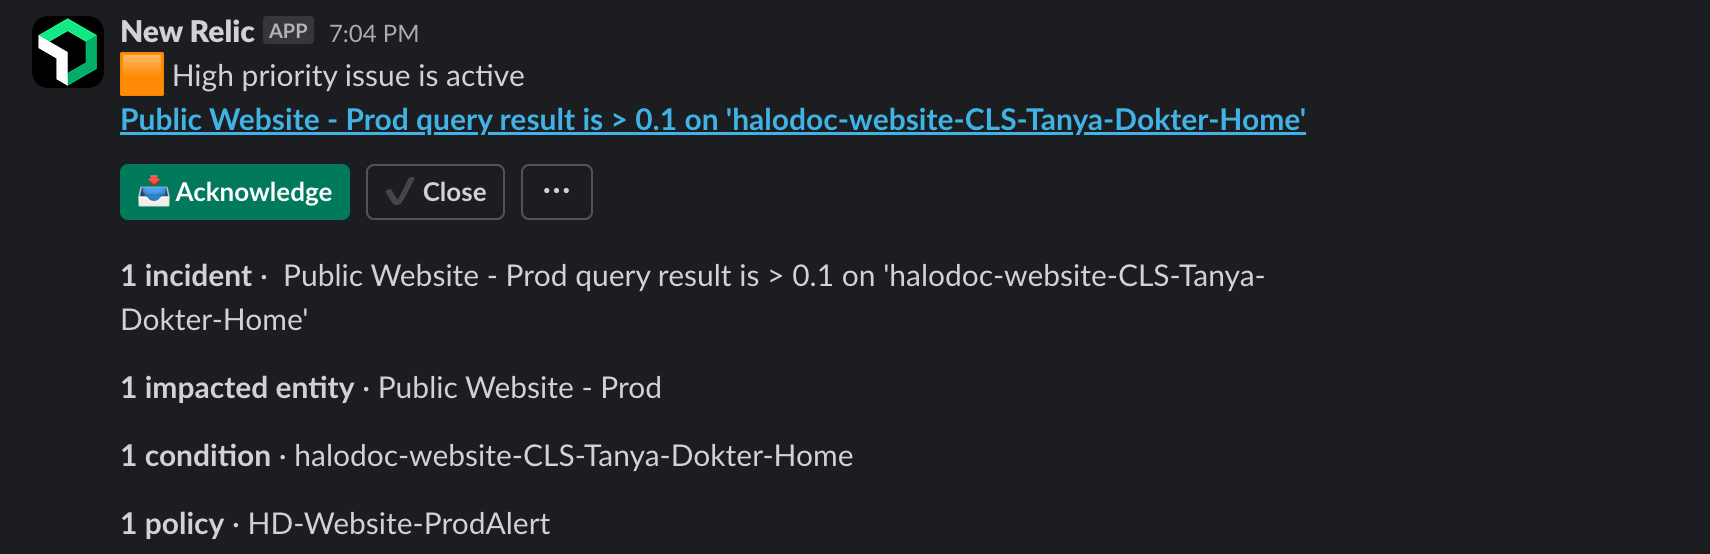
Slack notifications are automatically sent to our developers when the web vitals score exceeds the threshold. These notifications provide immediate visibility into performance issues, prompting developers to investigate further. From the Slack notification, developers can easily navigate to the New Relic page for detailed analysis. Here, they can identify potential causes of performance degradation and take necessary actions to address them promptly.
This seamless integration between New Relic Alerts and Slack empowers our teams to proactively monitor and optimize our website's performance, ensuring a smooth and responsive user experience.
Conclusion
In conclusion, the integration of New Relic into Halodoc's website has revolutionized our approach to optimizing Core Web Vitals and enhancing user experience. Through the New Relic dashboard, we've gained invaluable insights into performance metrics, enabling us to pinpoint areas for improvement and prioritize optimization efforts effectively. With scorecards providing high-level summaries and flexible filtering options facilitating in-depth analysis, we've been able to identify performance trends and user behavior patterns with precision.
Furthermore, by seamlessly integrating New Relic alerts with Slack, we've streamlined our incident response process, ensuring prompt detection and resolution of performance issues. The detailed incident information available on the New Relic Alerts page has been instrumental in understanding root causes and implementing targeted solutions. This proactive approach has helped us minimize downtime and maintain optimal website performance for our users.
References
- Web Vitals
- Understanding Core Web Vitals and Google search results
- Kurt Geiger on improving Core Web Vitals
- Enhancing the web debugging experience using source maps with New Relic browser monitoring
Join us
Scalability, reliability, and maintainability are the three pillars that govern what we build at Halodoc Tech. We are actively looking for engineers at all levels and if solving hard problems with challenging requirements is your forte, please reach out to us with your resumé at careers.india@halodoc.com
About Halodoc
Halodoc is the number 1 Healthcare application in Indonesia. Our mission is to simplify and bring quality healthcare across Indonesia, from Sabang to Merauke. We connect 20,000+ doctors with patients in need through our Tele-consultation service. We partner with 3500+ pharmacies in 100+ cities to bring medicine to your doorstep. We've also partnered with Indonesia's largest lab provider to provide lab home services, and to top it off we have recently launched a premium appointment service that partners with 500+ hospitals that allow patients to book a doctor appointment inside our application. We are extremely fortunate to be trusted by our investors, such as the Bill & Melinda Gates Foundation, Singtel, UOB Ventures, Allianz, GoJek, Astra, Temasek, and many more. We recently closed our Series D round and in total have raised around USD$100+ million for our mission. Our team works tirelessly to make sure that we create the best healthcare solution personalized for all of our patient's needs, and are continuously on a path to simplify healthcare for Indonesia.