How We Automated Android Memory Leak Triage — From LeakCanary to Merge Request with AI
At Halodoc, a user app session is rarely just a session. It is a patient describing symptoms to a doctor, someone ordering supplements for a loved one, or someone waiting on a lab result they have been anxious about all week. When the app slows to a crawl in the middle of that — scroll stutters, the keyboard takes a second to appear, and eventually the OS quietly kills the process — we don't just lose a session. We lose the moment the user needed us most.
LeakCanary already finds Android memory leaks, but by default it only tells one person — whoever is holding the phone that leaked. We replaced its notification with a reporting pipeline: every leak is serialised to disk, flushed to event logging platform when the app backgrounds, turned into a JIRA ticket, and handed to an AI skill that reasons about the reference chain from first principles and raises the fix as a reviewable GitLab merge request — including every downstream version bump a multi-module Android app requires. LeakCanary computes a leak signature by hashing the reference chain's shape, so the same structural leak yields the same signature across devices, sessions, and users — that signature is the thread running through the whole pipeline, from the on-device file to the JIRA ticket to the merge request. The result: engineers now start from an AI-authored root-cause analysis and a candidate fix instead of a cold reference chain, and review is still mandatory before anything reaches production.
This post is about how we closed that loop end to end: from LeakCanary firing on a stage build, to a reviewable merge request sitting in GitLab with a root-cause analysis attached — with no engineer reading a raw reference chain in between.
Quick Overview
- Problem — Memory leaks were detected by LeakCanary on developer and QA devices, surfaced as an on-device notification, and triaged manually. A single leak cost an engineer an estimated 60–120 minutes of reading reference chains, locating the offending code, and raising an MR. And in a multi-module AAR ecosystem, the MR was never just one MR, there were changes required in all dependent modules which increased the time further to hours.
- Solution — Replace LeakCanary's notification pipeline with a reporting pipeline: serialise every leak to disk, flush it to event logging platform when the app is backgrounded, raise a JIRA ticket from the ingested event, and hand the trace to an AI skill that analyses the leak, implements the fix, and raises the full cascade of merge requests itself.
- Outcome — Leak detection became a queryable, alertable signal instead of a toast on someone's desk. Since the pipeline went live in halodoc, it has flagged 59 LeakCanary traces as JIRA tickets; 47 of those were app leaks (leaks inside our own code, as opposed to a library) that produced a fix cascade. Of the 47 app-leak cascades, 36 have been fixed by our custom AI skill, with the rest waiting for MR/PR review by the developers. The skill takes roughly 20 minutes of machine time to analyse a trace and raise the full cascade, reducing the process time by about 70%. The engineer's job changed from "investigate this from scratch" to "evaluate this analysis."
Why Memory Leaks are not caught like crashes are caught via Crashlytics?
Most Android applications have good observability for crashes. Firebase Crashlytics tells us what died, on which device, how often, and in which release. None of that machinery helps with a leak, for three reasons:
1. There is no crash to report. A leaked Activity doesn't throw. It sits in the heap holding a view tree, a ViewBinding, and whatever the ViewModel was caching. The app gets slower, garbage collection runs more often and for longer, and eventually the OS reclaims the process — which Crashlytics may record as a background kill.
2. The signal only exists on the device. By default, the heap analysis and the leak trace are delivered as an Android notification — a perfect delivery mechanism for exactly one person: whoever happens to be holding that phone. No triggers, no alerts, and nothing sent to the developers. The only way to learn about a leak is to open the notification and read through each trace one by one, entirely by hand.
3. The fix is rarely local. Any sufficiently large Android app stops being one repository. Features get extracted into library modules, published as versioned artifacts, and consumed by an app that pins those versions centrally. Once that's your topology, a leak inside a library module is not one edit: it's the fix, a version bump on the module itself, a bump in the shared version catalogue, and a matching bump in every downstream consumer that resolves it. One leak can mean multiple merge requests. That multiplication — not the reading of the trace — is where the manual hours actually went.
So the problem decomposed into two independent problems, and we solved them separately:
- Getting the leak off the device and into a queue is an app-architecture problem.
- Turning a queued leak into a reviewable fix across every affected repository is an automation problem.
Part 1 — How Do You Get a LeakCanary Trace Off the Device?
The reporting pipeline is wired into exactly one build of the app: stage — the internal QA app, pointed at sandbox backends, and the build our QA engineers and automation suites exercise every day. The production app ships nothing at all.
That scoping cuts both ways, deliberately. Stage is the closest thing we have to the real app that we are free to instrument — heap dumping is expensive work, and it belongs nowhere near a device in a user's hand.
The procedure breaks down into two independent steps.
1. Replacing the LeakCanary notification with a callback
The core of the change is overriding LeakCanary's default leak reporting behaviour. Instead of consuming LeakCanary's UI, we register our own EventListener and remove the two listeners that exist to talk to a human:
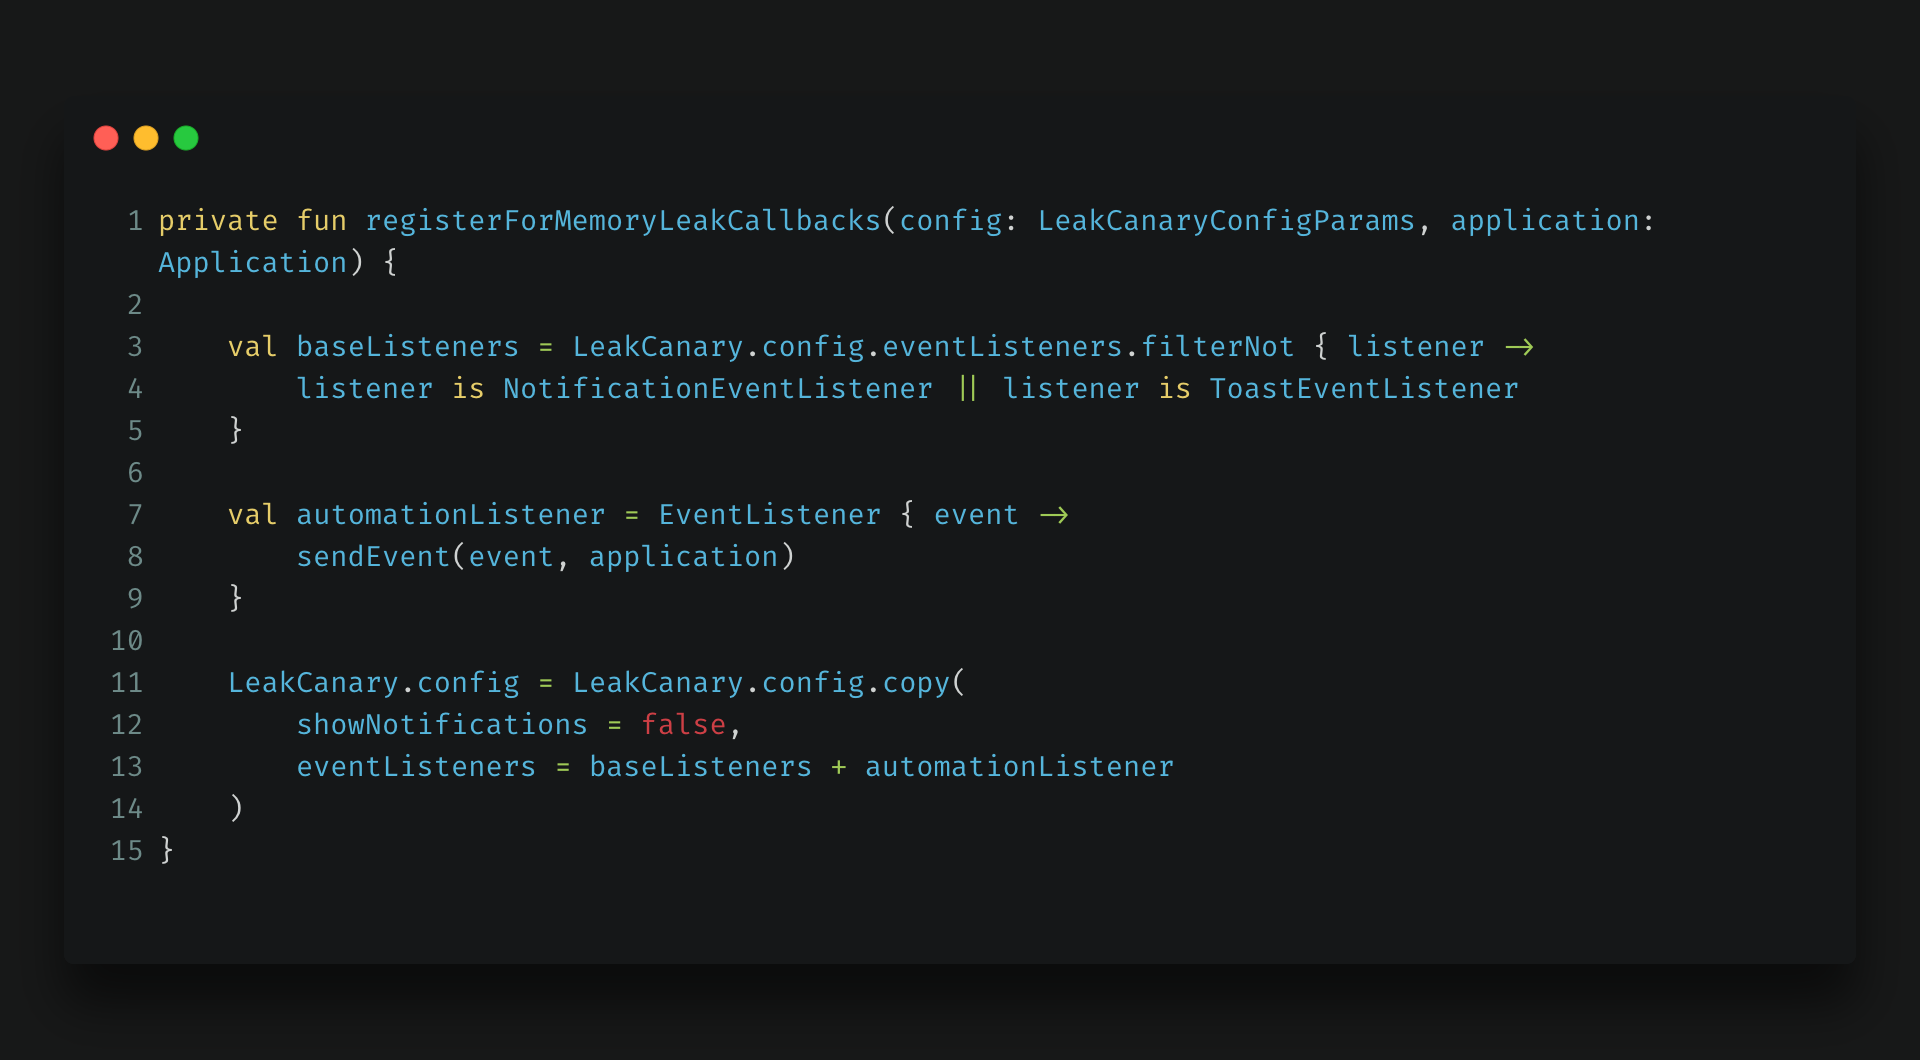
First, we filter the listener list rather than replacing it. LeakCanary's defaults do more than show notifications — they also handle heap dump lifecycle events and logging — so overwriting the list wholesale would have silently disabled behaviour we still want. showNotifications = false is the belt that goes with those suspenders.
Second, the guard is applied in two places: in Gradle, where the dependency exists only in the stage build, and at the call site in the application class, which checks the build flavour before initialising anything.
One clarification worth making explicit, because it matters for the lock two sections down: LeakCanary 2.14 (the version pinned in our Versions.kt) analyses the heap dump via BackgroundThreadHeapAnalyzer — a background thread inside the app's own process, not the separate :leakcanary process that older LeakCanary versions used for a dedicated HeapAnalyzerService. We confirmed this against the merged manifest: there's no android:process declaration for a heap-analysis service anywhere in it. So the callback below and the upload path later in this post are same-process, same-JVM code, not cross-process.
When a heap analysis completes, both leak categories go to disk:
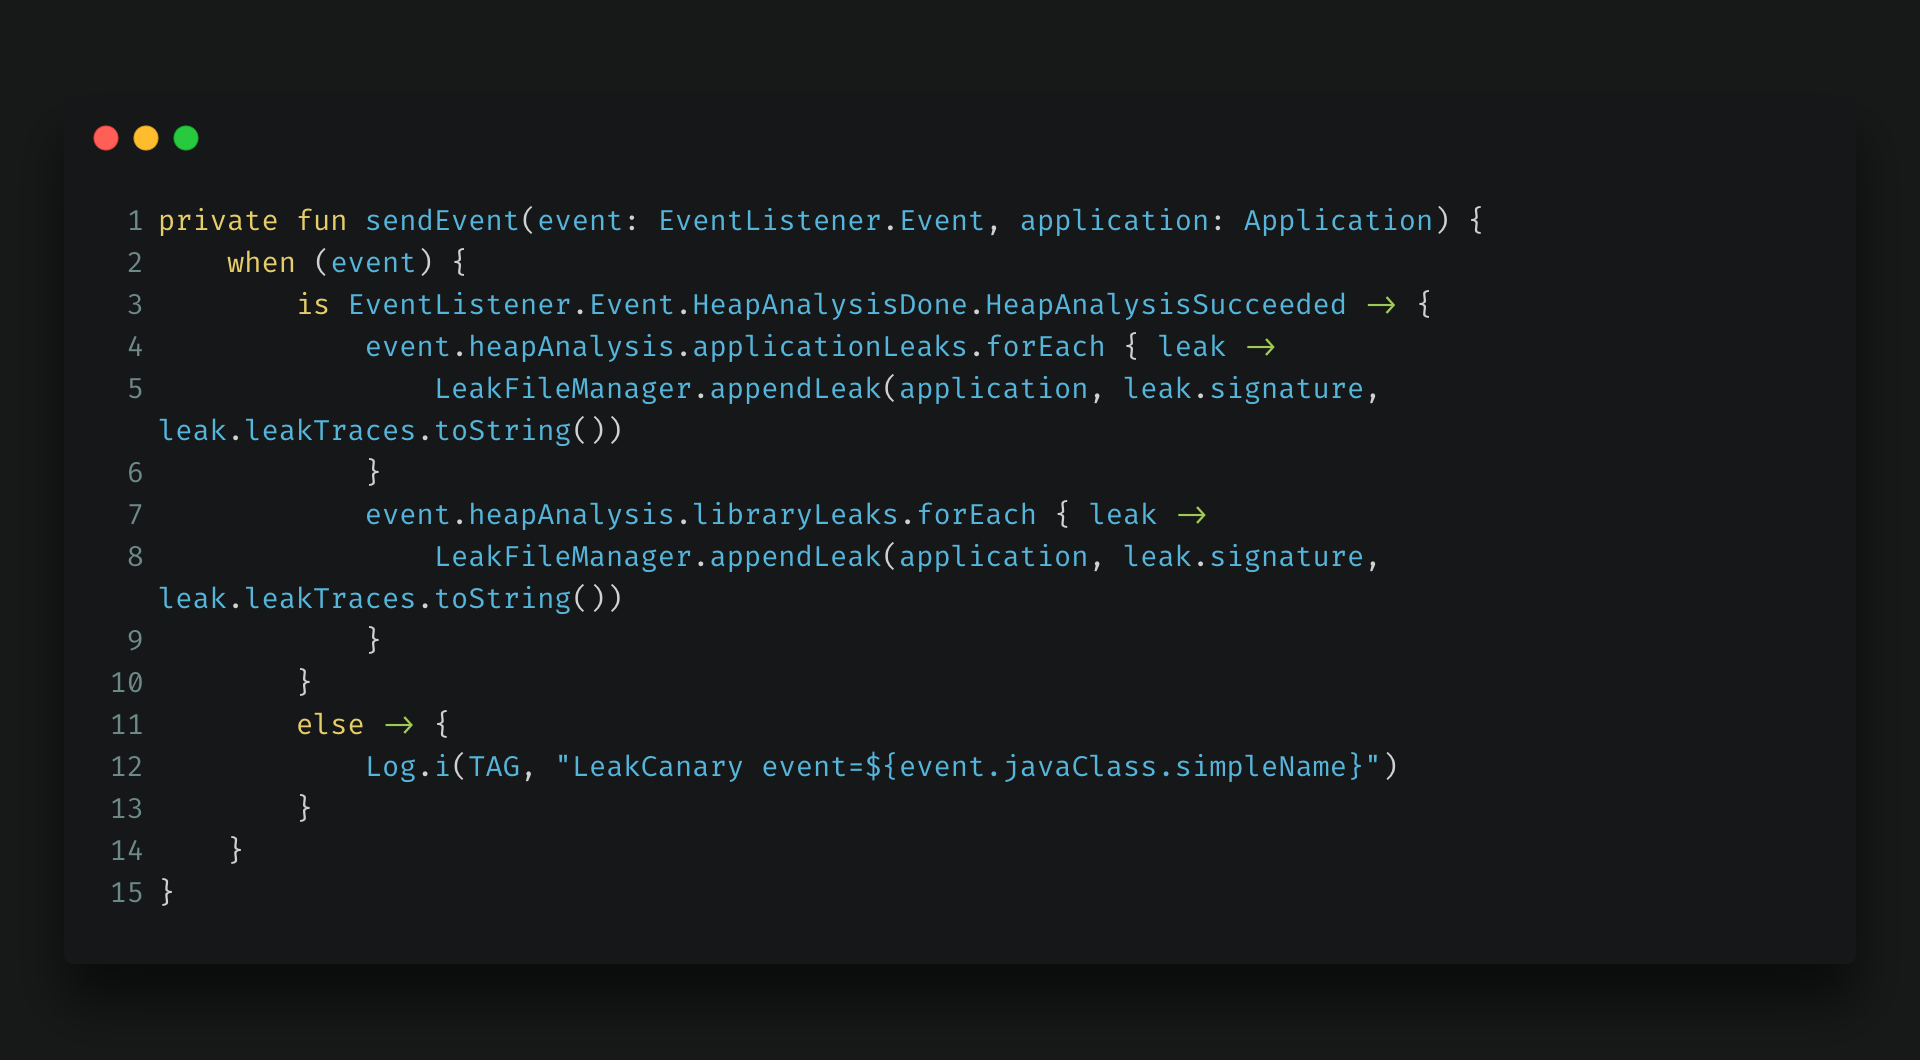
We report library leaks too, even though we can't fix third-party code. They're evidence: a library leak that starts appearing after a dependency bump belongs in a queryable dashboard, not in someone's memory. Tracking them also lets us optimise app performance by eliminating leaks that originate outside our own codebase.
LeakCanary computes a leak signature (leak.signature) by hashing the reference chain's shape — so the same structural leak yields the same signature across devices, sessions, and users. It becomes our deduplication key for the rest of the pipeline, and eventually the identifier a human reads in a JIRA title.
2. Reporting the leak
The next step is to fire an HTTP request — but not while the application is in the foreground, because a leak surfaces precisely when the app is actively being used: mid-navigation, mid-scroll, on a QA device whose connectivity may or may not be stable. Uploading a multi-kilobyte heap trace at that instant competes with the very journey you're trying to measure. And LeakCanary batches: one heap analysis routinely surfaces several leaks at once, so "fire a request" is really "fire six requests, now."
So leaks land in an append-only file first, one JSON object per line, behind a lock that's cheap to justify now that we know appending and reading both happen in the same process:
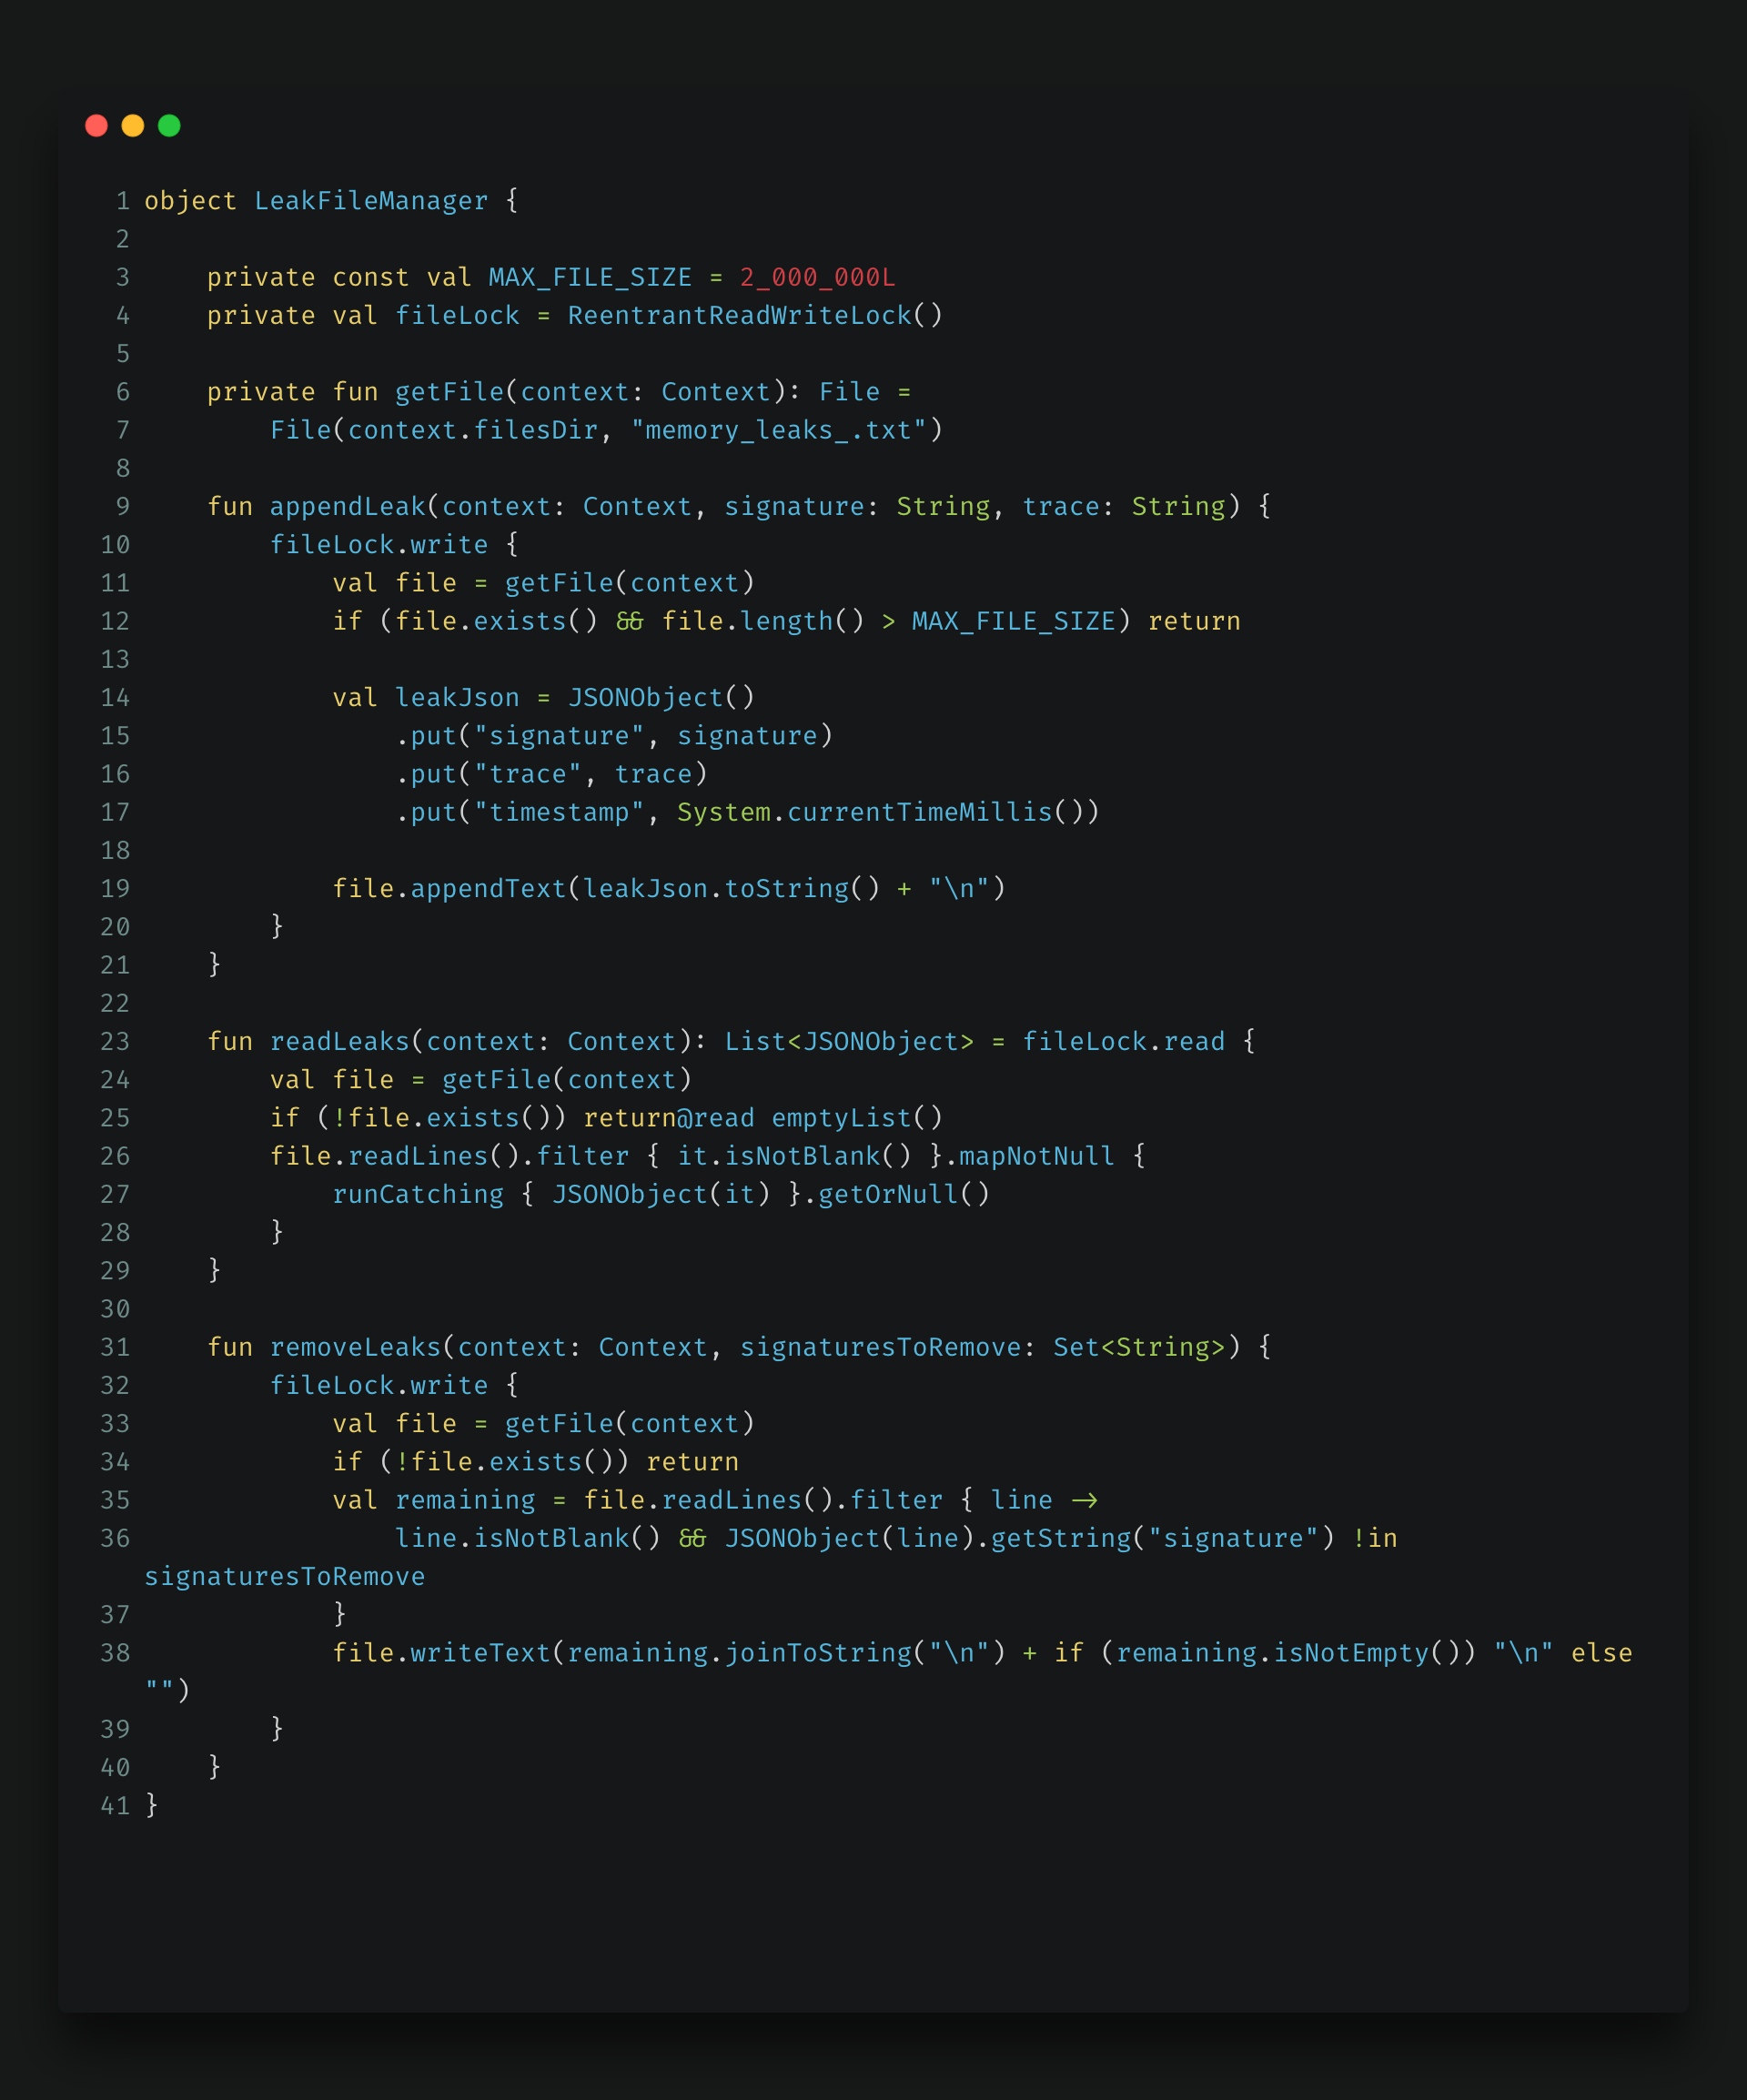
When that file is flushed, each leak becomes a custom event on the logging platform via the events ingest API — the same observability sink we already use across our backend services. The flush trigger is ProcessLifecycleOwner — process-wide lifecycle, not per-Activity:
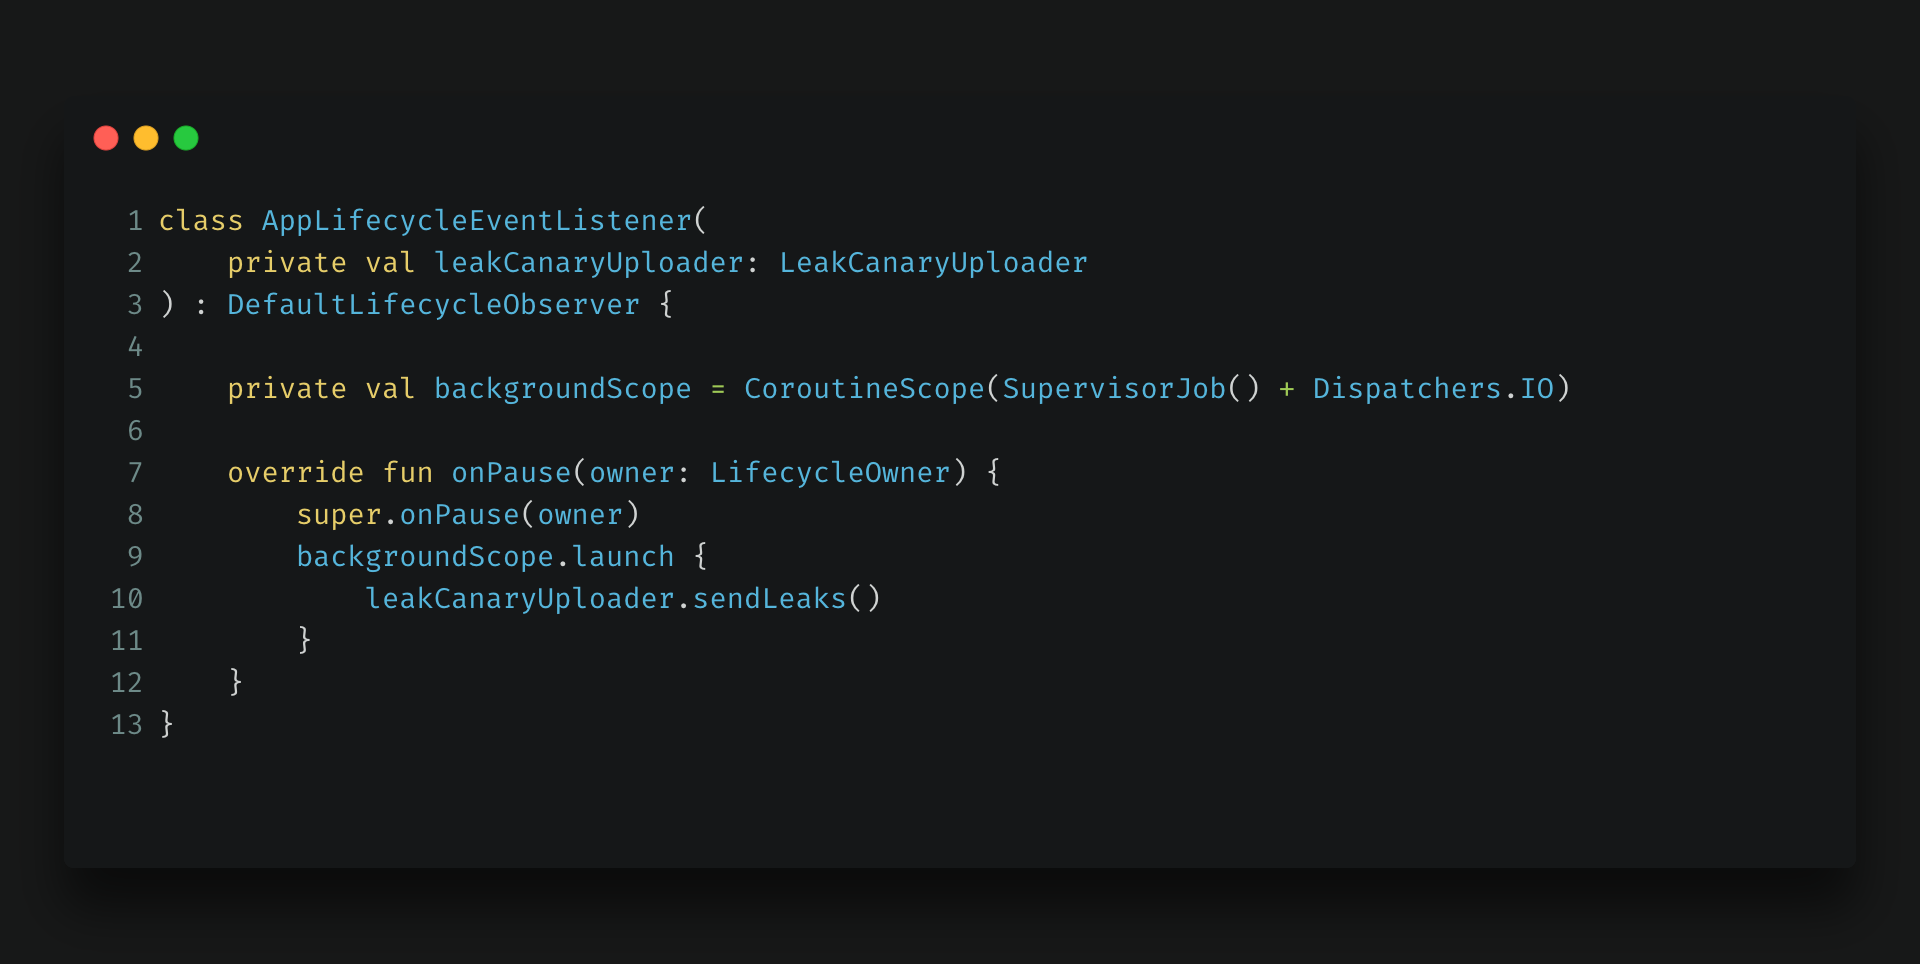
ProcessLifecycleOwner is the right abstraction here precisely because it does not fire on every Activity transition. It emits ON_PAUSE when the application goes to the background, and it survives configuration changes and Activity swaps within the app. Navigating from the home screen into a teleconsultation doesn't trigger an upload. Pressing home does.
The uploader itself is where the delivery semantics live:
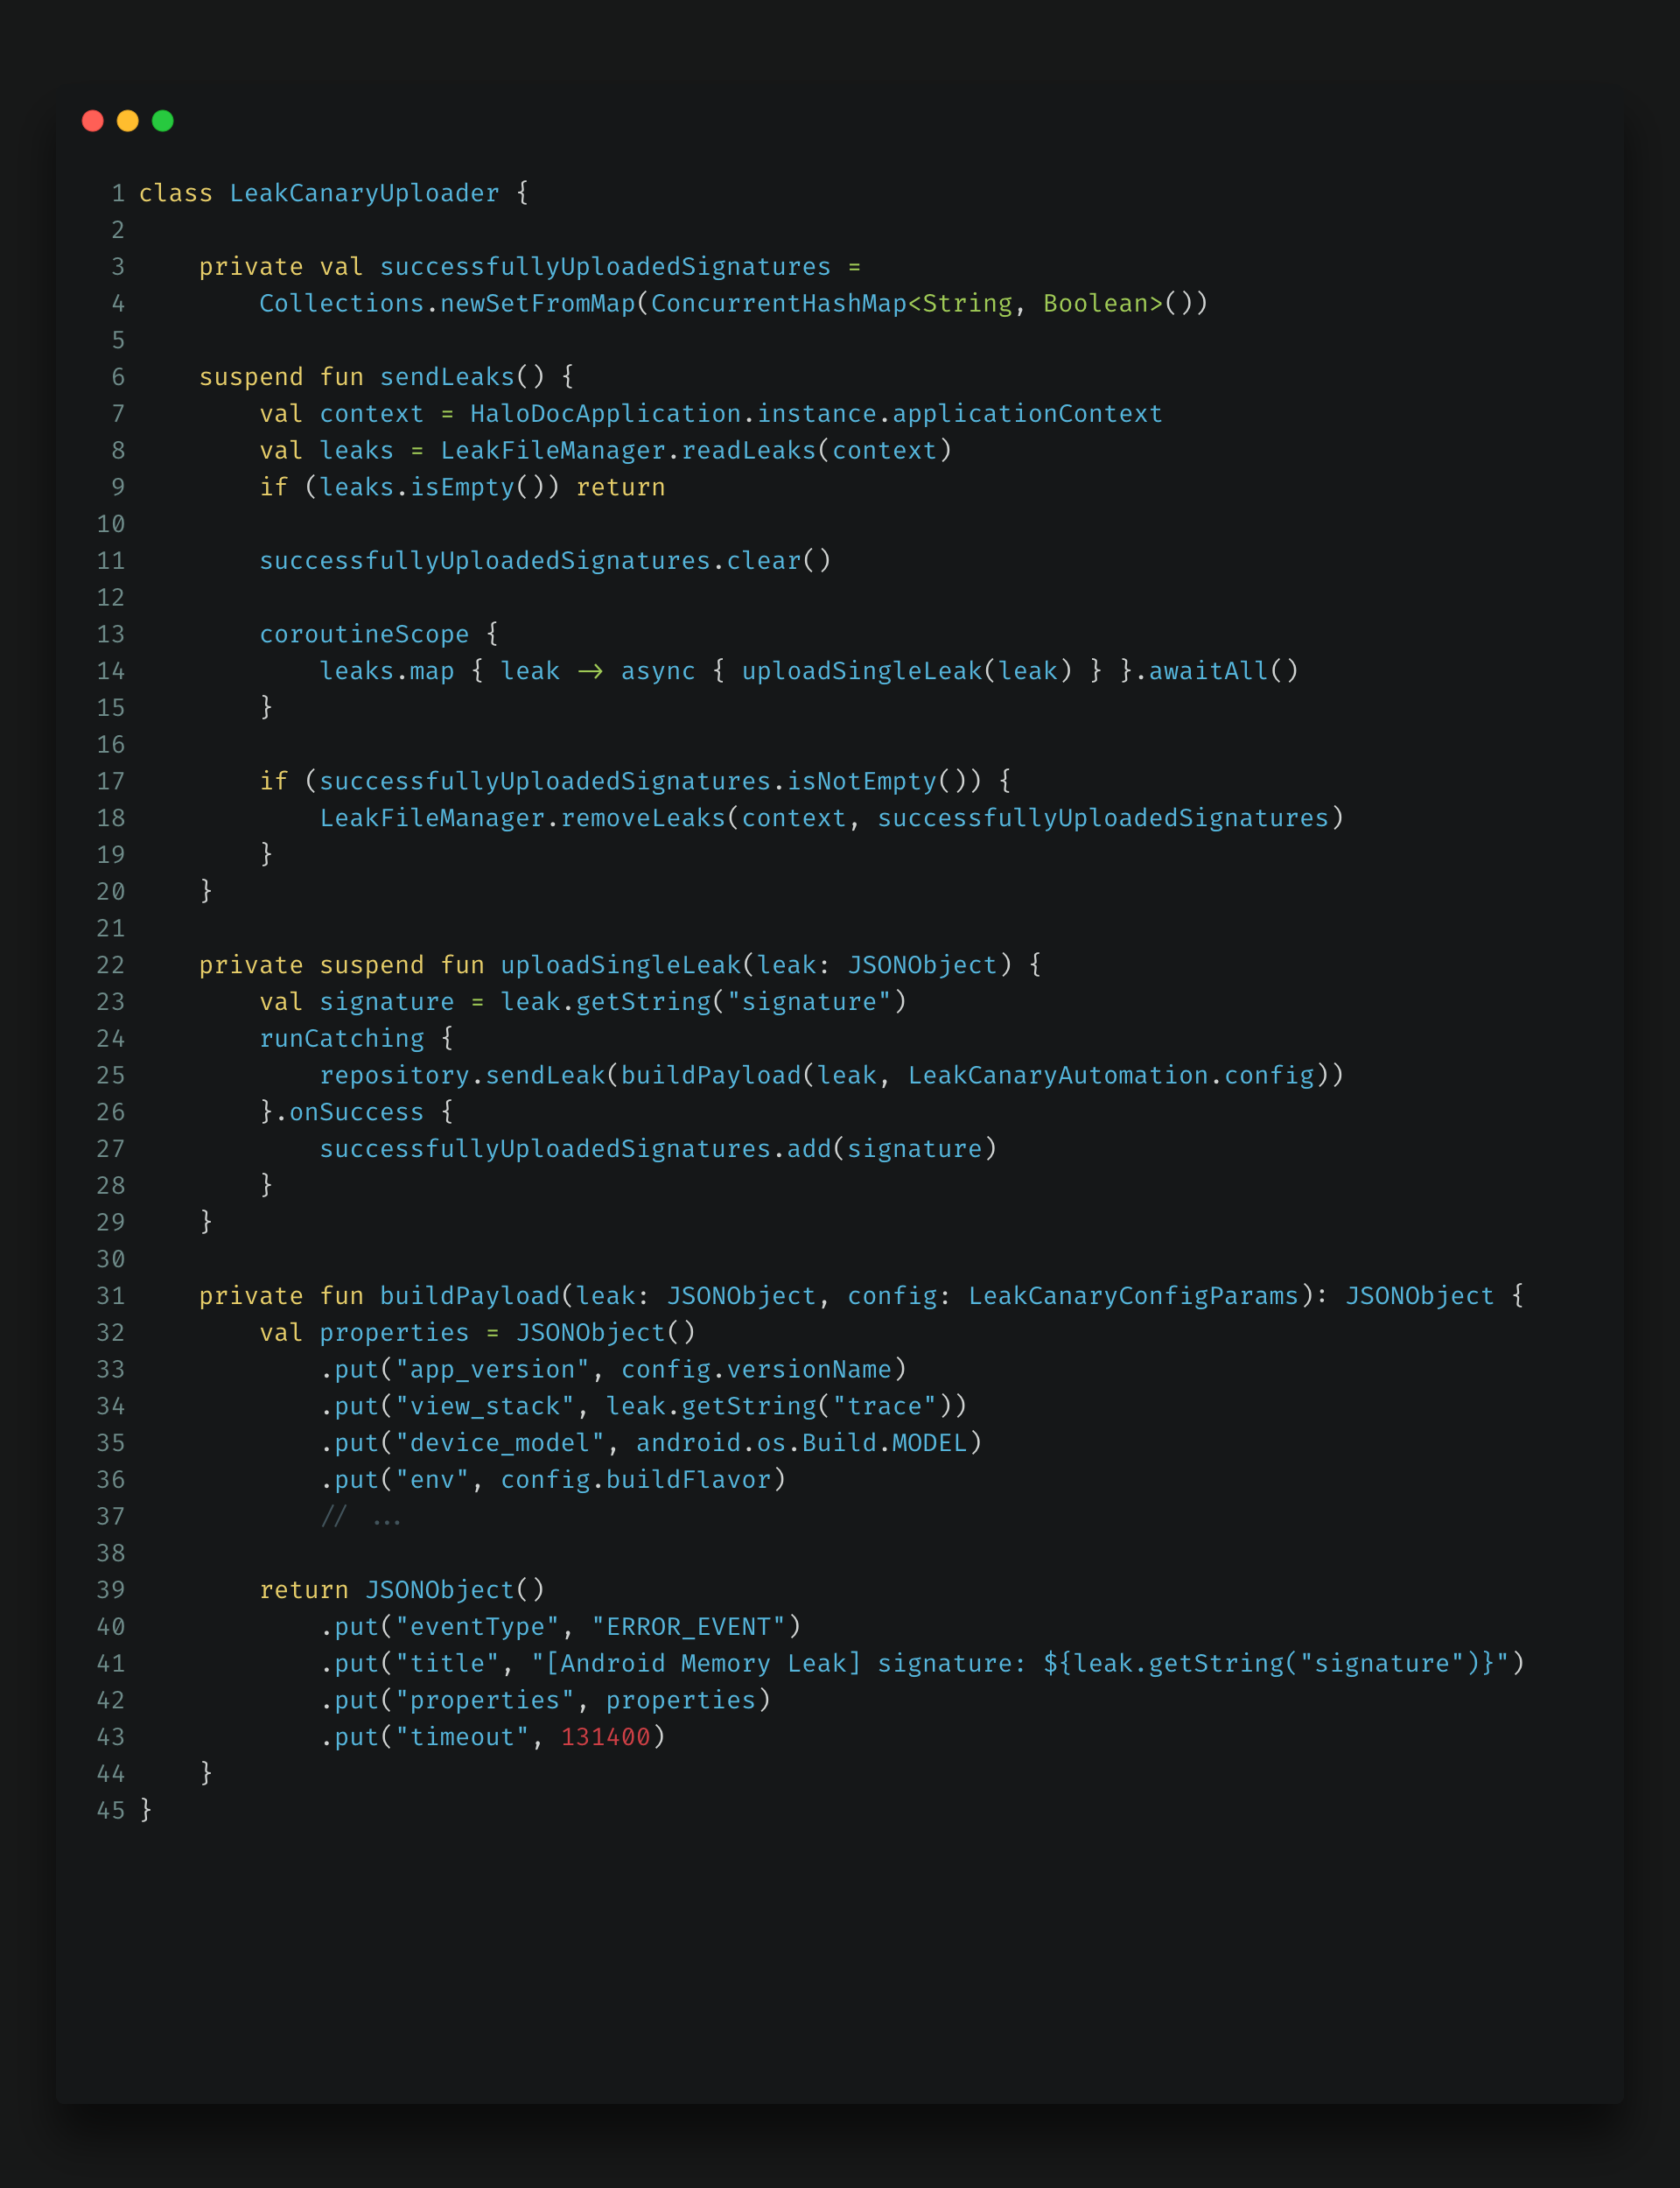
The pattern here is delete-on-confirmed-success, and it gives us at-least-once delivery without a retry scheduler, a WorkManager job, or a state machine. Leaks upload concurrently via async/awaitAll. Each success records its signature into a ConcurrentHashMap-backed set. Only those signatures are removed from the file. Anything that failed — dead Wi-Fi, an expired token, Event logging platform having a bad afternoon — is simply still there the next time the app is backgrounded.
Duplicate leak reports arising from multiple app sessions are managed by keeping a check on already reported leaks (key being the leak signature), if a leak with the same signature has already been reported, not triggers are invoked from the backend.
Part 2 — From Event to Ticket
Our logging platform, Dynatrace is where the signal becomes queryable, but a dashboard isn't a workflow. Somebody has to be accountable for a leak, and for us that means a JIRA ticket on the board our Android team already works from.
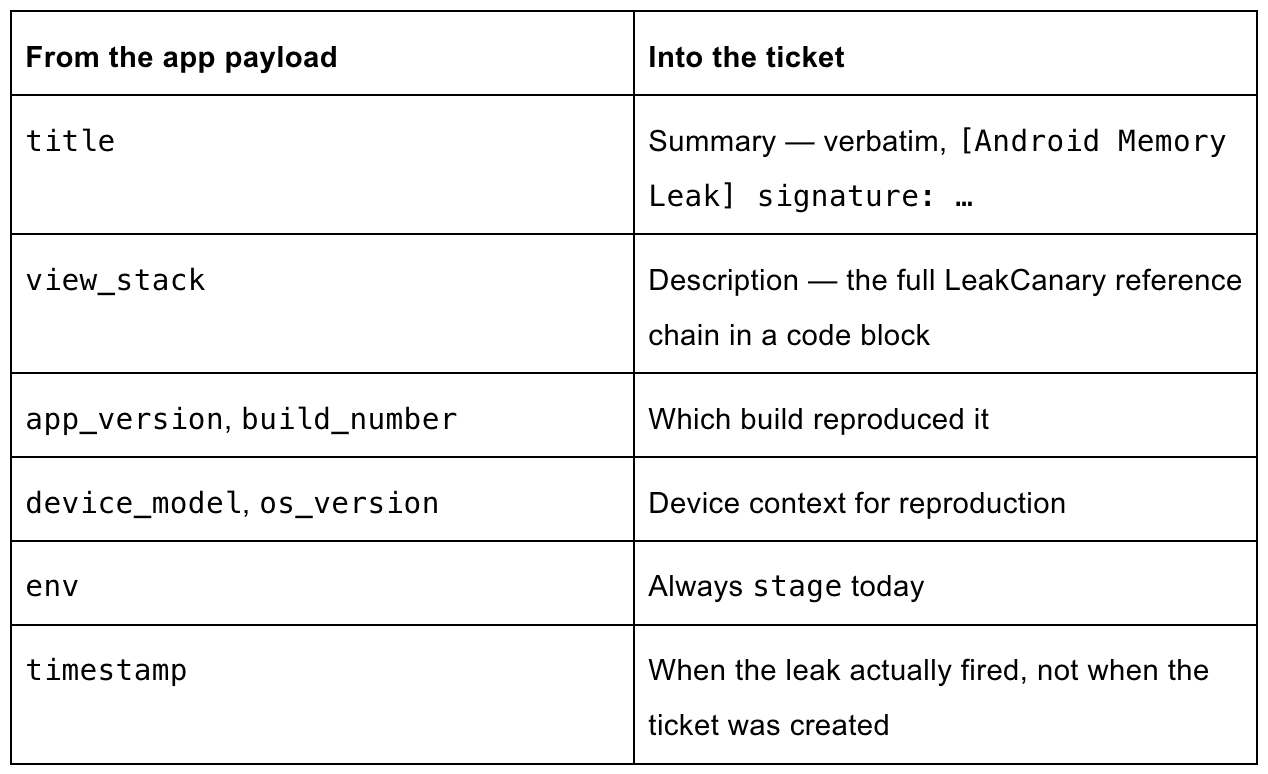
A CI/CD workflow consumes the ingested event and creates that ticket, carrying forward everything the app collected:
Where does dedup happen when the same leak hits five QA devices?
It happens one layer upstream of the ticket, not in a JQL check before creating one. Look back at buildPayload: the leak signature is baked verbatim into the event's title, and the event carries an explicit timeout of 131400 seconds (~36.5 hours). The event logging platform, Dynatrace correlates repeat custom events that share a title into a single event within that timeout window instead of opening a new one for each report — so five devices hitting the same structural leak inside that window collapse into one Dynatrace event, and the downstream ticket-creation workflow only ever sees one thing to turn into a ticket. It's dedup by construction rather than by query, and it's bounded: a sixth device reporting the same signature after the 36.5-hour window has closed would still open a fresh event, and therefore a fresh ticket.
Part 3 — The brain of the workflow: the memory-leak-solver skill
android-memoryleak-solver is Halodoc's custom AI skill — a versioned Markdown file describing a procedure, invoked by an AI model, and published to every Android engineer through our internal plugin registry.
- Not a script, not a prompt — a procedure with hard rules, guards, and named failure modes.
- Self-contained — it analyses, fixes, and raises MRs end to end. No hand-off step.
- Three input modes — pasted JIRA URLs, pasted raw traces, or a sweep of the whole board for open leak tickets.
- Deliberately narrow to Android memory leaks.
Why Not Just Use a Pattern Catalogue?
The most consequential design decision is a refusal:
Do NOT use a fixed pattern catalogue or rule engine. Reason through each trace from first principles — the reference chain, the app's navigation model, the lifecycle interactions, and the Android memory model are your raw material.
Never assume — always read the source before referencing any class, method, or file path.
- The tempting alternative is a lookup table — ViewBinding → clear it in onDestroyView; static context → WeakReference; registered listener → unregister it in the matching callback.
- Those rules are correct, and they're the easy 20%. Encoding them all but guarantees that the automation will confidently misapply a known pattern to a leak that merely resembles one.
- The expensive leaks are the surprising ones. From a real run: a Fragment registered its own Toolbar as the host Activity's support action bar and never detached it in onDestroyView(), so the Activity's AppCompatDelegate held the destroyed view subtree for the Activity's entire lifetime. No catalogue contains that entry.
- "Read the source first" is the guard that keeps first-principles reasoning from becoming a confident invention.
Headless by construction
The skill never asks a question — no interactive prompts, no waiting for confirmation, at any step. That is what makes it CI-compatible rather than merely convenient: every reported leak is processed while the automation job runs, with nobody at a keyboard. In exchange, it needs a three-level log vocabulary that doubles as an audit trail:
- ℹ️ AUTO: — a decision the skill made without you watching. Cloning a missing repo, reusing an existing branch, choosing to analyse all 12 open tickets.
- ⚠️ WARN: — something is wrong; the skill continues and states the consequence. Consumer detection returned zero, unit tests failed, glab isn't authenticated.
- ❌ FATAL: — stopping — here's what to fix. The module source couldn't be cloned, the build doesn't compile, the version-authority rule was violated.
- The ⚠️ WARN: lines are where the skill's character shows: each one states the downstream consequence, not just the fact. "Consumer detection found zero consumers" is a fact — the skill adds "a false empty here means real downstream consumers stay silently pinned to the old artifact after this run," which tells a reviewer what to go and check. That is a warning written by someone who has been burned by a silent zero.
Steps 1–3: fail fast, then find the work
- Checks end-of-run tooling up front — glab auth, python3, pyyaml — and warns rather than stops. A library-leak-only run never raises an MR and doesn't need glab; discovering the gap after forty minutes of analysis would be maddening. Fail-fast warnings, fatal only when actually blocked.
- Finds work with one JQL query:
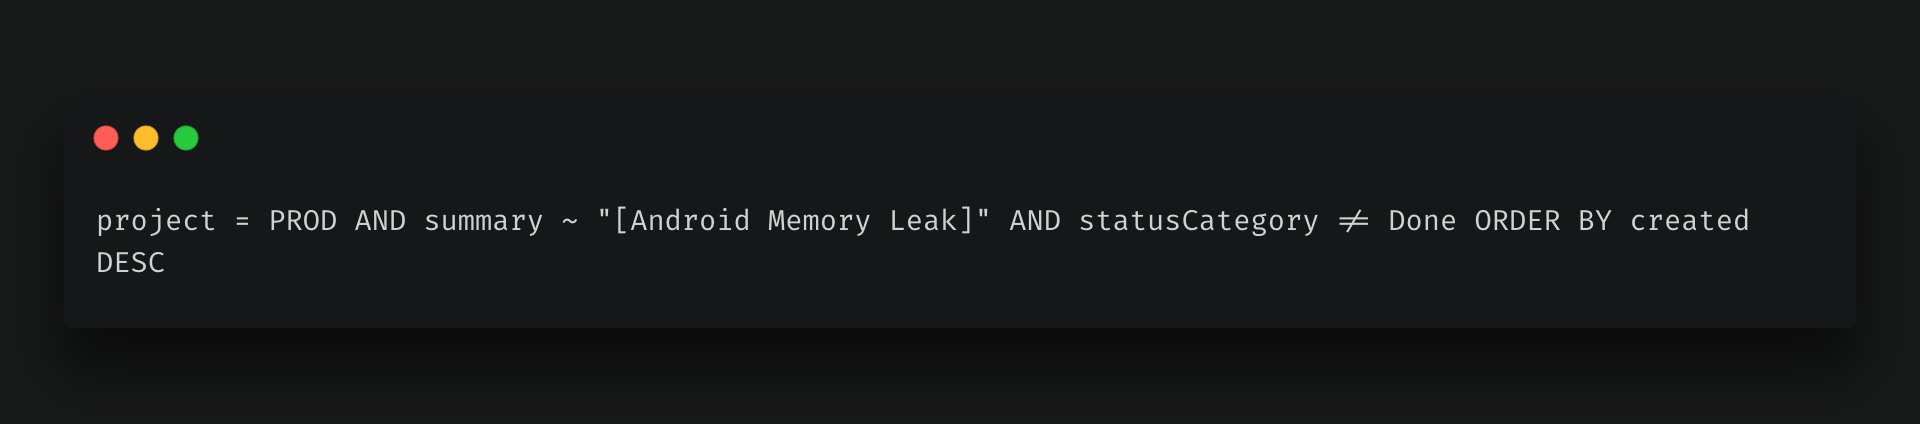
Use {jira_search_tool} (resolved in Step 2) with maxResults: 50. Log the matched tickets and proceed autonomously — analyse all of them, no confirmation.
- That JQL is the other end of the contract the app established in buildPayload.
- The filter is strict — a ticket without [Android Memory Leak] in its title is skipped and reported as skipped, never quietly analysed anyway.
Step 4: classifying whether the leak lives in our own codebase
Classification precedes analysis, because it decides how much work is worth doing:
- Library leak — the leaking object and the entire chain sit in android., androidx., com.google., com.squareup., kotlin. or java. packages. Gets a brief summary and an upgrade-or-workaround note. No fix, no MR.
- App leak — at least one first-party application package appears in the chain. Full analysis, fix, MR cascade.
- Unclear or obfuscated — degrades to reasoning about the chain's shape rather than package names, emits ⚠️ WARN: Leak type unclear from trace, and recommends manual review. It says so in the output instead of guessing a package and fixing the wrong module.
Module resolution is what makes multi-repo work possible at all:
- Map package → module + git URL via a bundled module registry: a checked-in catalogue of every module, its owning repository, and its published artifact.
- Cross-check the local workspace config for an existing clone of that repository.
- Clone automatically if absent — and treat failure as one of the few genuine hard stops:
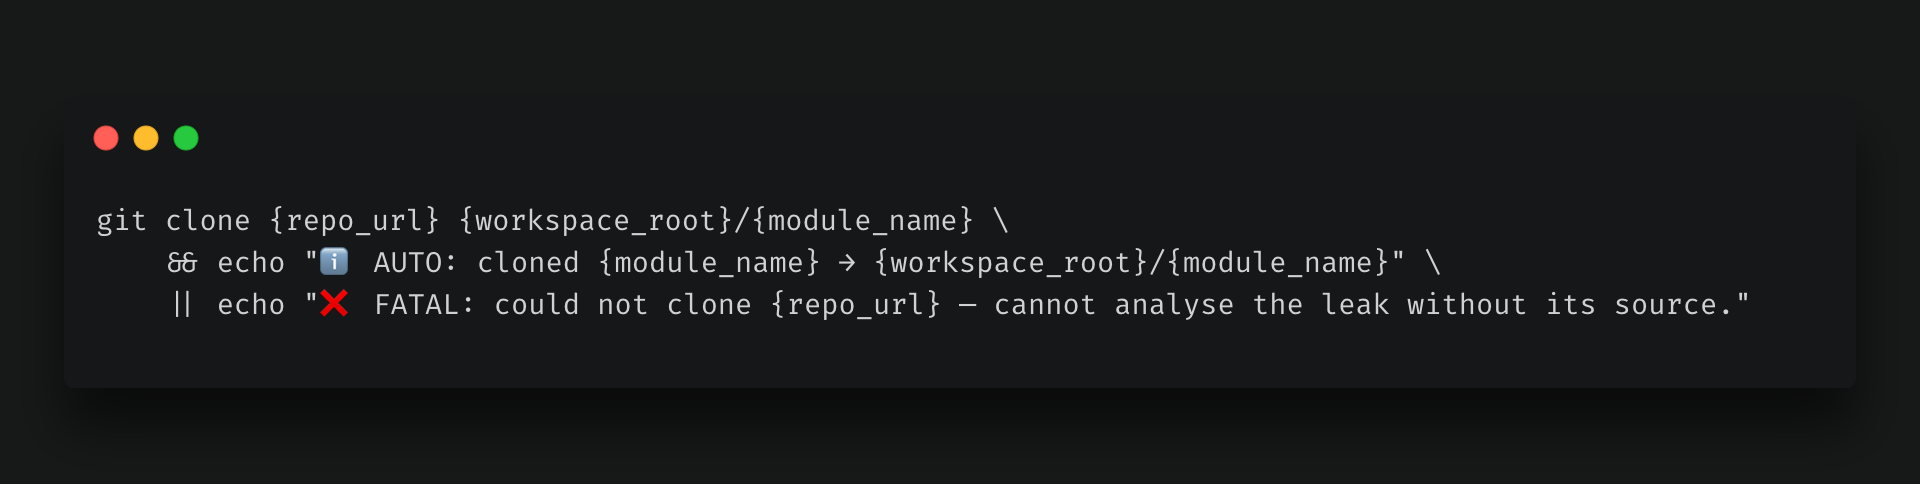
Everything downstream depends on reading real code, so the skill fails loudly rather than analysing a module it cannot see.
Step 5: the analysis
Five outputs per app leak, each constrained to be short:
- Reference chain narrative — 2–3 sentences: "X holds a strong reference to Y via field Z. Y should be released when [event], but X outlives it because [reason]."
- User journey — which navigation event should have released the object, and whether the leak compounds on repeated traversal. One instance per back-press is a very different severity from one instance ever.
- Root cause — exactly one sentence, naming the mechanism.
- Steps to reproduce — including "repeat N times to confirm compounding."
- Fix approach — 3–5 bullets, explicitly no code.
- Why no code yet: the diff comes in Step 9, after module resolution has confirmed which repository and files are actually involved. Writing the fix during analysis means writing it against a mental model of the code instead of the code itself — precisely where plausible-but-wrong fixes come from.
- The output is a single Android_mem_leaks.md, whose own template says: "Keep each section short — the document is a reference for a developer, not a research paper."
- Severity is banded, not scored: High = compounding Activity/Context leak · Medium = View/Fragment · Low = one-time · Info = library leak.
Steps 8–9: the part that is genuinely hard
Analysis is the part everyone expects to be difficult. In practice, the multi-repository version cascade is where the real complexity lives — and where the skill's rules read less like instructions than scar tissue.
The problem shape: a leak inside one library module needs the fix in that module's own repository, a SNAPSHOT bump in the shared version catalogue, and a matching bump in every module that consumes it — plus the base application at the bottom of the tree. Get any of it wrong and there's no compile error. You get a dependency-resolution failure days later, for someone else, on the integration branch.
The non-negotiable rules:
- Rule 1 — the shared version catalogue gets exactly ONE branch per run. Every bump for every module is another commit on that same fix branch, producing exactly one catalogue MR. The natural implementation — processing each consumer independently — yields one branch per consumer, several competing MRs against a single file, and a conflict for every reviewer. This is enforced by an explicit agent-spawn ban: no sub-agents, no hand-off, because each would create its own branch. Parallelism is banned here precisely because the shared mutable state is a git branch.
- Rule 2 — versions come from a tracker file, never from source. A dedicated long-lived tracker branch holds one row per module: its current SNAPSHOT version, and who bumped it. The sequence is: check out the tracker → read the current version → increment the patch → write it back → push immediately → and only then apply that same version to the shared version catalogue on the fix branch. Why not read the shared version catalogue, which is right there? Because it reflects the last merged bump, not the last raised one — two engineers both read 2.2.80, both write 2.2.81, and the second merge silently overwrites the first. Any deviation from this sequence is treated as structural and aborts the whole run.
- Rule 3 — the module's own build file must match the shared version catalogue. The build file composes the version the module publishes; the catalogue declares the version consumers ask for. Bump only the latter and CI publishes 2.2.60-SNAPSHOT while every consumer requests 2.2.81-SNAPSHOT. Nothing fails at review time; everything fails at resolution time, after merge, for everyone.
Why a version bump at all, and not just republishing the same -SNAPSHOT coordinate? Gradle treats -SNAPSHOT as a "changing" module and caches its resolution — 24 hours by default. Our own build.gradle.kts already overrides that to cacheChangingModulesFor(0, "seconds"), because we'd been burned by the default before. But even with that override in our build, resolving the same version string isn't guaranteed to mean the same bytes on every machine at every point in time — a CI agent, or a teammate's laptop with a warm module cache and no such override, can silently keep building against the previous artifact. A new version string is a new coordinate: there are no stale bytes published under a name that didn't exist an hour ago.
- Rule 4 — consumers are processed sequentially, and bumped even when they have no code changes. Library consumers first, base apps last, one at a time. A consumer with nothing to fix still needs a bump, because its consumers resolve it — skipping the no-op consumer is how a cascade silently truncates halfway down the tree.
Guards for the failure modes that actually happened:
- A workspace lock file, with a stale-lock escape hatch after an hour, so two runs can't race on local git state. Notably, it does not use trap ... EXIT: each shell command is a separate process, so the trap would fire when that one command ends, not when the run does. The lock is removed explicitly at every exit point instead — including before every ❌ FATAL:.
- Null-path guards that skip without aborting. A consumer whose repository can't be located or cloned is skipped with a warning naming exactly what state was left behind — its version was already bumped in the tracker — and the cascade continues. If every consumer was skipped, that escalates loudly, because zero consumer MRs from a non-empty list looks identical to success if you're only counting green checkmarks.
- Mid-cascade stop. The tracker is pushed before each consumer's MR is confirmed. If MR creation then fails, the skill stops rather than continuing — the tracker is now ahead of reality, and stacking more bumps on an inconsistent state compounds the problem instead of reporting it.
- Backward-compatibility check for library modules. Did the fix change a public signature? Prefer narrowing to private/internal; if a public change is unavoidable, document it under a Breaking Change heading in both the module MR and the catalogue MR, so consumer reviewers see it before merging rather than after. Run apiCheck only if the module actually has binary-compatibility-validator configured — most of ours don't, so reason from the diff instead.
What lands in version control
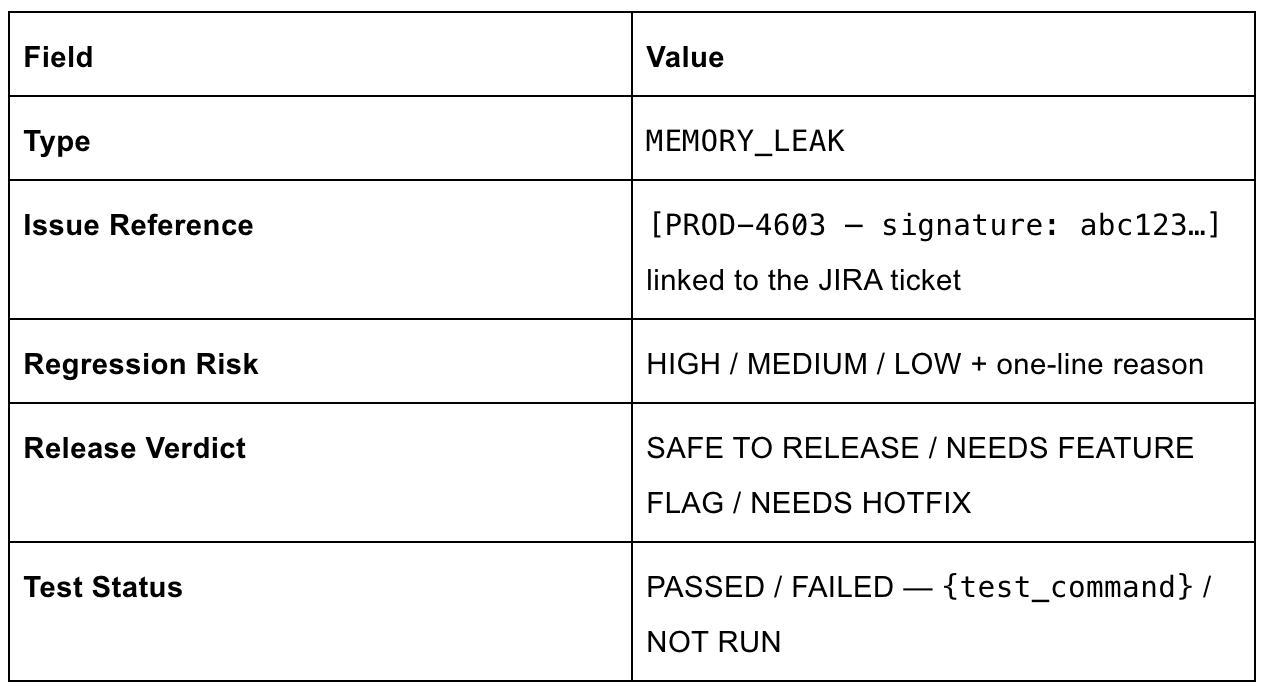
- Below the table: root cause, steps to reproduce, the actual changes, passing criteria, and merge instructions.
- Reviewer merge order is printed explicitly — the version catalogue first, then the module that was fixed, then each consumer. That ordering isn't guessable from the MRs themselves, and getting it wrong breaks the build for everyone else.
- The ai-code-review label earns its keep: it makes AI-authored MRs filterable, auditable, and countable — so we can answer "how many got merged without edits?", the only honest measure of whether any of this works. A "cascade" here means every MR tied to one leak ticket across every repository it touched — the module fix, the version-catalogue bump, and every consumer bump.
The entire process- from fetching the leak trace to raising the MR consumes an average of 180k tokens per ticket.
Limitations of the workflow
- Instances when AI is down: the leak gets reported, ticket is raised, the leak trace is sent to the AI model, but the model returns an error. This may be due to overload, or genuine failures; this is where the "Brain of our workflow" cannot show its magic, and since there is no conclusive fix, nothing lands in version control and no MR is raised. The workaround is manual intervention, using the ticket to resolve the memory leak at a later time — the android-memoryleak-solver skill is efficient enough to pick up the entire leak trace from the remote ticket whenever it's re-run.
- AI misclassification: there may be instances where AI takes a wrong decision in ambiguity, picks the wrong file from our codebase, or makes the wrong call on fixing the leak. These are super rare but inevitable, and this is the reason why the step of manual MR review is a mandatory part of the entire workflow. The review makes sure there are no anomalies in the output given by AI and ensures nothing fallacious goes to production.
Conclusion
Memory leaks were a class of Android defect at Halodoc with no pipeline behind them: no dashboard, no ticket, no owner, and a detection tool whose output reached exactly one person. Closing that gap took two independent pieces of work — teaching the app to report instead of notify, and teaching an automation to navigate a multi-module dependency graph without breaking it.
What changed isn't that leaks get fixed faster, though they do. It's that a leak is now a signal with a workflow attached. It goes to a queue, the queue produces a ticket, the ticket produces an analysis and a set of merge requests, and the merge requests produce a notification with a named reviewer. The overnight archaeology through a reference chain is optional now.
The engineer still decides. They just don't have to start from nothing.
References
- Halodoc AI skill - android-memoryleak-solver
- LeakCanary — Uploading leak traces to a server
- LeakCanary EventListener API
Join Us
Scalability, reliability and maintainability are the three pillars that govern what we build at Halodoc Tech. We are actively looking for engineers at all levels, and if solving hard problems with challenging requirements is your forte, please reach out to us with your resumé at careers.india@halodoc.com.
About Halodoc
Halodoc is the number one all-around healthcare application in Indonesia. Our mission is to simplify and deliver quality healthcare across Indonesia, from Sabang to Merauke.
Since 2016, Halodoc has been improving health literacy in Indonesia by providing user-friendly healthcare communication, education, and information (KIE). In parallel, our ecosystem has expanded to offer a range of services that facilitate convenient access to healthcare, starting with Homecare by Halodoc as a preventive care feature that allows users to conduct health tests privately and securely from the comfort of their homes; My Insurance, which allows users to access the benefits of cashless outpatient services in a more seamless way; Chat with Doctor, which allows users to consult with over 20,000 licensed physicians via chat, video or voice call; and Health Store features that allow users to purchase medicines, supplements and various health products from our network of over 4,900 trusted partner pharmacies. To deliver holistic health solutions in a fully digital way, Halodoc offers Digital Clinic services including Haloskin, a trusted dermatology care platform guided by experienced dermatologists.
We are proud to be trusted by global and regional investors, including the Bill & Melinda Gates Foundation, Singtel, UOB Ventures, Allianz, GoJek, Astra, Temasek, and many more. With over USD 100 million raised to date, including our recent Series D, our team is committed to building the best personalized healthcare solutions — and we remain steadfast in our journey to simplify healthcare for all Indonesians.