

No Green, No MR: How We Ship Core Web Vitals Fixes with an Agentic Workflow
Most people reach Halodoc on a mid-tier Android phone over throttled 4G — booking a consultation at 2 a.m., ordering medicine for a parent, filing a claim from a hospital waiting room. On a healthcare platform, speed is a trust metric, not a vanity one: a page that shifts under a thumb tapping "Buy", or takes ten seconds to paint, is a small failure of the promise to make care immediate. That is why we treat Core Web Vitals (CWV) as a first-class engineering concern, and why we built an agentic, ship-gated workflow — internally the web-perf-fix skill — that measures, fixes, verifies, and ships CWV improvements across our Angular front-ends with production-grade rigor.
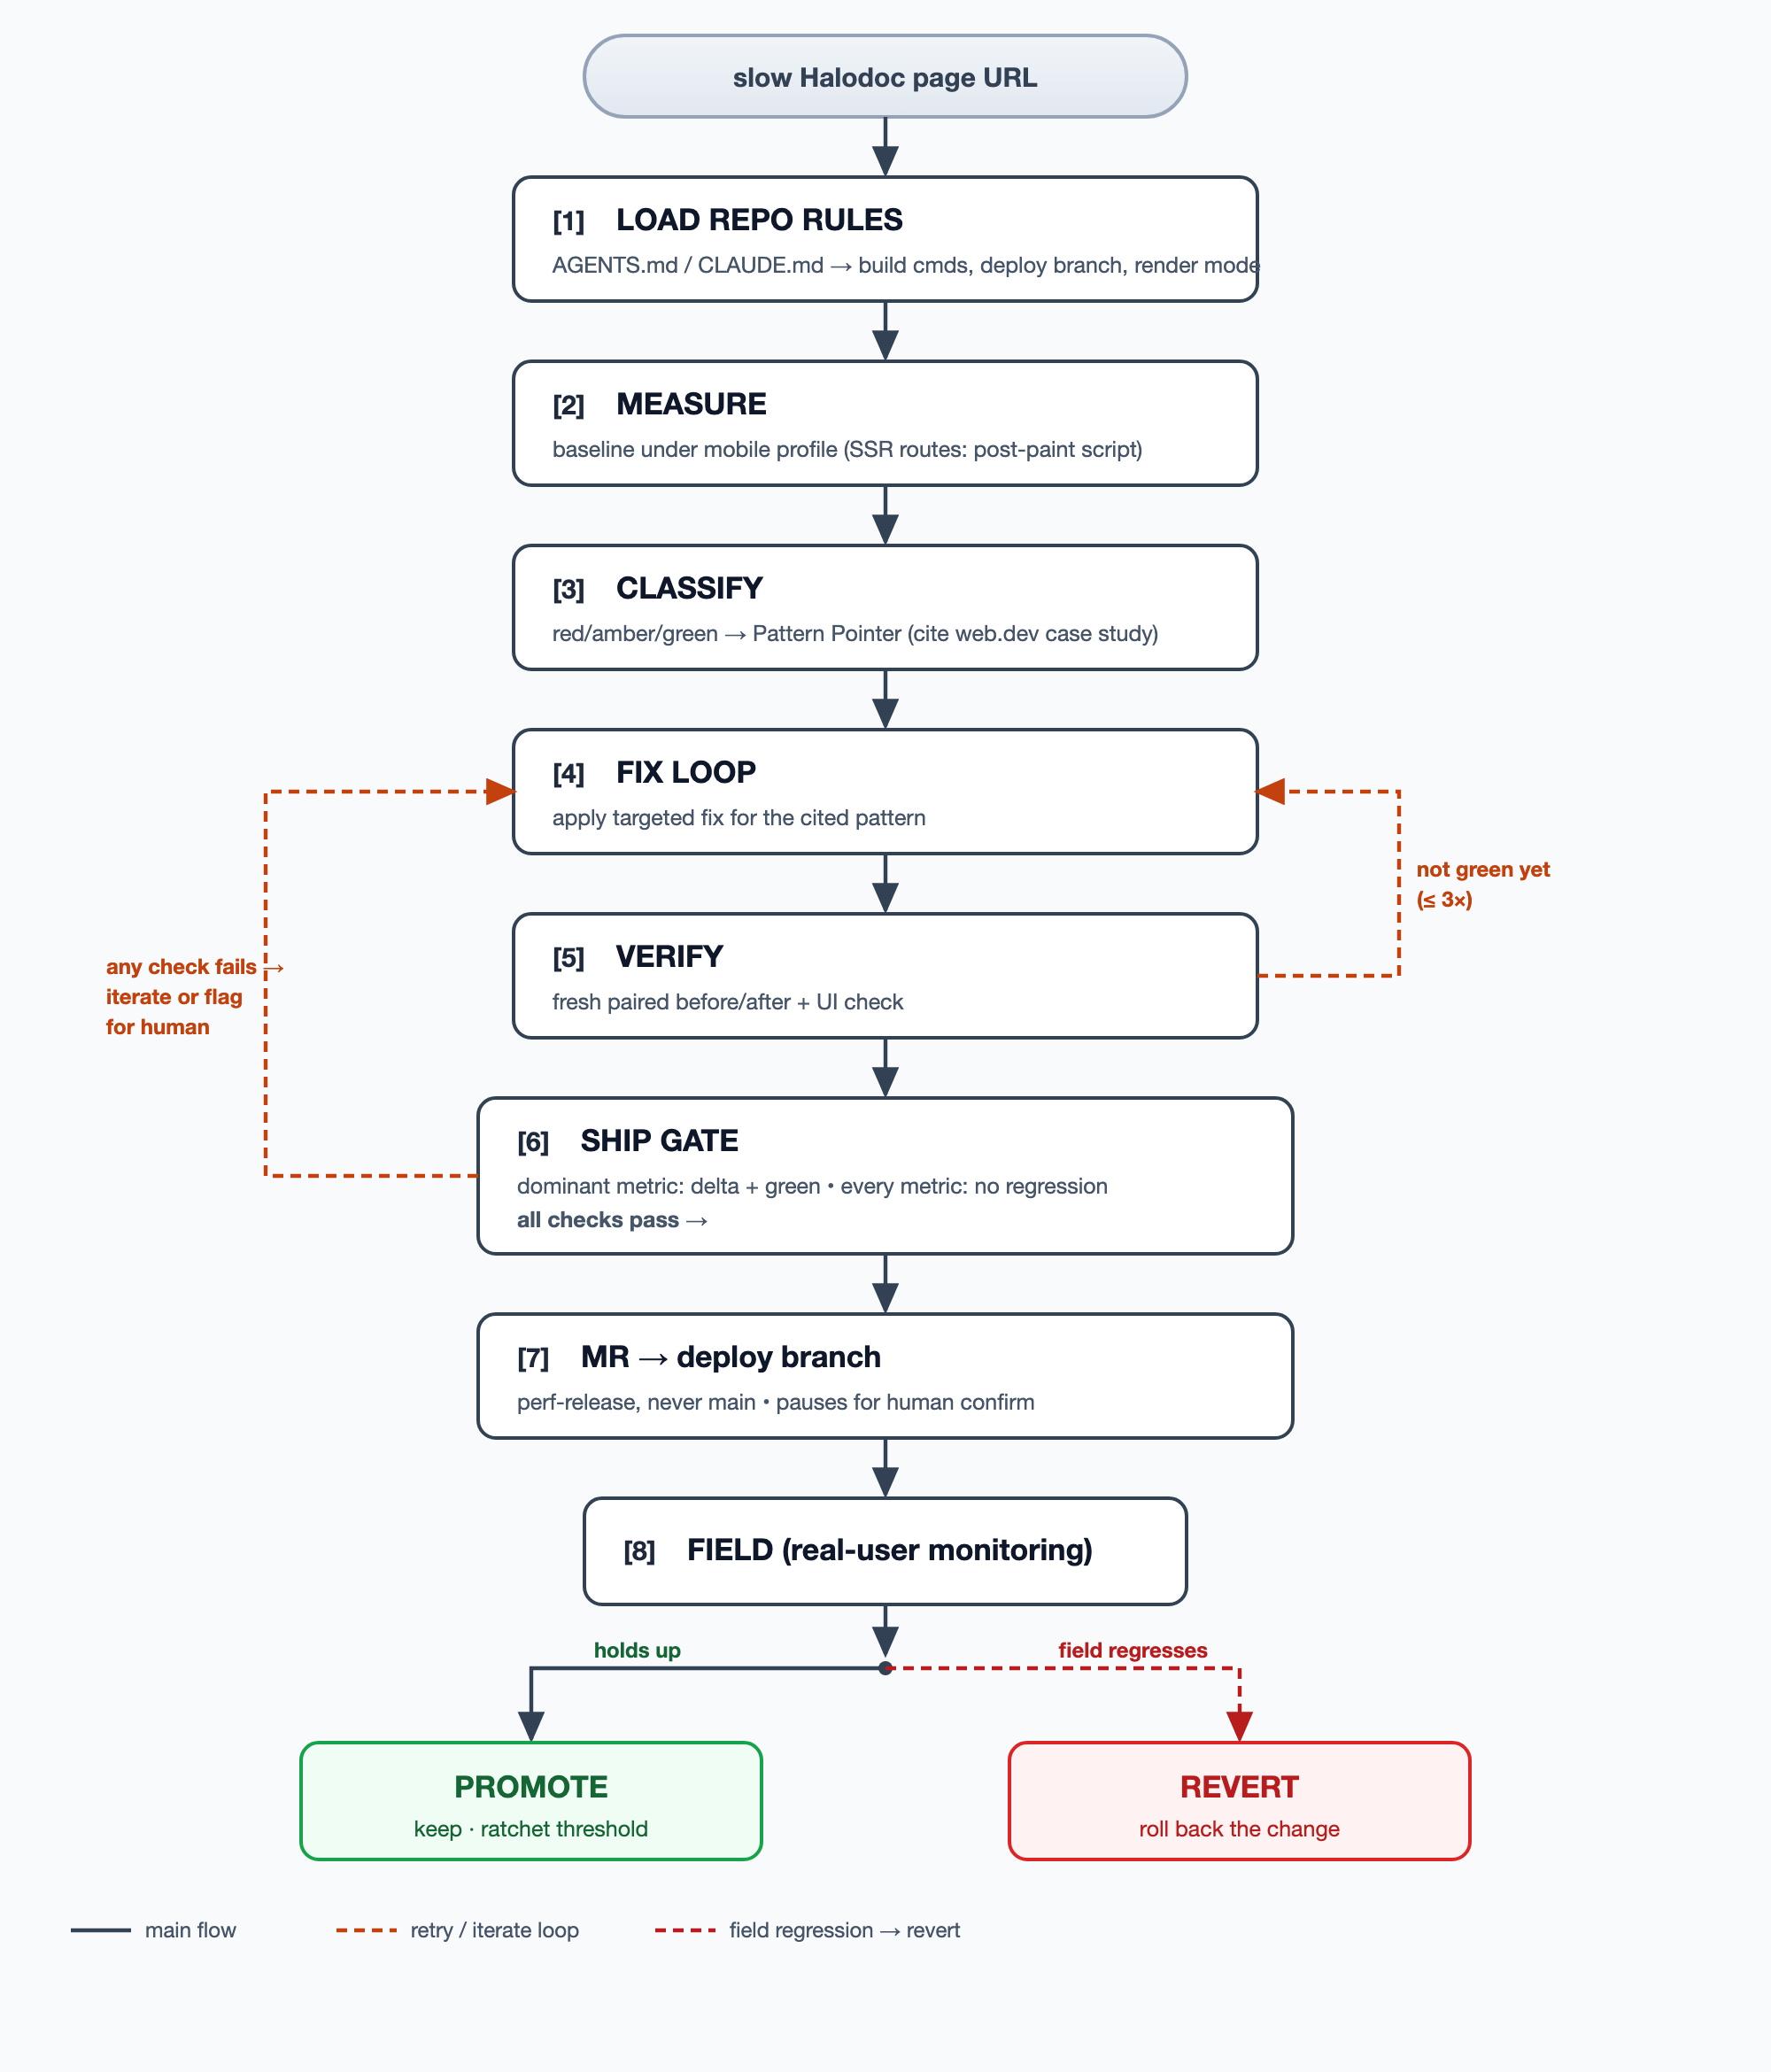
We built it as an LLM-driven workflow inside Claude Code, not a shell script or a bare CI job. It drives a headless Chrome through the Chrome DevTools MCP to capture traces, edits code, rebuilds, and re-measures — but we deliberately kept it from being autonomous: a human confirms before the one irreversible step of pushing a branch and opening an MR. Two mechanisms keep it from shipping hallucinated optimizations: every fix must cite a documented case-study pattern (the "Pattern Pointer") backed by quoted trace evidence, and nothing reaches an MR unless a paired before/after measurement lands the metric in the green zone (the ship gate).
About Core Web Vitals
Core Web Vitals are the handful of Web Vitals that apply to every page, because each maps to something a user actually feels: how fast the main content shows up, how quickly the page responds when they tap, and how much the layout jerks around while it loads. For the canonical definitions and thresholds, see web.dev/articles/vitals.
Three metrics make up the set today, each measuring one dimension of that experience and each scored against "good", "needs improvement", and "poor" bands:
- Largest Contentful Paint (LCP) — loading; "good" is ≤ 2.5 s.
- Interaction to Next Paint (INP) — interactivity; "good" is ≤ 200 ms.
- Cumulative Layout Shift (CLS) — visual stability; "good" is ≤ 0.1.
These are field metrics: they describe what real users experienced, aggregated in Google's Chrome User Experience Report (CrUX) and surfaced in tools like Google Search Console. In the lab we can only measure proxies that correlate with them — Lighthouse's Total Blocking Time (TBT) stands in for field INP, and Lighthouse's LCP and CLS approximate their CrUX counterparts. That gap is the whole reason our workflow treats a lab win as a hypothesis and the field number as the verdict.
Why "Build Passes" Is Not a Performance Signal
The failure mode we designed against is the most common one in the industry: an engineer applies a plausible optimization, npm run build goes green, the MR merges — and the metric doesn't move, or the page silently breaks.
A passing build proves the code compiles. Nothing else. It does not prove the LCP image stopped being lazy-loaded, that the layout stopped shifting, or that the deferred chat widget still opens. So the workflow refuses to treat compilation as evidence. Every fix must produce a paired before/after measurement and a UI/functional check on the actual rendered page before an MR is even opened.
The Architecture — Two Engines, One Parity Rule
Performance is only real if it is measured under a realistic profile: throttled CPU, throttled network, a mobile viewport. Our workflow can drive that measurement through either of two engines:
Chrome DevTools MCP (default) drives a real local Chrome, applying CPU + network throttling and a mobile viewport via CDP, then captures a full performance trace (LCP breakdown, layout-shift culprits, long tasks). Because throttling is applied to a real browser, it can also drive interactions — scroll to trigger lazy loaders, click the chat widget, wait for a deferred bundle — which matters enormously for measuring layout shift after first paint.
psi.sh is a bundled Lighthouse batch runner (mobile simulated throttling, desktop preset) that sweeps a list of routes and emits a compact per-route report. Self-contained, no browser automation. Used when the MCP isn't available.
The Parity Rule (load-bearing). The two engines throttle differently — one applies real throttling, the other simulates it — so their numbers are not comparable to each other. Whichever engine captures the baseline is "sticky" for the entire run. We never pair a before-run from one engine with an after-run from the other. A green-zone claim is only valid within a single engine's own paired runs. This one rule is what keeps every "we improved X" statement honest.
The Workflow — From Slow Page to Promoted Fix
Here is the arc a single page travels, using our own front-ends as the running example (our hybrid halodoc-website-frontend: dynamic SSR via the Website Pod for pages like doctor listings, plus prerendered static for marketing routes).
Step 1: Load the Repo's Own Rules First
Before touching anything, we read the repo's agent-guidance file (AGENTS.md / CLAUDE.md). Build commands, "do not modify" zones, and — critically — the deploy branch (default perf-release, never main) come from there. If the repo says something different from our defaults, the repo wins.
We also detect the rendering mode — Angular SSR/Universal, prerendered static, or hybrid — because that changes how we measure. Which brings us to one of the more subtle decisions in the whole system.
Step 2: Capture a Baseline
The engine captures a baseline under a mobile profile. On server-rendered routes there's a trap: much of the layout shift on a Halodoc SSR page doesn't happen at first paint — it happens after, when Angular hydrates and @defer blocks reveal below-the-fold content. A naive load-only measurement reports a beautiful CLS and misses the jump the user actually feels.
So on SSR and hybrid routes the workflow injects a post-paint interaction script — it scrolls and settles the page after paint so that hydration shifts and deferred reveals are counted in the session-window CLS. The same script runs for both the before and after measurement, because if it didn't, the CLS delta would be a lie.
Step 3: Classify, Then Cite a Real Case Study
Each metric is dropped into its red/amber/green zone. Red-zone metrics become fix candidates — but the workflow does not freelance solutions. It maps every red-zone finding to a documented pattern from web.dev/case-studies and records a five-field "Pattern Pointer" before writing a line of code:
Pattern: <case study + one-line pattern>
Source: <the canonical web.dev/case-studies URL>
Applies here because: <the trace evidence, with the number quoted>
Implementation: <the concrete, file-scoped change>
Gotcha to verify: <the specific foot-gun checked before shipping>
If all five fields can't be filled with real evidence, the pattern doesn't apply — the workflow picks another or flags the finding for a human. That rule is what makes the Pattern Pointer a gate rather than a template.
Step 4: Fix in a Loop Until Green (Max 3 Tries)
Fixes are grouped by page, mixing JS, image, CSS, and layout changes freely. The classic ones we apply across Halodoc front-ends:
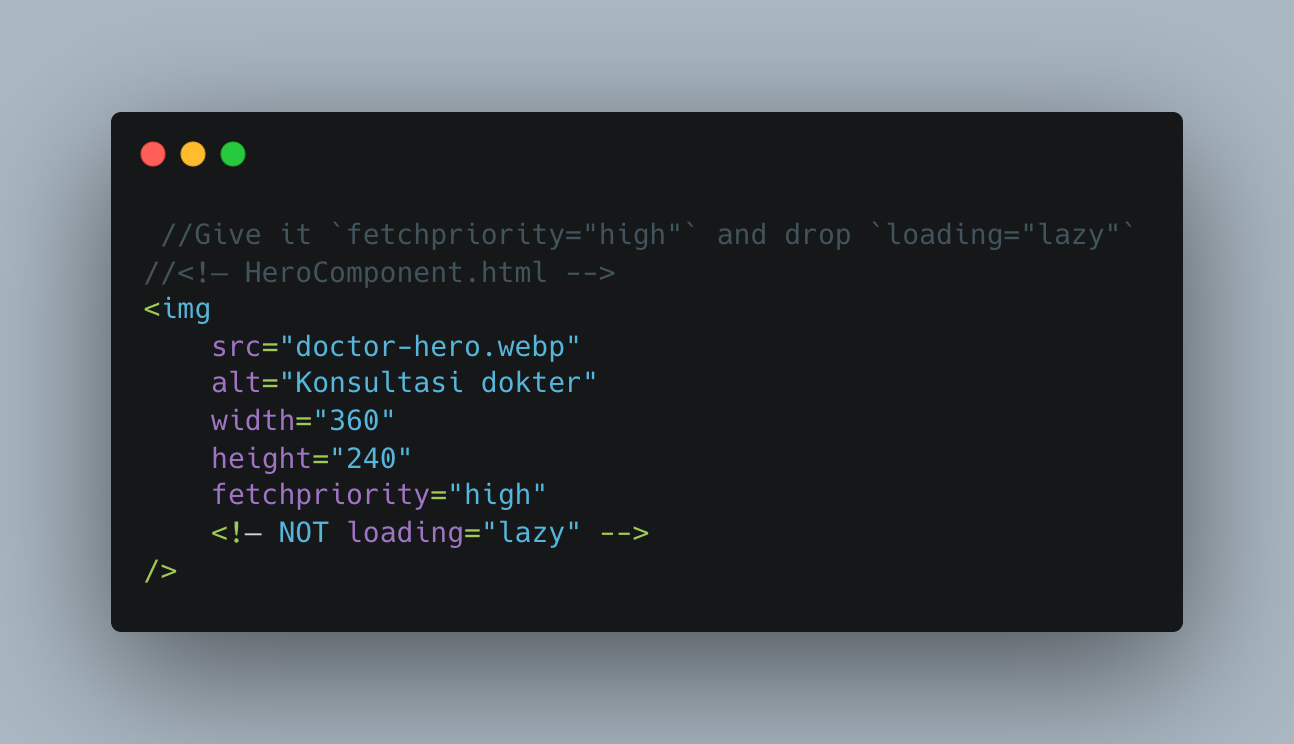
The LCP hero must never be lazy-loaded. Give it fetchpriority="high", keep its intrinsic width/height so the browser can reserve its box, and drop loading="lazy"
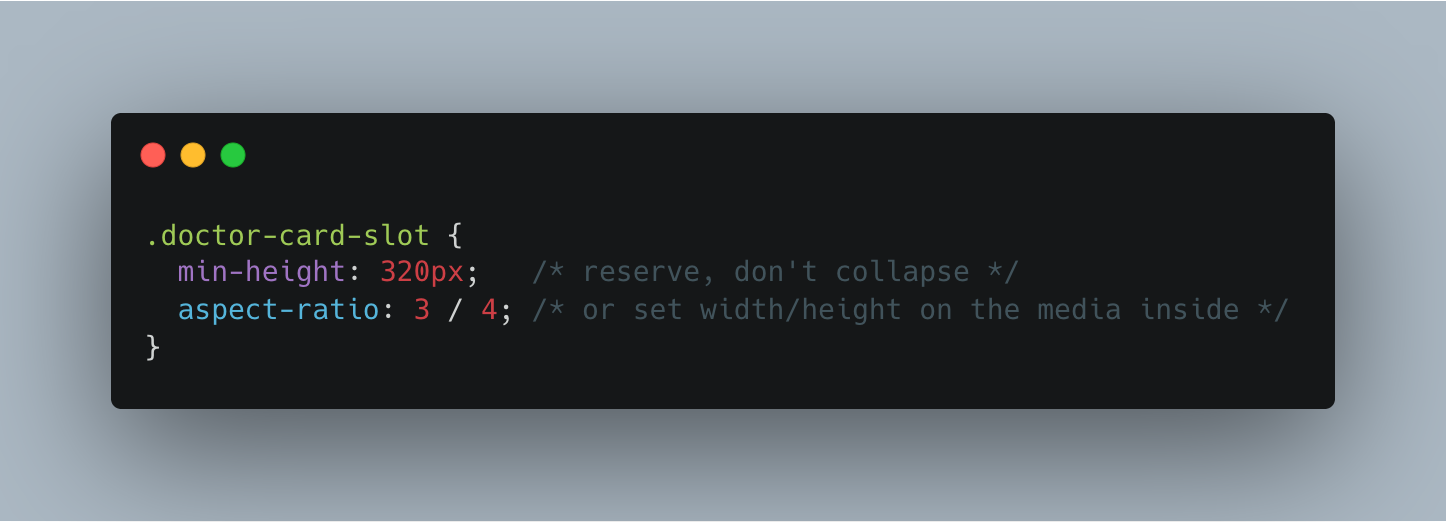
Reserve space to kill CLS. A lazy-loaded product/doctor card container needs an explicit min-height, not height: auto — otherwise it shifts the moment content arrives. Measure the rendered card height at the p75 mobile viewport (360–414 px wide) and reserve that value as the min-height. Pair it with aspect-ratio or explicit width/height attributes on the media inside the card, so images reserve their own space too:
Cut TBT by deferring the non-critical. The chat widget, video embeds, and analytics don't need to block the first interaction — defer them below the fold or behind on-viewport triggers so the main thread is free when the user first taps.
Crucially, this is a loop. After each fix the page is re-measured (Step 5). If the target metric isn't green yet, the workflow returns here and applies a stronger or additional fix — capped at 3 iterations per page. Three is our empirical ceiling for a single-MR perf fix; beyond that the remaining gap is usually structural (a third-party widget floor, or a framework migration), and the finding is flagged for a human rather than forced.
Step 5: Verify the Paired Delta and a Clean UI Check
This is the heart of the system. Using the same engine, same throttle, same viewport, same URL as the baseline, the workflow runs two parts:
Part A — a fresh paired measurement at verify time, so both runs share the same environment and can't drift apart. It stashes the fix and rebuilds, so the before binary contains none of the new code; measures that clean baseline; then restores (pops) the fix, rebuilds again, and measures the after. The per-metric delta is the difference between those two same-session runs — not a comparison against the older Step 2 baseline, which could have drifted.
Part B — a UI/functional check. It screenshots the rendered page, drives the deferred components it just changed (scroll, click the chat, wait for the bundle), and reads the browser console for new errors.
A metric win on a broken page is not a win. Both parts must pass.
Step 6: The Ship Gate — No Green, No MR
An MR opens only when the change clears all three checks below. The first two apply to the dominant metric — the one the page was flagged on; the third is a separate no-regression guard that applies to every metric measured. The zone boundaries follow Google's standard thresholds and are configurable per repo:
- Delta — the dominant metric's improvement clears the threshold (e.g. LCP down ≥ 10% or ≥ 0.5 s),
- Green zone — the dominant metric's after-value lands in the green zone,
- No-regression guard — no other measured metric regressed past its zone.
An LCP that moved 9.4 s → 4.8 s clears check 1 with room to spare, but 4.8 s is still red — the green threshold for LCP is ≤ 2.5 s — so it does not ship. There is deliberately no "merge now, polish later" path.
Step 7: Open the MR to the Deploy Branch
One branch per page (perf/<page-slug>-<date>), targeting the deploy branch (perf-release by default). The MR description carries the case-study citation, the gotcha pre-flight, the before/after numbers and traces, the screenshots, and a placeholder for the post-deploy verdict. Pushing is the one irreversible step — it always pauses for explicit human confirmation first.
Step 8: Deploy-Target Ground Truth — Pre vs Post
Local traces run against a dev server. Production runs behind a real CDN, WAF, service-worker cache, and the full third-party stack — any of which can erase a local win. So the workflow profiles the deploy target before the deploy and again after it goes live (same engine, same script), and only then decides:
Promote — post-deploy delta cleared and the metric is green in the field → the fix is real; promote through the normal release process.
Revert — the field numbers don't back the lab win → revert, and pair the failure with the case-study gotcha that explains it (an unexplained field regression usually means a hidden third-party or a CDN cache effect). Lab green is necessary. Field green is what actually ships.
The Result
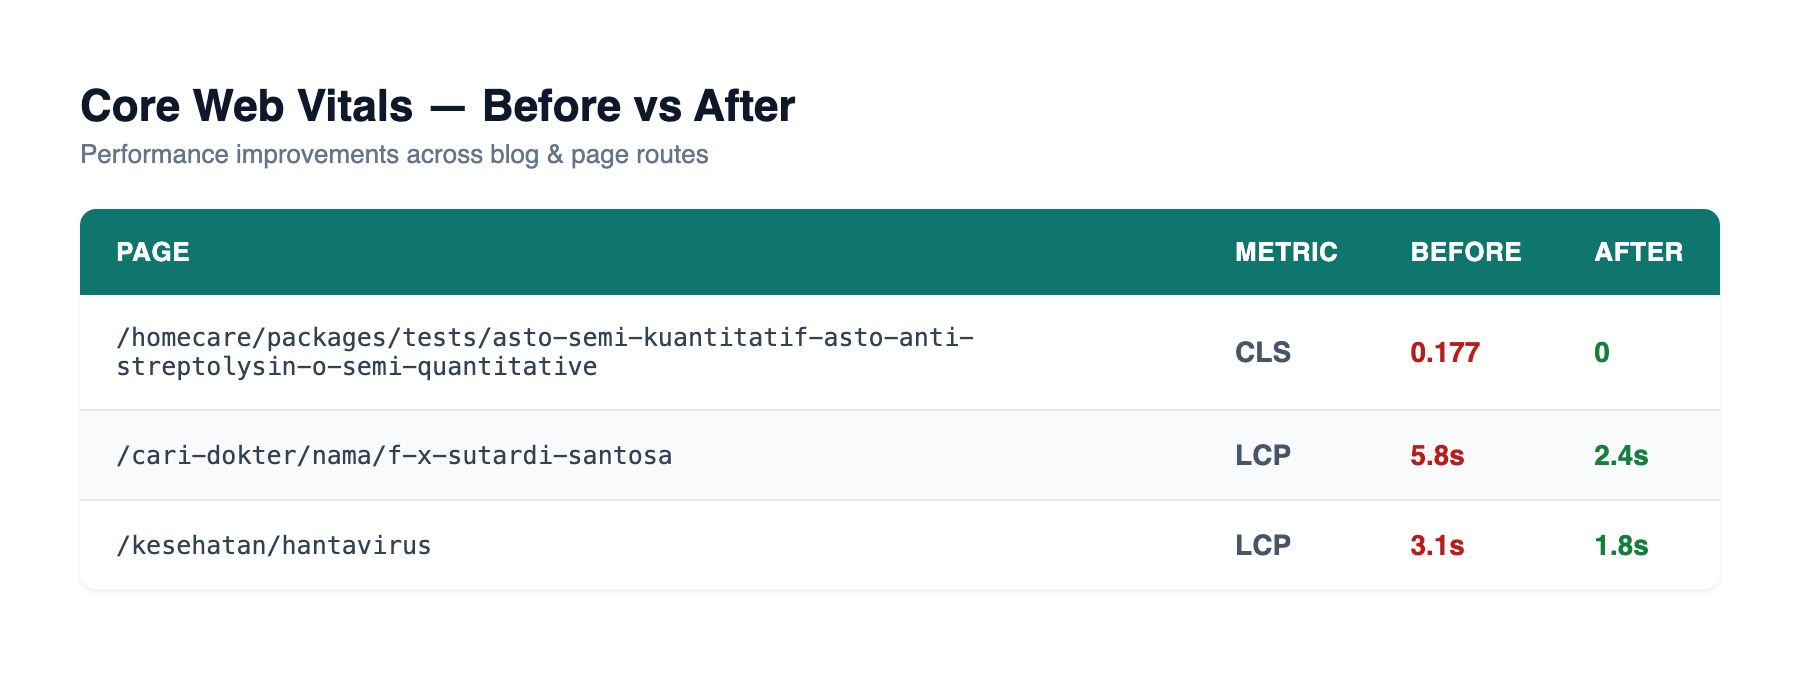
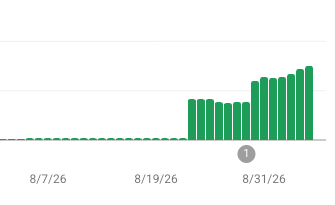
The direction of travel is encouraging, and we are deliberately careful about how we report it — the same discipline this post argues for. In Google Search Console, the number of indexed mobile URLs rated "Good" rose from 487 in August 2026 to roughly 18,680 as of September 2026. That number carries an important caveat: Search Console's "Good URL" count moves with indexing volume and reclassification, not performance alone, so part of that growth reflects more URLs being indexed rather than existing pages getting faster. We treat it as a coarse signal, not proof.
Each landed in the green zone — CLS ≤ 0.1 and LCP ≤ 2.5 s — which is exactly the bar our ship gate enforces before we ever open an MR.
Conclusion
Performance work fails quietly. A fix that "should" help but doesn't, a metric that improves in the lab but regresses in the field, a page that gets faster and subtly breaks — these slip through when the only gate is a green build. By making measurement paired, engine-consistent, SSR-aware, case-study-backed, and ultimately judged on the deploy target rather than the lab, we transformed CWV work at Halodoc from a hopeful one-off into a repeatable, auditable workflow. Every shipped fix comes with its before/after numbers, its evidence, and its field verdict attached.
For millions of users reaching for care on modest phones and imperfect networks, that discipline is the difference between a page that helps and a page that gets in the way.
References
- https://web.dev/articles/vitals
- https://web.dev/case-studies
- https://developer.chrome.com/docs/crux
- https://github.com/ChromeDevTools/chrome-devtools-mcp
- https://developer.chrome.com/docs/lighthouse/overview
Join us
Scalability, reliability, and maintainability are the three pillars that govern what we build at Halodoc Tech. We are actively looking for engineers at all levels, and if solving hard problems with challenging requirements is your forte, please reach out to us with your resume at careers.india@halodoc.com.
About Halodoc
Halodoc is the number one all-around healthcare application in Indonesia. Our mission is to simplify and deliver quality healthcare across Indonesia, from Sabang to Merauke.
Since 2016, Halodoc has been improving health literacy in Indonesia by providing user-friendly healthcare communication, education, and information (KIE). In parallel, our ecosystem has expanded to offer a range of services that facilitate convenient access to healthcare, starting with Homecare by Halodoc as a preventive care feature that allows users to conduct health tests privately and securely from the comfort of their homes; My Insurance, which will enable users to access the benefits of cashless outpatient services more seamlessly; Chat with Doctor, which allows users to consult with over 20,000 licensed physicians via chat, video or voice call; and Health Store features that allow users to purchase medicines, supplements and various health products from our network of over 4,900 trusted partner pharmacies. To deliver holistic health solutions in a fully digital way, Halodoc offers Digital Clinic services, including Haloskin, a trusted dermatology care platform guided by experienced dermatologists.
We are proud to be trusted by global and regional investors, including the Bill & Melinda Gates Foundation, Singtel, UOB Ventures, Allianz, GoJek, Astra, Temasek, and many more. With over USD 100 million raised to date, including our recent Series D, our team is committed to building the best personalized healthcare solutions, and we remain steadfast in our journey to simplify healthcare for all Indonesians.