
Upgrading Redshift from RA3 to RG and Achieving Faster Queries at 32% Lower Cost
Introduction
At Halodoc, data helps our teams make better decisions about the healthcare services we offer. Our Redshift data warehouse is where that data comes together, and our analytics teams use it every day to build dashboards and reports. When something changes underneath it, those dashboards and reports are the first place people notice.
In May 2026, AWS launched Amazon Redshift RG instances, a new generation built on Graviton processors with a redesigned query engine. On paper the move from RA3 is an "in-place upgrade". Same SQL dialect, same port, same endpoint after an Elastic Resize.
But "nothing changes" is a dangerous assumption when your warehouse sits behind hundreds of Airflow DAGs, Spark jobs, dashboards, data governance policies and exports to other tools. This post walks through what we tested before moving our main warehouse cluster to RG instances, what really changed under the hood and what did not.
What actually changes under the hood
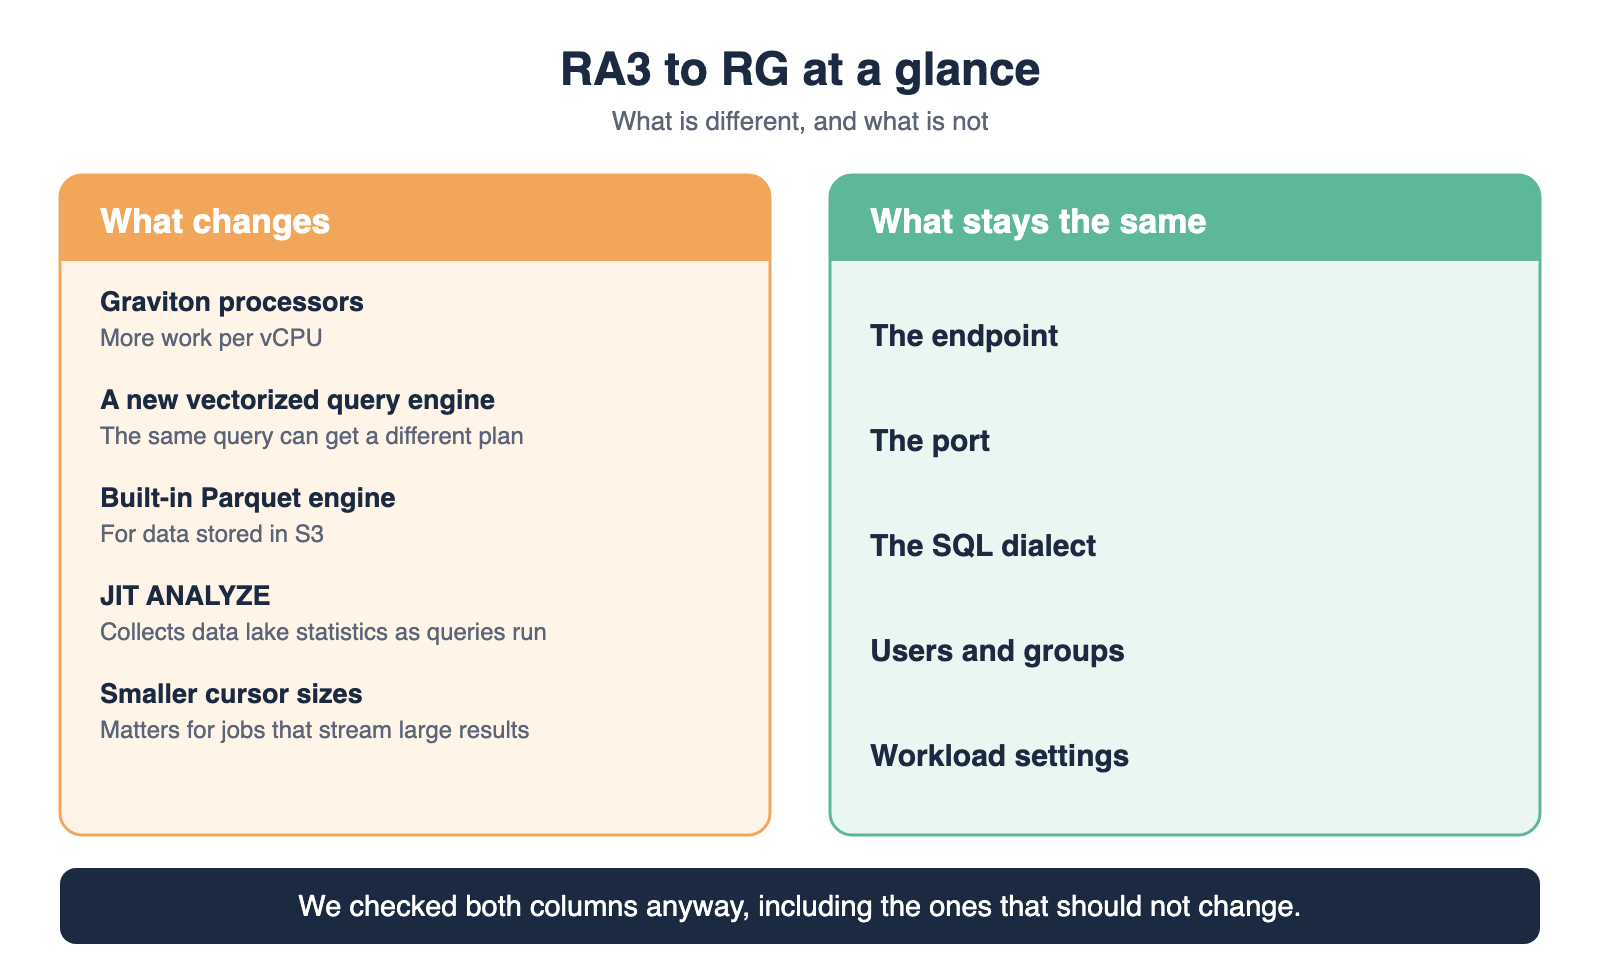
RG nodes run on AWS Graviton processors, which do more work per vCPU than the ones in RA3. AWS says this and the rest of the redesign add up to workloads that are up to 2.2x faster at about 30% lower price per vCPU. The query engine is new too. It runs queries in a vectorized way, which means the same query can get a different execution plan than before, and a plan that was fine on RA3 is not guaranteed to be fine on RG. RG also brings a built-in engine for reading Parquet files from S3, and JIT ANALYZE, which collects statistics for data lake tables automatically as queries run.
One smaller change is worth knowing about. AWS notes that RG nodes have smaller cursor sizes, which matters for any job that streams very large results.
Everything else stays the same. The endpoint, the port, the SQL dialect, our users, groups and workload settings all carry over from the snapshot. That last part is the one we were least willing to take on faith. "It should carry over" is easy to say, so we checked it anyway.
How we tested
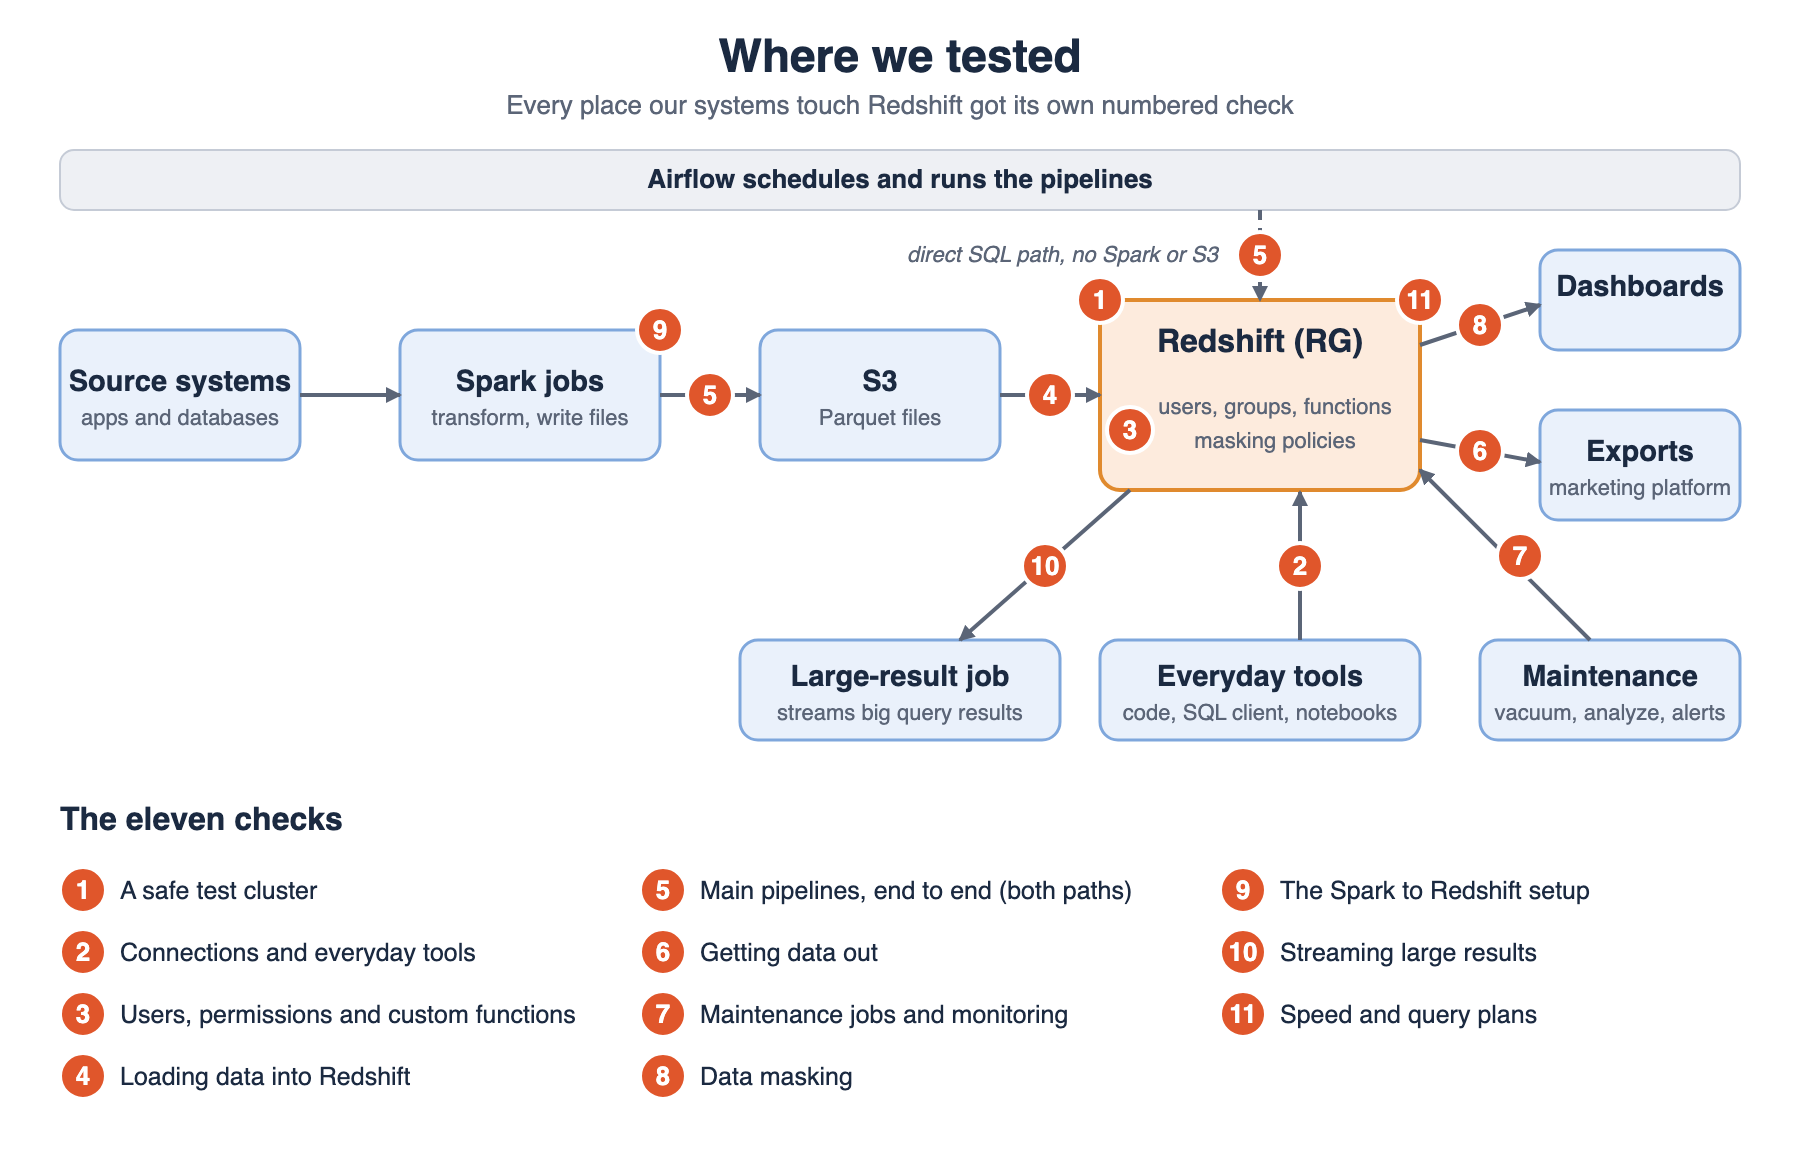
We built the test around one rule. Every place where our systems touch Redshift gets its own check, and the pass condition is written down before we run it. We ended up with eleven checks. They follow the path of the data, from connecting to the cluster to measuring how fast everything runs. Most of these checks are simple pass or fail tests, because the first question was whether anything would break. Check 11 is where we compared numbers between the two clusters.
1. A safe test cluster
The first risk was the test itself touching production. We restored the latest snapshot of our production cluster into a new RG cluster, after confirming the cluster version was recent enough for RG and that RG was available in our AWS region. Then we gave the test cluster its own connection and made copies of the pipelines we wanted to try, so the production pipelines never pointed at it. The check passed when production stayed untouched for the whole test.
2. Connections and everyday tools
A cluster is no use if people and tools cannot reach it. We connected from our Python code, from Airflow, from a desktop SQL client, from our dashboard tool and from notebooks running on our Spark cluster. We also ran a few basic functions that our code depends on. This passed when everything connected and returned what we expected.
3. Users, permissions and custom functions
A snapshot restore should bring users, groups, workload queues and custom functions along, and we compared each of them against production. For the custom functions that clean up data in our reporting tables, we did not stop at seeing that they exist. We called each one and checked the result. The check passed when everything matched production.
4. Loading data into Redshift
Most of our data arrives as Parquet files in S3 and is loaded with the COPY command. We loaded a test table and compared the row count with the source files. An exact match was the only passing result.
5. Our main pipelines, end to end
We write into Redshift in two different ways, and one check covers both paths. The first is the Spark path, where jobs write files to S3, load them into staging tables and then merge them into the final tables. The second is a direct SQL path used for some of our reporting tables, with no Spark and no S3 in between. For both, we ran real tables through the test cluster from start to finish. The checks passed when row counts were correct, business keys had no duplicates, and the hash we use to detect changed rows gave the same results as before.
6. Getting data out
We also send data out of Redshift, including to our marketing platform, which is strict about file format. We exported a test file and compared it with what production produces, looking for the same headers, delimiter and structure. Any difference would have broken the import on the other side, so the check passed only when the files were identical in structure.
7. Maintenance jobs and monitoring
Redshift needs regular housekeeping, such as vacuuming and updating statistics on the tables it stores itself, and we run alerts on top of its system views. One of them warns us when a query runs for too long. We checked that these views still exist with the same columns, and that vacuum and analyze run without errors.
8. Data masking
This was the check we took most seriously, because masking protects sensitive data. Checking that a masking policy exists is easy. We wanted to know that it works. So we compared the number of policies with production, removed and re-applied a policy on a non-critical column, and then queried the masked tables as a regular user, not as an administrator. The check passed only when we saw masked values on screen. A policy sitting in a list proves very little.
9. The Spark to Redshift setup
We confirmed that credential lookup for the new cluster still worked, and that queries on external tables stored in S3 still ran. It passed when a full Spark job completed with correct row counts.
10. Streaming large results
One of our jobs reads large query results in chunks, using a server-side cursor, and copies them into a Postgres database. AWS notes smaller cursor sizes on RG, which is exactly where a job like this could break. We did not replay this one on the test cluster, so we watched it closely in production right after the switch. It runs every hour, and the runs we checked all completed, streaming in chunks of 1,000 rows with the row count matching on both sides. If it had failed, the fallback was smaller chunks or a bigger node.
11. Speed and query plans
Finally, we ran the same loads, merges, exports and maintenance jobs on both clusters and compared the time. Our rule was simple. Anything more than 10% slower on RG gets flagged. Because the engine is new, we also picked our heaviest reporting queries and compared their execution plans side by side, looking at the join order and at how data moves between nodes.
Nothing was slower on RG. We ran each test on both clusters under the same conditions, after 8 PM when production is quiet, so neither cluster was competing with other work. Loading about 6 million rows with COPY dropped from 145 seconds to 24, roughly six times faster. Exporting a similar volume as Parquet went from 366 seconds to 301, a smaller gain of about 18%. Building five of our heaviest reporting tables ran between 2.1 and 5.2 times faster.
The plans explained a lot of it. On RA3, external tables stored in S3 went through a separate scanning layer, while RG reads them directly on its compute nodes. RA3 also broadcast a table of about 10 million rows into four subqueries, where RG distributed only the data it needed based on the join key. And RA3 was planning with out-of-date statistics, so it misjudged row counts on several tables.
The switch
Because the endpoint stays the same, our applications did not need to change. We used an elastic resize during a planned window, which takes about ten to fifteen minutes of downtime.
What we saw afterwards
We measured the same workload before and after the cluster change. It is the regular morning load of scheduled pipelines and dashboard queries, which runs on the same schedule. We looked at the morning window from 7 AM to 1 PM, when the warehouse is busiest. A typical morning in that window carries about 11,000 queries, around 8,500 from dashboards and 2,300 from pipelines.
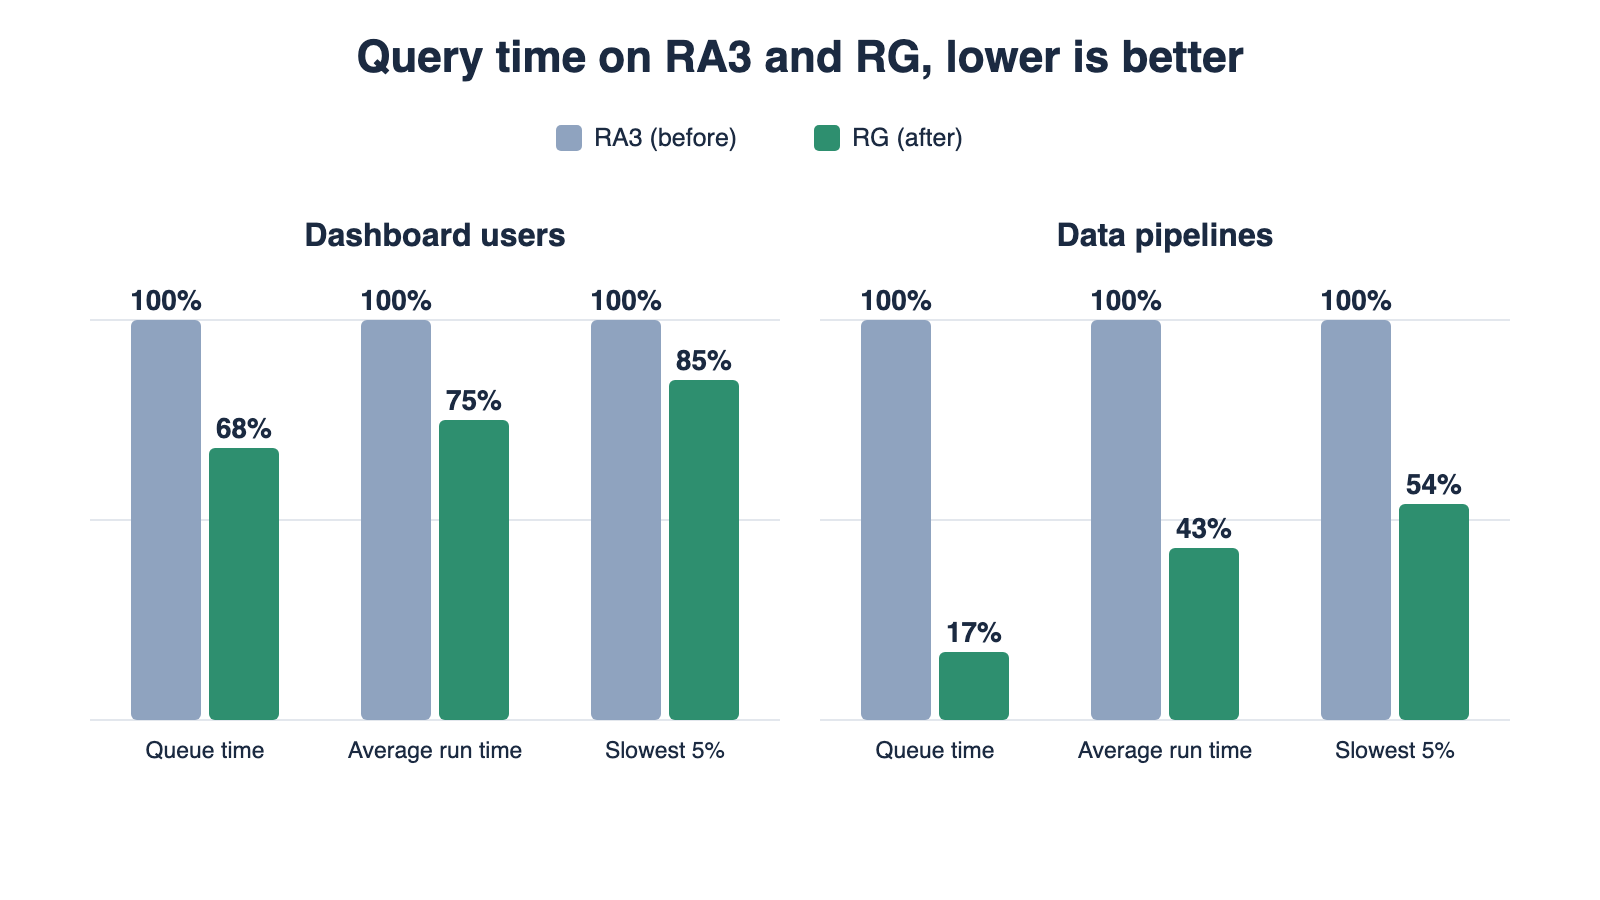
The chart compares RA3 and RG on the same morning load. Each bar is the time as a percentage of what it was on RA3, so a shorter bar is better.
- Queue time is how long a query waits for its turn before it starts. It dropped by about 32% for dashboards and 83% for pipelines.
- Average run time is how long a typical query takes once it starts. It dropped by about 25% for dashboards and 57% for pipelines.
- Slowest 5% (also called p95) is the time that only the slowest 5% of queries exceed. A good average can hide a few very slow queries, and those are the ones people notice. It dropped by about 15% for dashboards and 46% for pipelines.
The table below shows how average run time changed on RG, hour by hour, compared with RA3.
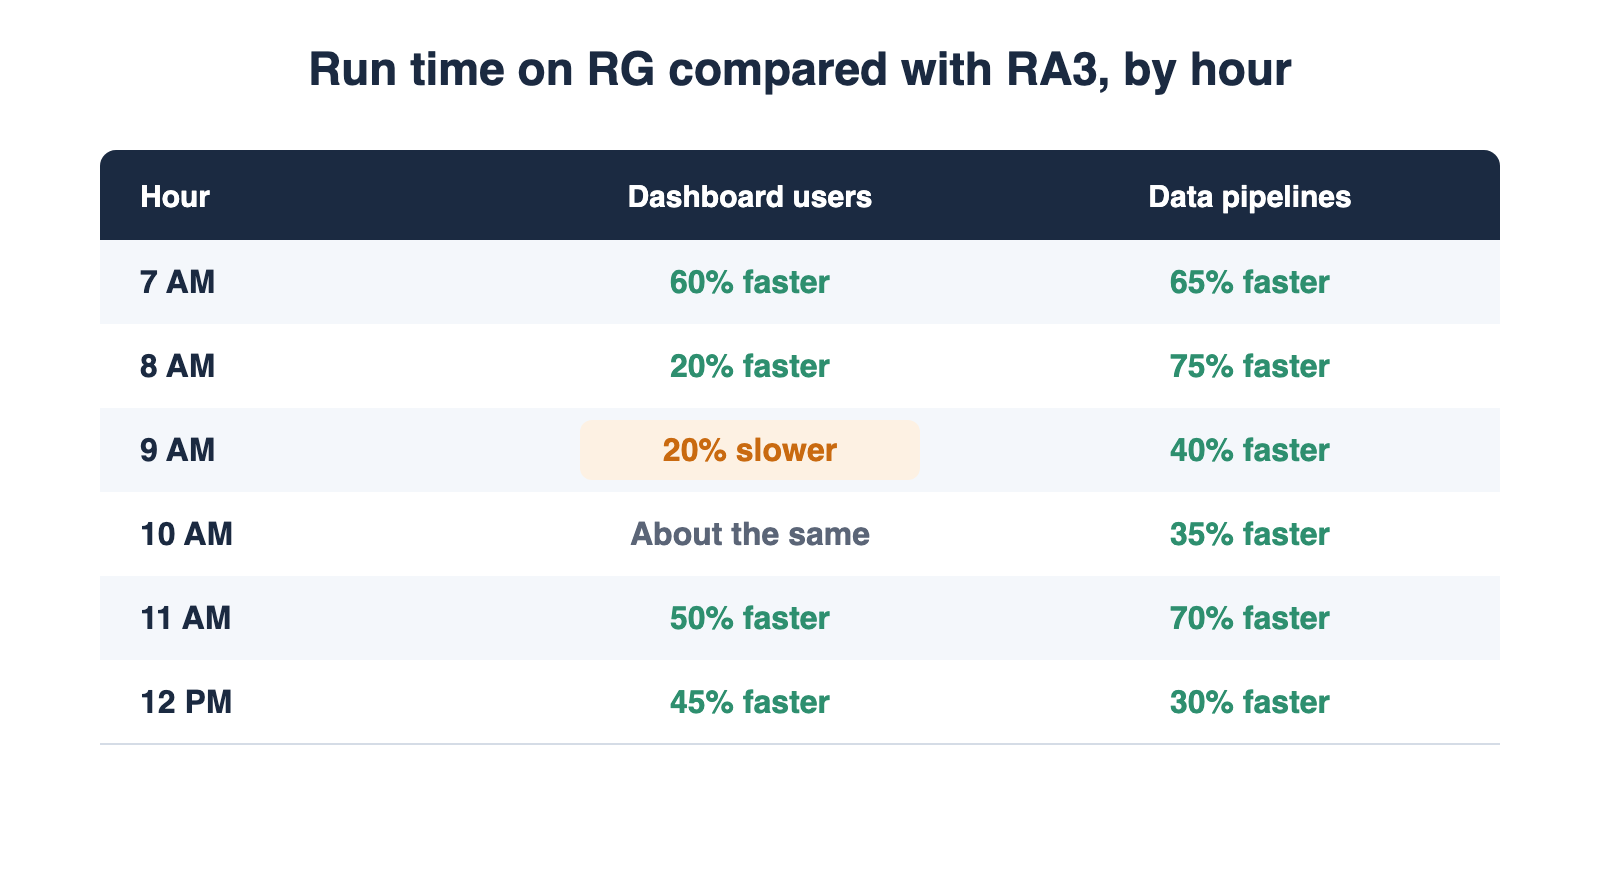
Our data pipelines gained the most. Queries almost stopped waiting in line, and they ran faster throughout the morning. Dashboard queries improved overall, but not in every hour. Most hours were faster, one was about the same and one was slower than before, and we are keeping an eye on them.
The result that surprised us most was about concurrency scaling, the feature that adds extra capacity when the main cluster is busy. Only dashboard queries used it. After the switch, the extra capacity we used dropped by about 45%, because the main cluster could now handle the load itself. So we lowered the maximum number of extra clusters from two to one.
The weekly numbers have held since the switch. They cover all hours, not only the morning window, and show the same direction. Average queue time is down about 70% and average run time about 35%.
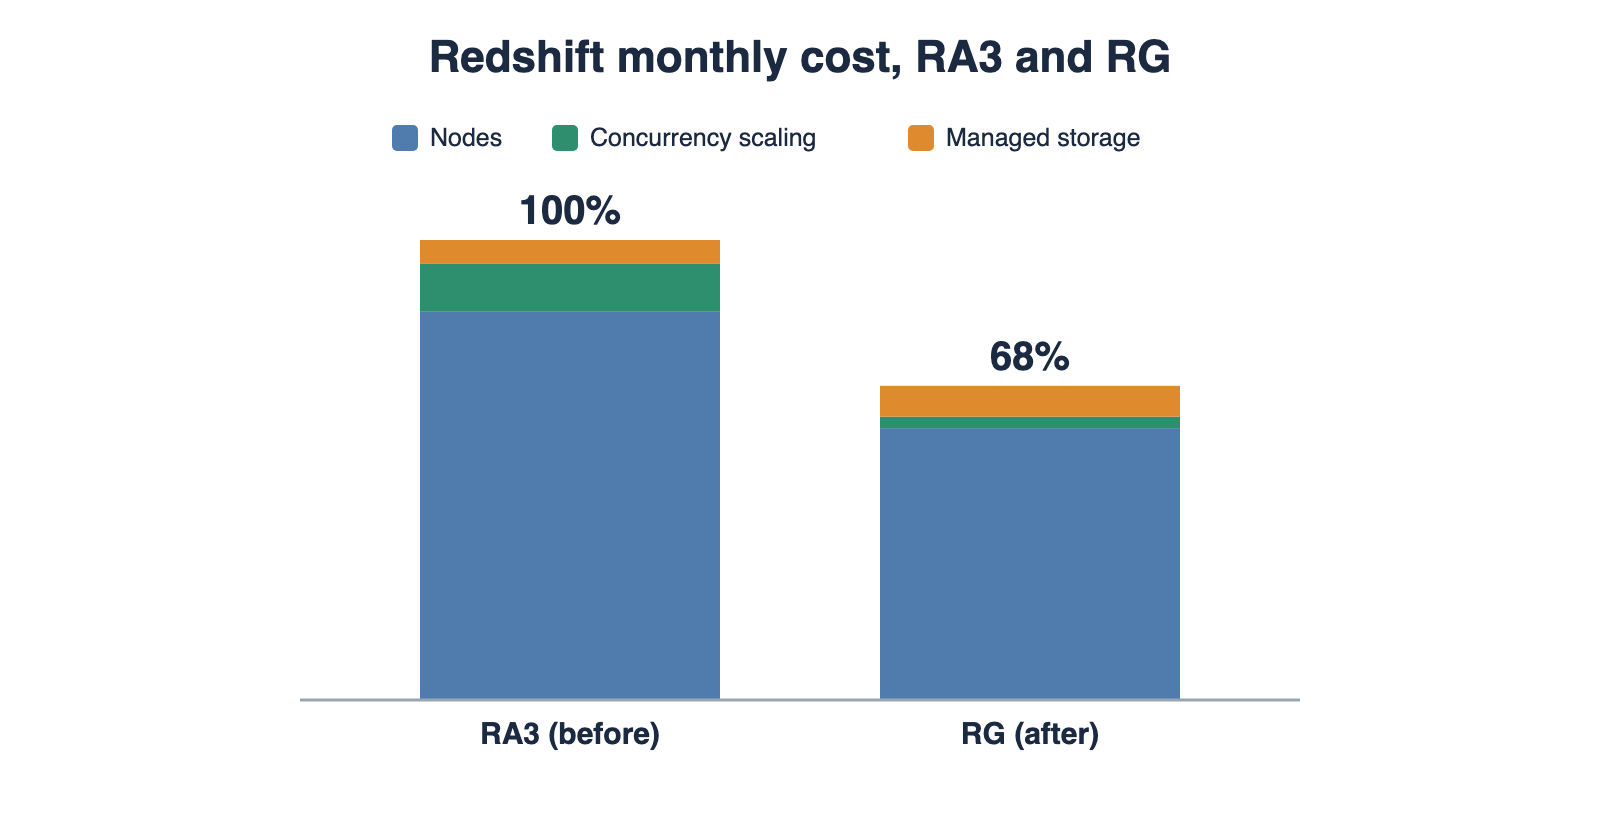
The move also lowered our costs. Cluster cost fell 30%, in line with AWS's price-per-vCPU claim, and concurrency-scaling spend fell 76%, because the cluster now handles most peaks itself and the free daily credits cover more of what is left. Together, our Redshift compute cost is about 35% lower than before, and the total bill, including storage, is about 32% lower.
What we learned
Test the paths your pipelines really use. Our main loading path and our direct SQL path are different code, and a test of one says nothing about the other.
Check that things work, and not only that they exist. Masking policies and custom functions carried over from the snapshot, but we only trusted them after using them.
A faster cluster changes how you should set up concurrency scaling. Look at how long the queries that spill over actually take, and not only at how often it is used.
What is next
RG’s integrated engine reads data lake formats such as Parquet and Hudi directly on the cluster’s compute nodes. We are now exploring bringing part of our data lake and ETL workloads into the Redshift cluster itself, and will test how they behave before rolling anything out.
References
- Amazon Redshift RG instances: features
- Meet Amazon Redshift RG: Graviton-based instances with an integrated data lake query engine (AWS Big Data Blog)
- DECLARE: cursor constraints by node type (Amazon Redshift docs)
- Resizing a cluster: elastic resize (Amazon Redshift docs)
Join us
Scalability, reliability, and maintainability are the three pillars that govern what we build at Halodoc Tech. We are actively looking for engineers at all levels, and if solving hard problems with challenging requirements is your forte, please reach out to us with your resume at careers.india@halodoc.com.
About Halodoc
Halodoc is the number one all-around healthcare application in Indonesia. Our mission is to simplify and deliver quality healthcare across Indonesia, from Sabang to Merauke.
Since 2016, Halodoc has been improving health literacy in Indonesia by providing user-friendly healthcare communication, education, and information (KIE). In parallel, our ecosystem has expanded to offer a range of services that facilitate convenient access to healthcare, starting with Homecare by Halodoc as a preventive care feature that allows users to conduct health tests privately and securely from the comfort of their homes; My Insurance, which allows users to access the benefits of cashless outpatient services in a more seamless way; Chat with Doctor, which allows users to consult with over 20,000 licensed physicians via chat, video or voice call; and Health Store features that allow users to purchase medicines, supplements and various health products from our network of over 4,900 trusted partner pharmacies. To deliver holistic health solutions in a fully digital way, Halodoc offers Digital Clinic services including Haloskin, a trusted dermatology care platform guided by experienced dermatologists.
We are proud to be trusted by global and regional investors, including the Bill & Melinda Gates Foundation, Singtel, UOB Ventures, Allianz, GoJek, Astra, Temasek, and many more. With over USD 100 million raised to date, including our recent Series D, our team is committed to building the best personalized healthcare solutions and we remain steadfast in our journey to simplify healthcare for all Indonesians.