
Structured Capacity Planning and Automation to Optimise Java Services
At Halodoc, ensuring seamless access to healthcare services demands a highly reliable and scalable infrastructure. With millions of users depending on our platform for tele-consultations, medicine deliveries and diagnostics, capacity planning becomes critical to maintaining consistent performance and uptime. Given that most of our services are Java-based applications, optimising JVM memory, CPU utilisation and Kubernetes resource allocation is essential for efficiency.
Without proper capacity planning, sudden traffic spikes triggered by health crises or seasonal surges can strain resources, leading to latency issues, degraded user experience, or even downtime. Conversely, over-provisioning results in inflated cloud costs with underutilised resources. To address this, we leverage capacity planning, analysing historic JVM performance, Kubernetes scaling trends and real-time workloads to fine-tune resource allocation dynamically.
This blog explores best practices for capacity planning and how automation empowers us to optimise Java services, ensuring uninterrupted healthcare access while balancing performance and cost-effectiveness.
Unlocking Efficiency: The True Goal of Capacity Planning
- Ensure accurate CPU and memory provisioning for Java services running in Kubernetes.
- Prevent over-provisioning and under-provisioning by analysing historical usage and adjusting JVM parameters, Kubernetes requests/limits and pod scaling accordingly.
- Provide a scalable resource allocation framework that dynamically adapts to workload changes and business growth.
- Enhance system reliability and user satisfaction by optimising resource utilisation, preventing performance bottlenecks and maintaining SLO.
Key Resource Sizing Guidelines
Effective capacity planning for Java-based services running on Kubernetes requires analysing multiple factors. It is crucial to evaluate resource allocation at both the application and infrastructure levels.
Below are the best practices for effectively managing memory, CPU and pod scaling to ensure that Java services remain stable, responsive and cost-efficient.
Memory Sizing
Memory sizing is a critical aspect of ensuring stable, performant and cost-effective Java applications in a Kubernetes environment. Proper memory allocation prevents unexpected crashes, out-of-memory (OOM) errors and inefficient resource utilisation. We have two levels of limiting maximum memory usage: JVM and Container.
JVM Memory Components
JVM memory consists of multiple components:
- Heap Memory: Allocated for application objects.
- Metaspace: Stores class metadata.
- Code Cache: Stores compiled bytecode.
- Compressed Class Space: Used for storing class pointers.
- Thread Stacks: Memory allocated per thread.
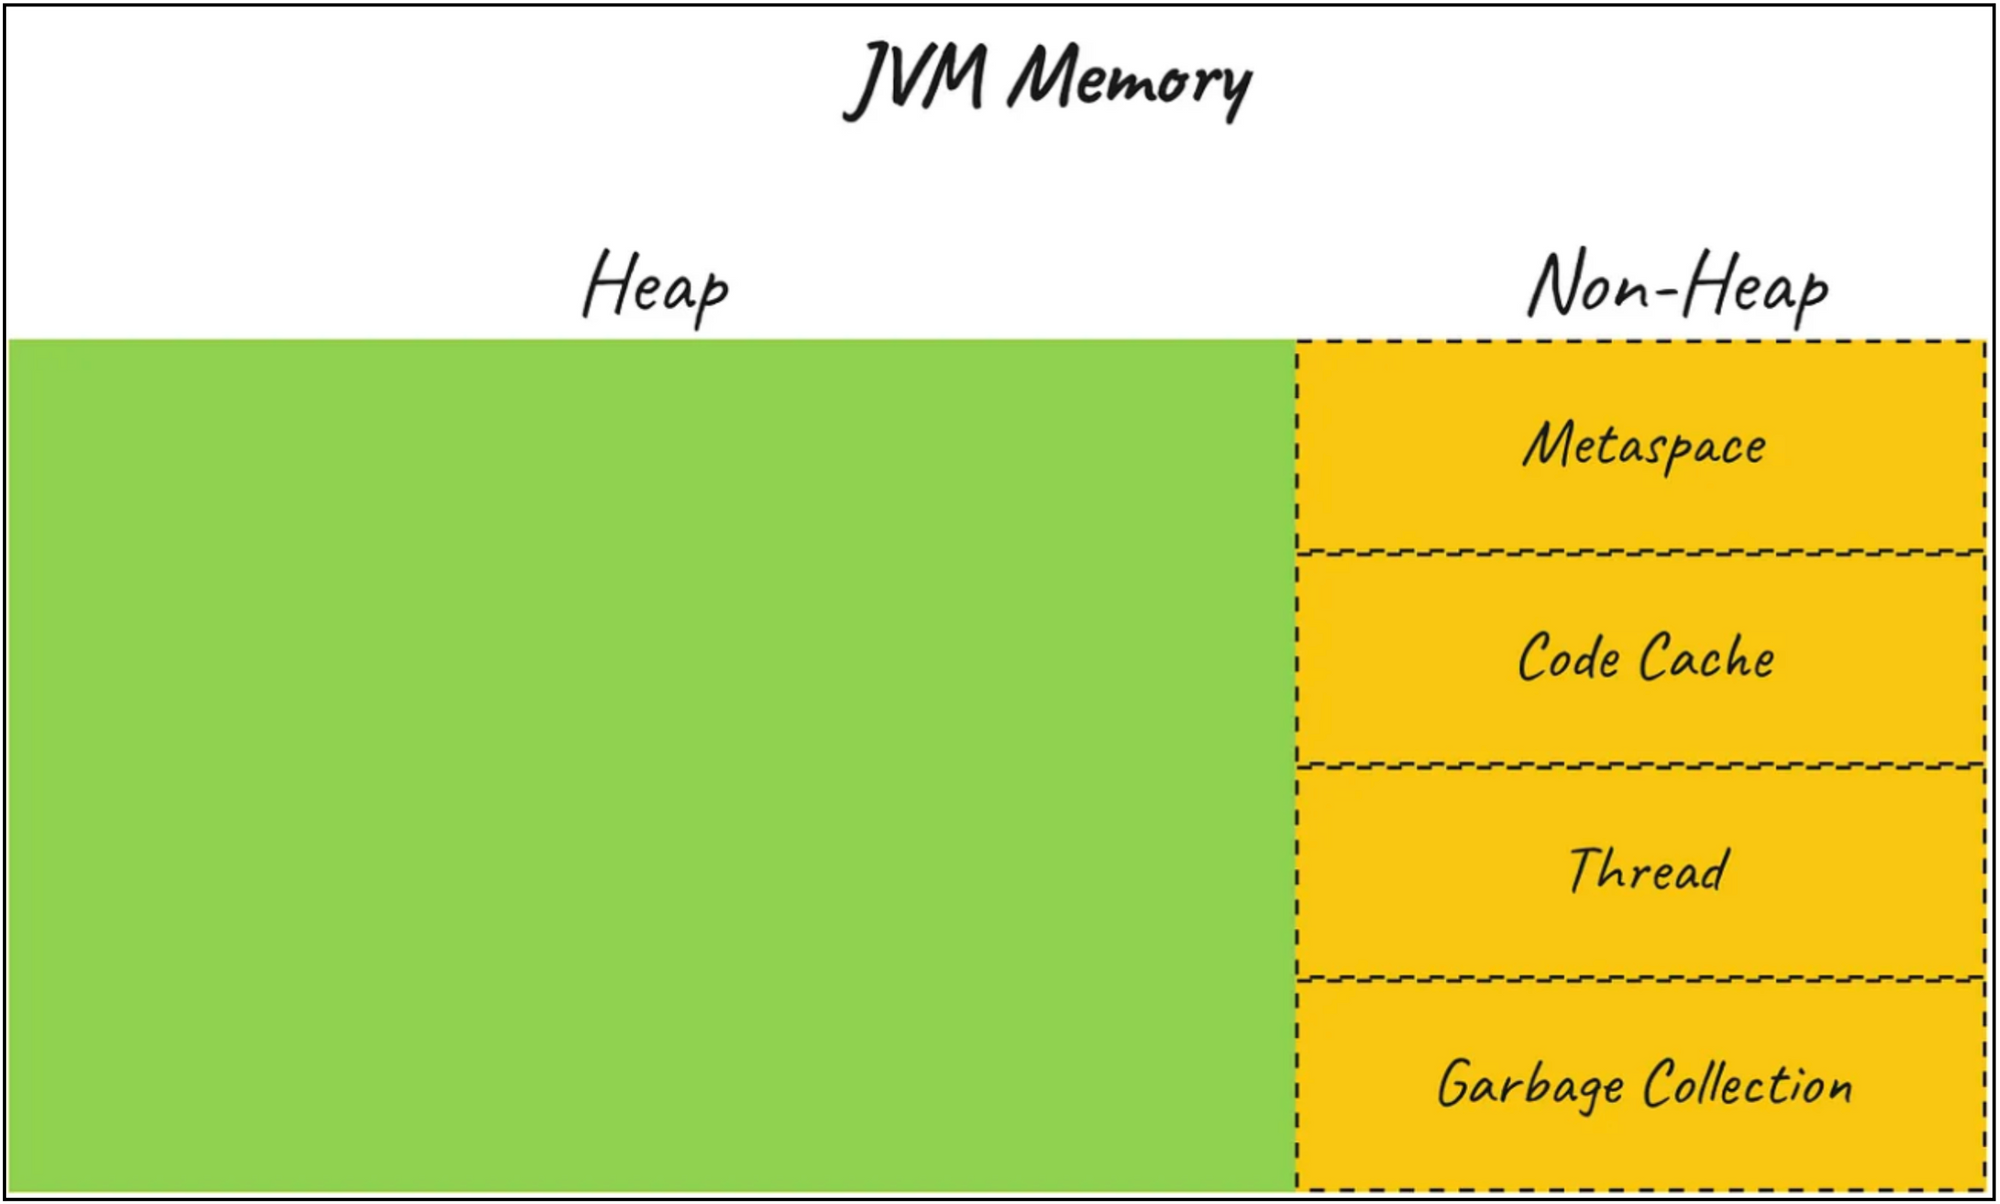
Heap is not a single memory consumer in JVM.
JVM Memory = Heap + NonHeap.
While limiting Heap size using a single parameter like -Xmx we can not do the same thing for non-heap.
Calculating Total JVM Memory Usage
To efficiently allocate memory for a Java application in Kubernetes, we follow structured calculations based on JVM parameters and best practices. Given that ZGC (Z Garbage Collector) is in use at Halodoc, certain considerations apply to optimise memory utilisation.
JVM Memory Formula
JVM Memory = Heap (-Xmx) + MaxMetaspace (-XX:MaxMetaspaceSize) + Code Cache (-XX:ReservedCodeCache) + Buffer.
where Non-Heap = MaxMetaspace + Code Cache
Memory Allocation Guidelines
- Heap (
-Xmx): Typically set to 25% of available RAM if not explicitly configured. - Initial Heap (
-Xms): Recommended Xms = 0.25 × Xmx for efficient startup. - Metaspace (
-XX:MaxMetaspaceSize)
○128MBif Xmx < 1.5GB
○256MBif Xmx < 4GB
○512MBotherwise - MaxMetaspaceSize (
-XX:MaxMetaspaceSize): 2 * Metaspace - Thread Stack Size (
-Xss): Defaults to 1MB per thread.
NOTE: It is recommended to analyze historical usage for existing applications (using tools like Newrelic or Prometheus) or perform load testing for new applications to determine accurate values for Xmx
After enabling ZGC garbage collector, we were getting Out Of Memory (OOM) error for few of the microservices due to committed heap reaching max heap especially in high-memory-intensive applications. We optimised ZGC by enabling ZGenerational, which categorises objects into young and old generations, reducing GC pause times for real-time healthcare applications. Additionally, we implemented SoftMaxHeapSize, a soft memory limit that proactively triggers GC before reaching -Xmx, preventing OOM errors and improving stability. These enhancements ensure efficient memory utilisation while maintaining low-latency performance.
Kubernetes Memory Requests and Limits Calculation
To determine requests, we use the formula:
Requests = Xmx + MaxMetaspaceSize + 150MB(thread overhead) + 12% of Xmx(direct memory) + 10% of Xmx(safety buffer).
To set limits, we apply:
Limits= 1.15 × Requests
Key Considerations for Kubernetes
- Pods consuming more than their declared requests risk eviction. Setting very low request values can lead to instability.
- Memory limits act as hard boundaries—exceeding them results in forced termination rather than throttling.
- Kubernetes enforces a rule where limits cannot be lower than requests. If this condition is not met, Kubernetes will throw an error and prevent the container from running.
CPU sizing
To estimate the required number of CPU cores, it's essential to understand the nature of the application, which generally falls into one of two categories: compute-intensive or I/O-intensive. Setting CPU limits too low can lead to unexpected throttling, which often impacts latency, particularly tail latency. However, throttling itself isn't necessarily an issue—it should only be avoided when it negatively affects application behaviour, such as causing spikes in tail latency. Here are few recommendations:
- Understand the Application’s Threading Model
Applications utilise various types of threads, including garbage collection threads, ForkJoinPool threads, database connection pool threads and HTTP handler threads. To optimise performance in a containerised environment, configure thread pool sizes based on detailed performance testing and workload analysis. The goal is to balance concurrency needs with available CPU resources. - Explicitly Set Thread Counts for Critical Thread Pools
Define the number of threads explicitly for important Java library pools to ensure optimal resource utilisation. - Measure CPU Usage and Set Requests Accordingly
Conduct performance testing to determine CPU consumption under peak load and set CPU requests to handle production traffic effectively. A good practice is to ensure that peak CPU usage remains within 70–80% of the requested CPU allocation. Over-provisioning is unnecessary, as CPU limits handle occasional spikes. - Set CPU Limits Relative to Requests
○ For latency-sensitive applications (e.g., handling client requests): Set CPU limits 20–30% higher than requests to accommodate short-lived spikes. Since Grafana dashboards may lack fine-grained granularity, monitoring CPU throttling metrics can help minimise unexpected slowdowns.
○ For background applications (e.g., cron jobs, asynchronous event processing): Set CPU limits approximately 10% higher than requests. The combination of requests and limits should allow the application to manage peak-time traffic while maintaining some buffer for additional load.
CPU Throttling and Right-Sizing Requests & Limits
To determine the optimal resource requests and limits, start by gathering key data:
- Current requests
- Current limits
- Historical resource usage trends
Common Scenarios
- Usage is lower than requests and limits: This leads to over-provisioning and resource wastage.
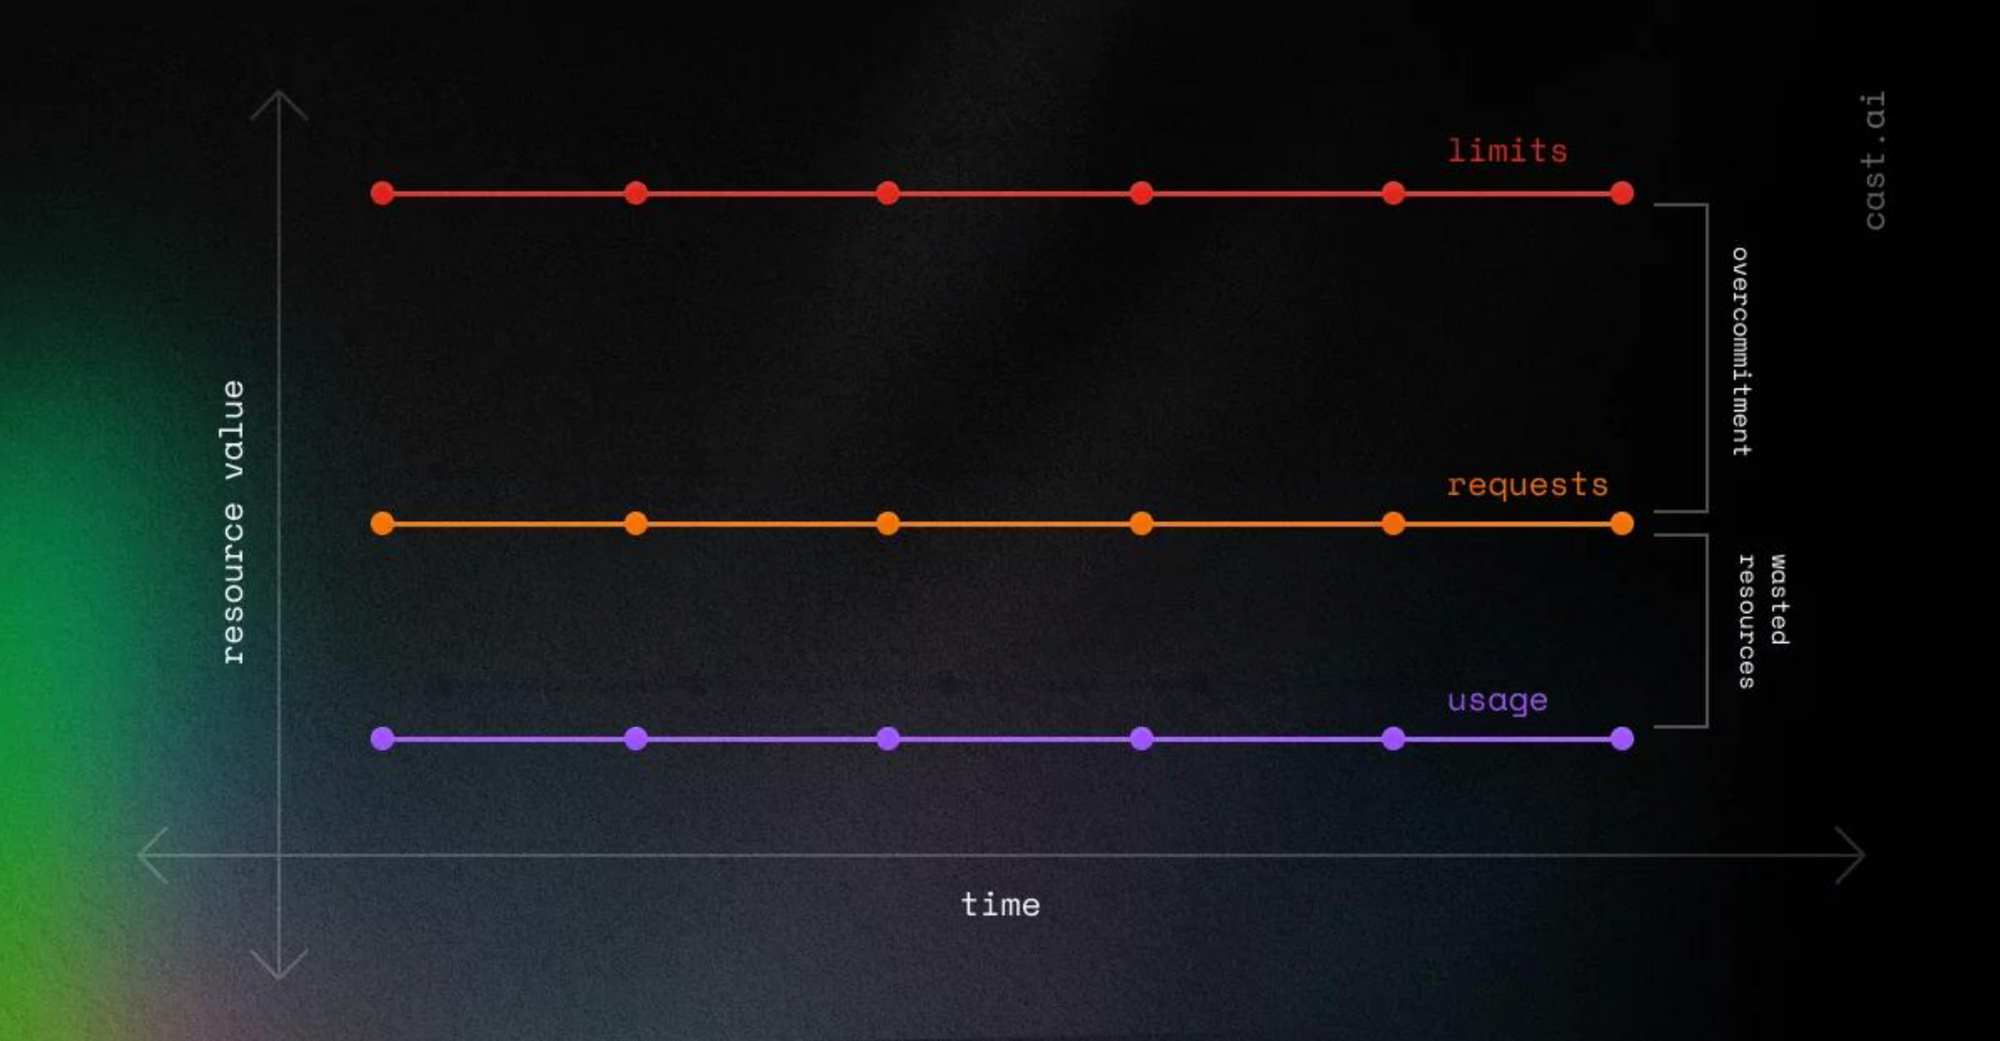
2. Usage exceeds requests but remains below limits: While this is better than the first case, it still results in inefficiencies as CPU throttling may occur.
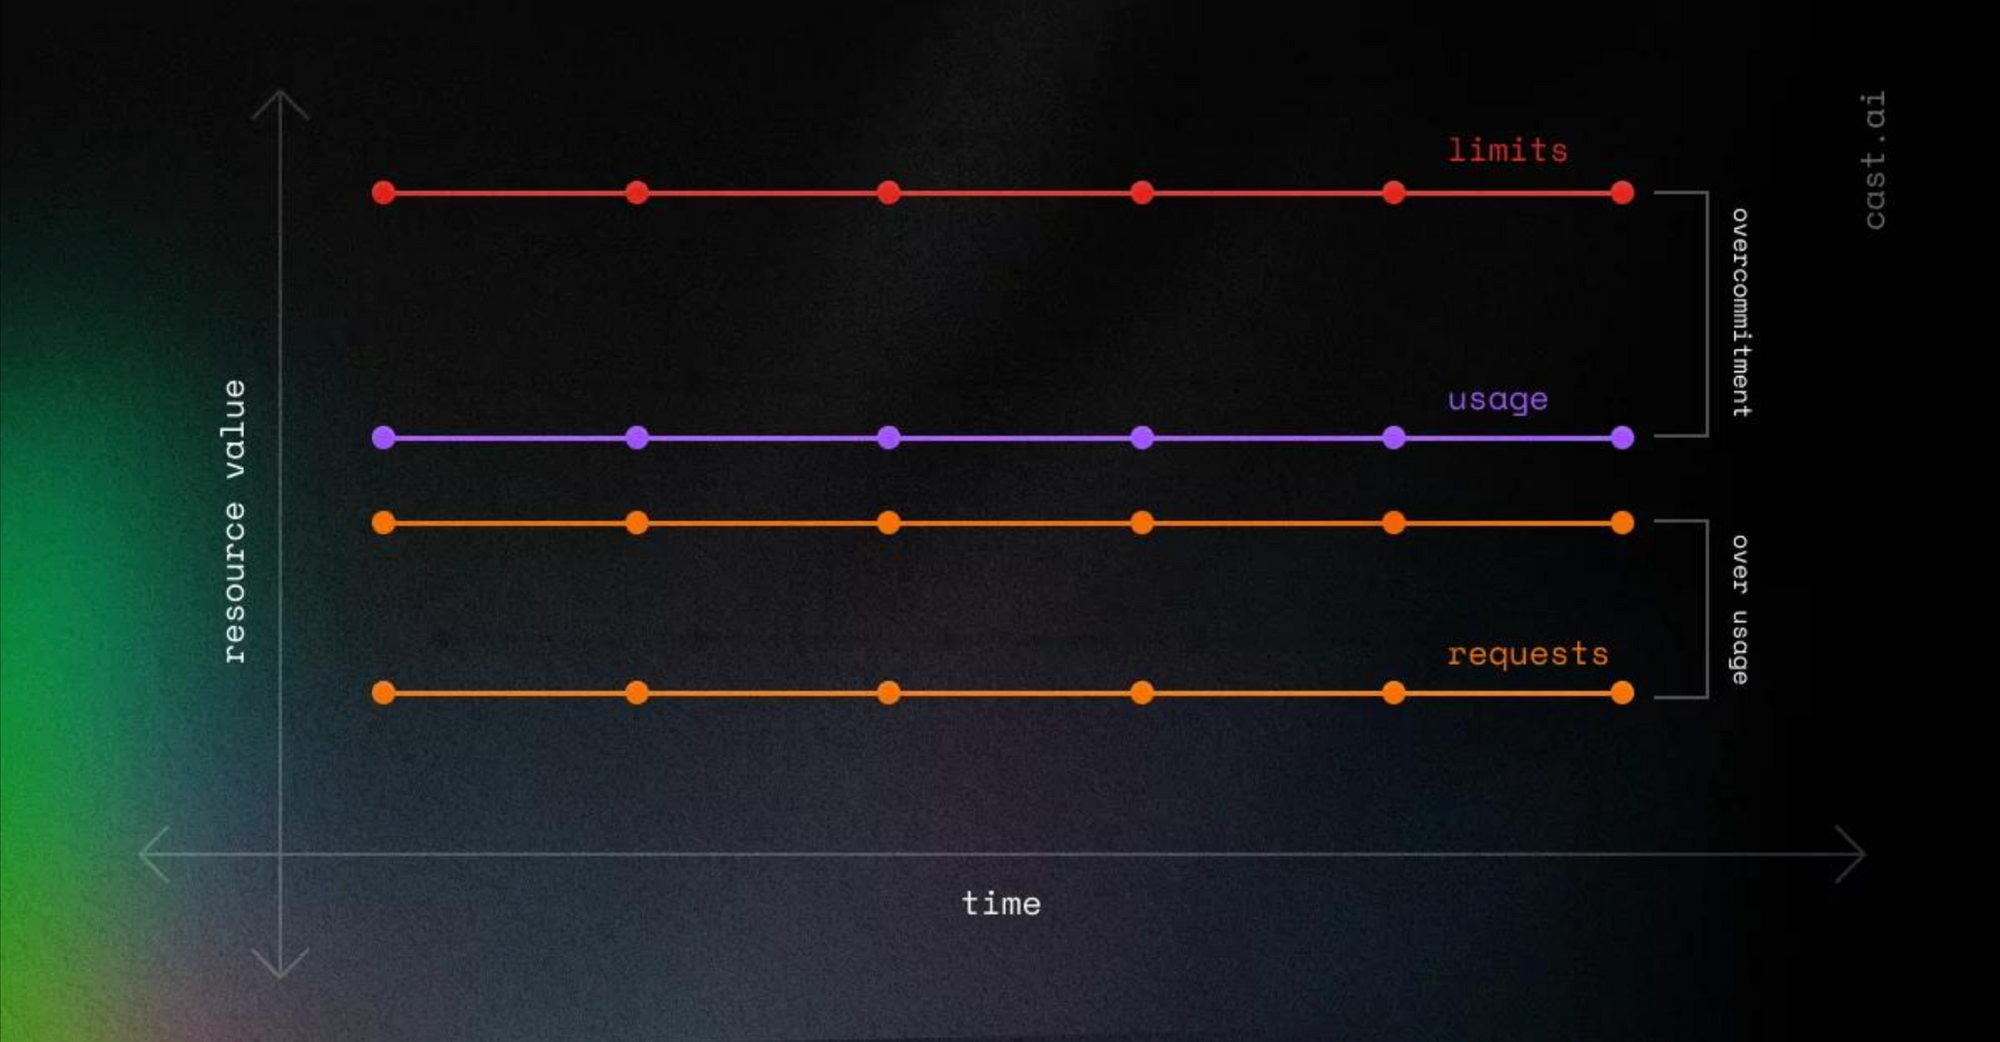
Both situations indicate resource overcommitment, which should be optimised.
Optimising Requests & Limits
A practical approach is to set requests based on the 99th percentile of CPU usage while keeping some headroom. This ensures efficient resource allocation while preventing unnecessary throttling.
CPU is a compressible resource, meaning Kubernetes can adjust its allocation dynamically. However, excessive CPU requests may still lead to throttling. Unlike memory, CPU limits do not terminate an application. Instead, Kubernetes enforces limits via throttling using the Completely Fair Scheduler (CFS). If an application tries to exceed its CPU limit, CFS throttles it, leading to degraded performance but not eviction.
Table below summarizes the recommendations provided above which is based on the optimisations we have performed on our production environment accross 100 plus microservices.
Tier/ Category | Request | Limit |
|---|---|---|
Critical / Highly Available | 99.99th percentile CPU Utilisation + 100% headroom | 2x request value or higher if resources available |
Medium | 99th percentile CPU Utilisation + 50% headroom | 2x request value |
Non-critical | 95th percentile CPU Utilisation + 50% headroom or 99th percentile CPU Utilisation + 20% headroom | 1.5X request value |
Note: CPU throttling can occur even if a pod shows low average CPU usage due to how Kubernetes enforces CPU limits.
Pod sizing
Determining the optimal number of pods for your application requires an understanding of:
- Expected traffic load (Requests per Second - RPS, Queries per Second - QPS, or Transactions per Second - TPS).
- Performance requirements and resource utilisation.
- Redundancy needs for high availability.
Steps to Determine Pod Count
1. Gather Traffic Metrics
Collect expected load data, including RPS, QPS, TPS, or database connection counts.
2. Define Resource Requirements
Profile your application to determine CPU and memory consumption per pod under different loads.
3. Measure Pod Capacity
Assess how much traffic a single pod can handle by testing.
○ Maximum RPS/QPS/TPS per pod
○ CPU and memory utilisation at varying loads
4. Apply the Sizing Formula
Number of Pods = (Expected Load/Capacity per pod) + Buffer pods.
Buffer pods handle unexpected traffic spikes and provide redundancy. Use 20% of the total pods or a fixed number (e.g., 2), whichever is higher.
5. Consider Application-Specific Metrics
Depending on your application’s nature, you can incorporate additional custom metrics or use a combination of multiple factors. Horizontal Pod Autoscaler (HPA) can be configured accordingly.
An example for arriving at pod count:
Metric | Value |
|---|---|
Current # of Pods | 8 |
Current Memory Utilization (%) | 40% |
Current CPU Utilization (%) | 20% |
Free Capacity (%) | 70% |
Current Utilization (in pods) | 8 - (8*0.7) = ~ 3 pods |
Required Pods | 3 pods |
Buffer Pods | 2 pods |
Reduction | (8-5) = ~3 |
NOTE: Free capacity = ((100 - Memory%) + (100 - CPU%)) / 2
Automation for Continuous Resource Optimisation
To ensure our Java services are always running with optimal resource configurations, we have developed a Jenkins-based automation. This automation continuously monitors and evaluates JVM parameters, Kubernetes memory and CPU requests/limits and the number of pods for each service.
How It Works
- The automation runs on a weekly schedule, fetching historic data from New Relic using NRQL queries.
- It analyses trends in memory and CPU utilization, comparing them against existing configurations.
- Since CPU is highly compressible, we consider only business hours for historic data analysis to avoid skewed results from idle periods.
- During service boot-up, it will cause temporary CPU spikes, so to reduce the error further we use the 80th percentile for CPU calculations.
- Based on this data, the automation determines whether services have correctly set:
- JVM parameters (-Xmx, -Xms, Metaspace, etc.).
- Kubernetes requests and limits for memory and CPU.
- Pod count based on sustained load and traffic patterns.
Key Benefits
- Proactive Optimisation: Ensures services are always running with the right resources, preventing over-allocation (wasting resources) and under-allocation (risking performance issues).
- Continuous Monitoring: Since new features can change resource needs over time, the automation provides ongoing insights and recommends adjustments dynamically.
- Automated Recommendations: If a service’s resource configuration is suboptimal, the report highlights the necessary increase or reduction to optimise efficiency.
On-Demand Report for Developers
In addition to the weekly report, developers can also generate a real-time report for a specific service. This allows teams to validate and fine-tune resources whenever needed, ensuring that adjustments are data-driven rather than based on assumptions.
By adopting this automation, we achieve continuous optimisation of service resource requirements, balancing performance, stability and cost efficiency.
Results: Optimising Java Services at Scale
At Halodoc, optimizing resource utilisation without compromising performance is a top priority. By implementing structured capacity planning and leveraging ZGC enhancements, we achieved remarkable efficiency improvements across more than 100 plus microservices.
Key Outcomes
- 97% Reduction in OOM Killed Restarts: One of the biggest wins was drastically reducing out-of-memory (OOM) killed pod restarts. This improved system stability and ensured seamless operations, especially for high-traffic services.
- 40% CPU Limit Reduction: By fine-tuning CPU limits based on real-world usage patterns, we minimized overall CPU allocation without impacting service performance.
- 37% CPU Request Reduction: Lowering CPU requests helped optimize scheduling and freed up compute resources for other workloads.
- 20% Memory Limit Reduction: We identified excessive memory allocations and adjusted limits to reflect actual consumption, leading to better memory efficiency.
- 21% Memory Request Reduction: Adjusting memory requests based on historical trends allowed us to prevent overallocation while maintaining performance stability.
- 4% Pod Count Reduction: By efficiently utilizing resources, we reduced the total number of running pods, leading to a leaner, more cost-effective infrastructure.
References
https://blog.bytebytego.com/p/capacity-planning
https://akobor.me/posts/heap-size-and-resource-limits-in-kubernetes-for-jvm-applications
Conclusion
Considering the varying nature of workloads and the complexities of resource allocation, continuous observability is key to understanding application behaviour and making proactive adjustments. Achieving defined SLOs requires an iterative approach, balancing cost and performance based on real-time insights.
The ultimate goal is to find an optimal balance where resource allocation precisely matches workload needs, ensuring efficiency without compromising end-user experience. By leveraging automation as a guiding tool, we can make informed decisions to keep our systems performant, scalable and cost-effective.
Join Us
Scalability, reliability and maintainability are the three pillars that govern what we build at Halodoc Tech. We are actively looking for engineers at all levels and if solving hard problems with challenging requirements is your forte, please reach out to us with your resumé at careers.india@halodoc.com.
About Halodoc
Halodoc is the number one all-around healthcare application in Indonesia. Our mission is to simplify and bring quality healthcare across Indonesia, from Sabang to Merauke. We connect 20,000+ doctors with patients in need through our Tele-consultation service. We partner with 3500+ pharmacies in 100+ cities to bring medicine to your doorstep. We've also partnered with Indonesia's largest lab provider to provide lab home services and to top it off we have recently launched a premium appointment service that partners with 500+ hospitals that allow patients to book a doctor appointment inside our application. We are extremely fortunate to be trusted by our investors, such as the Bill & Melinda Gates Foundation, Singtel, UOB Ventures, Allianz, GoJek, Astra, Temasek and many more. We recently closed our Series D round and in total have raised around USD$100+ million for our mission. Our team works tirelessly to make sure that we create the best healthcare solution personalised for all of our patient's needs and are continuously on a path to simplify healthcare for Indonesia.