
Data Platform @ Halodoc
Data is the backbone of every technology business. And as a health-tech platform, this holds doubly true for Halodoc. Users can interact with Halodoc via:
- Medicine delivery
- Talking to doctors
- Lab tests
- Hospital appointments and medicines
All these interactions generate highly sensitive, diverse and often unstructured data. So, as we grow, it is imperative that we have a robust data platform that can:
- Ensure privacy and security of the data
- Be reliable, scalable, fast and highly available in processing structured as well as semi/un-structured data
- Facilitate the generation of reports and real-time dashboards for the business/operations team
- Provide a platform for the data-science team to run experiments, models and store the results
Data Platform
Halodoc infrastructure is hosted on AWS. Our data infrastructure is a combination AWS managed services and self-hosted services.
Amazon Redshift is our main data warehouse that houses all our data.
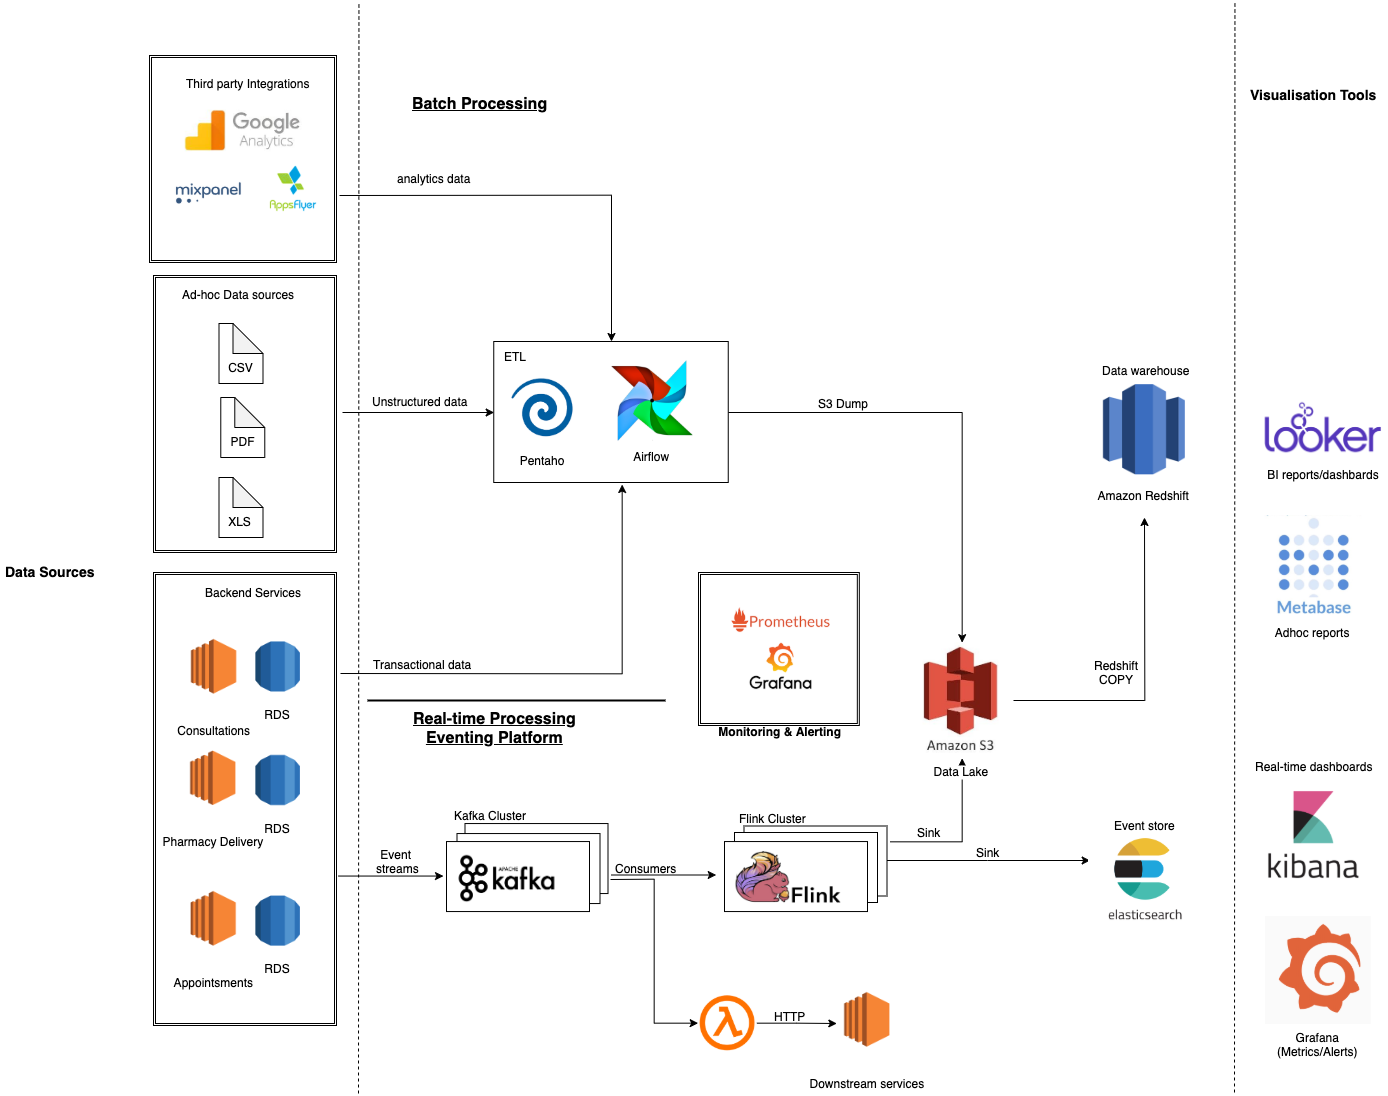
The critical components of the platform are explained below.
Data Sources
The data that is generated at Halodoc falls under following categories:
- Transactional Data - Data generated by various backend services such as consultations, pharmacy orders, appointments etc. This data mostly comes from relational databases (MySQL).
- Digital Health records- The medical reports of doctor appointments, medical bills, prescriptions, insurance claims etc. These could be images or files depending on the hospitals and merchant partners.
- Merchant Inventory Data - The inventory data of our merchant pharmacies can come in different formats (csv, xls) that are uploaded via different tools (SFTP, custom softwares).
- Events from backend services - Our backend consists of micro-services and an event generation / consumption platform for async communication between these services. The events thus generated across different backend services need to be processed and acted on a real-time basis.
- Insurance Claims / Medical Bills- Halodoc, as a TPA is also involved in claim settlements, validating claims and detecting frauds. These documents can be ingested in various formats (csv, xls, PDF) that need to be processed and acted upon in a timely manner for a smoother experience for patients and insurance providers for claim settlements.
Batch Processing Pipeline
The batch processing pipeline serves as the heart of our data platform. The transactional/ad-hoc data that is generated by our backend services and third party analytical tools is processed here and ultimately ends up in the data warehouse. The primary components of this pipeline include:
- ETL Tools
ETL is stands for Extract, Transform, Load. There are a multitude of choices when it comes to ETL tools. At Halodoc, ETL is mainly performed on Airflow and Pentaho. - Pentaho
Pentaho is a tool that provides data extraction, integration, transformation, mining and load capabilities. Pentaho is largely UI driven and is restricted to what the software offers.
At Halodoc, we are slowly moving away from Pentaho to Airflow. More on that in the upcoming blogs! - Airflow
Airflow is a very flexible tool that gives you more control over the transformations while also letting you build your own framework on top of the existing operators. Airflow also provides a nice dashboard to monitor and view job runs and statuses.
Data warehouse and Data lake
A data warehouse is a database optimised to analyse relational data coming from different systems. The data structure, and schema are defined in advance to optimise for fast SQL queries where the results are typically used for operational reporting and analysis. Data is cleaned, enriched, and transformed so that it can act as the “single source of truth” that users can trust.
A data lake is different, because it stores relational data from line of business applications, and non-relational data from mobile apps, IoT devices, and social media. The structure of the data or schema is not defined when data is captured.
- Amazon S3 Data Lake
Amazon S3 is the data lake at Halodoc. All the data from various sources are first dumped into various S3 buckets before loading into Redshift (our data warehouse). The data in S3 acts as a backup too, in case any of the ETL jobs fail. - Amazon Redshift
We use Amazon's Redshift as the centralised data warehouse. We have a six node Redshift cluster. The choice of Redshift was taken when we were a small team. Since we were already on AWS, it was easier. Data flows in from various sources on a regular cadence. Amazon Redshift is optimised for batch loading and loading from S3 via thecopycommand. All our business analysts, data scientists, and decision makers access the data through various visualisation tools (Looker/Metabase), SQL clients and other analytics applications.
The data that is stored in Redshift is modelled as a star-schema. Depending on the business units we have, the central fact tables surrounded by dimension tables.
Real-Time Data Processing Pipeline
The real-time data processing pipeline serves as an underlying infrastructure for the eventing platform at Halodoc. All the backend services at Halodoc generate events after every operation/state change and the events get processed through this pipeline. Most stream based systems consists of these 4 components:
- A log based event store – Distributed, append-able log based system which collects and stores data from different sources. Ex: Kafka, AWS Kinesis Streams, Google PubSub etc.
- Stream computing system – Consumes data from the event store and runs aggregation functions on it. It then stores the result in Serving Layer Store. Ex: AWS Kinesis Data analytics, Apache Flink, Apache Storm, Apache Spark, etc.
- Serving Layer Store – Stores the aggregated data and provides optimised responses to queries. It can store time-series data as well. Ex: InfluxDB, Elasticsearch, AWS DynamoDB etc.
- Serving Layer– Provides visualisation representations to the aggregated data. Ex: Kibana, Grafana, etc.
Architecture
- Apache Kafka – Kafka has become a common denominator in most open source stream processors as the de-facto Storage Layer for storing and moving potentially large volumes of data in a streaming fashion with low latency.
- Apache Flink – An open-source platform that provides data distribution, communication, state management and fault tolerance for distributed computations over data streams.
- Elasticsearch – An open-source data store primarily optimised for search, but off late becoming very popular as Serving Layer Store for operational and business metrics.
- Kibana/Grafana – An open-source visualisation frameworks that connect to Elasticsearch data store and act as the Serving Layer.
Data Visualisation
There are a lot of data visualisation tools available and most of them support a diverse range of data sources for building dashboards. Our choice of tools were primarily driven by the following factors:
- Ease of use – It must be easy for the BI developers/ analysts to create and maintain reports and dashboards.
- RBAC – We should be able to provide fine grained access for the diverse set of users in the company.
- Maintainability – The tools must be easily maintainable, be it in software upgrades, deploying and troubleshooting failures.
Considering all these factors, we arrived at the following tools:
Looker
- Looker is a premium tool, that provides a rich set of visualisations and it is a one stop shop for all our BI reports.
- It provides an easy way to measure the WoW / MoM growth and to track our yearly targets.
- Looker's support team has been very responsive when it comes to resolving our issues. The provision of timely software upgrades with the latest features is also a plus.
Metabase
- Metabase is an easy, open-source tool for everyone in the company to ask questions and visualise data.
- At Halodoc, Metabase serves as a self serve tool wherein operations personnel and BI/Backend developers can query to create custom reports and dashboards.
- We have also integrated with the pulse plugin to send real-time alerts on some of the critical business metrics. Alert channels include slack/email.
Kibana
- Kibana offers a convenient dashboard visualisation since we use Elasticsearch as the datasource.
- All our real-time dashboards for monitoring real-time metrics like merchant cancellations, doctor cancellations, etc. are created in Kibana.
- Our customer support and operation teams rely on these dashboards for making timely decisions.
Monitoring the Data Infra
Monitoring and alerting are integral to keep systems in check and to find issues in production. It also directly impacts the reliability of the platform. Halodoc data infrastructure consists of various tools, some of which are AWS-managed (Redshift, MSK) while others are hosted in-house (Elasticsearch, Flink) and maintained by our devops/data team. The tools we use for monitoring include the following:
Cloudwatch: it is the AWS de facto standard for monitoring metrics and alerting. All the AWS managed services (Redshift, MSK, RDS, DynamoDB) publish their metrics to Cloudwatch and we have alarms setup for:
- CPU usage and Redshift cluster health
- Slow queries on RDS
- Lambda errors.
- Database connections count and more
Alerting channels include slack/emails via Lambda.
Prometheus with Grafana: The combination of Prometheus and Grafana is becoming more and more popular, as the monitoring stack used by DevOps teams for storing and visualising time series data. Prometheus acts as the storage backend and Grafana the interface for analysis and visualisation.
Prometheus collects metrics from monitored targets by scraping metrics from HTTP endpoints via exporters on these targets.
We have self-hosted some of the platform components like Airflow, Elasticsearch, Flink etc. The decision to self-host these tools were taken considering the cost, knowledge of our devops/data team and monitoring costs.
We have prometheus metrics exporters available for all these tools and there are open-source Grafana dashboards for Elasticsearch, Airflow and Flink that we use.
We have alerting setup on prometheus based on various thresholds across a multitude of metrics available, to alert via slack/email.
In this blog, we gave a birds eye view of the Data Platform @ Halodoc, the journey of data from different sources to various visualisation tools. The thought process that we went through while choosing these tools. Maintaining and running this infra is a herculean task and we continuously challenge ourselves to keep the infra simple and solve the problems more efficiently.
Scalability, reliability and maintainability are the three pillars that govern what we build at Halodoc Tech. We are actively looking for data engineers/architects and if solving hard problems with challenging requirements is your forte, please reach out to us with your resumé at careers.india@halodoc.com.
About Halodoc
Halodoc is the number 1 all around Healthcare application in Indonesia. Our mission is to simplify and bring quality healthcare across Indonesia, from Sabang to Merauke.
We connect 20,000+ doctors with patients in need through our Tele-consultation service. We partner with 1500+ pharmacies in 50 cities to bring medicine to your doorstep. We've also partnered with Indonesia's largest lab provider to provide lab home services, and to top it off we have recently launched a premium appointment service that partners with 500+ hospitals that allows patients to book a doctor appointment inside our application.
We are extremely fortunate to be trusted by our investors, such as the Bill & Melinda Gates foundation, Singtel, UOB Ventures, Allianz, Gojek and many more. We recently closed our Series B round and In total have raised USD$100million for our mission.
Our team work tirelessly to make sure that we create the best healthcare solution personalised for all of our patient's needs, and are continuously on a path to simplify healthcare for Indonesia.