

Enabling Data Intelligence: Data Profiling Framework at Halodoc
How we built a scalable, config-driven data profiling system to bring visibility, trust, and self-serve intelligence to our data pipelines.
Data is only as good as our understanding of it. As datasets grow into the hundreds of tables and stretch across multiple storage systems, even basic questions, like whether a column is trustworthy, how two tables relate, or how a dataset evolves over time, become surprisingly hard to answer. At that scale, ad-hoc SQL exploration stops being viable, and data quality shifts from a nice-to-have into a core engineering concern.
This post explores what data profiling really means, why it matters for any organisation working with large, distributed data, and the common challenges teams face when trying to maintain trust in their data. It then walks through how we approached this problem at Halodoc by building an Airflow-native Data Profiling Framework, a three-pronged system covering column-level profiling, join intelligence, and source table analysis, designed to give analysts and engineers a shared, reliable view of their data.
The Problem We Faced
Before this framework existed, BIA (Business Intelligence & Analysis) and DE (Data Engineering) teams regularly hit the same walls:
| Problem | Impact |
|---|---|
| No column-level visibility | Analysts guessed nullability, uniqueness, and data ranges |
Manual SELECT COUNT(*) checks
|
Time consuming, inconsistent, not tracked |
| Join failures discovered late | Pipeline breakages found in production |
| No historical baseline | Impossible to detect regressions or drift |
| DE bottleneck | Every data question required an engineer |
Teams were writing exploratory SQL queries repeatedly, with no reuse and no memory. A BIA analyst joining two tables for the first time had no way of knowing if those tables had been reliably joined before or which column to use.
What Is Data Profiling?
Data profiling is the process of examining datasets to collect statistics and metadata that describe their structure, content, and quality. Done well, it answers questions like:
- Is this column reliable enough to join on?
- Which values exist in this categorical field?
- How does data volume grow day over day?
- Are two tables actually joinable? How have they been joined before?
At its core, profiling computes four classes of checks across a dataset:
| Check Type | What It Tells You |
|---|---|
| Null Checks | % of missing values per column |
| Uniqueness | Distinct count, usability as a key |
| Distribution | Value frequencies, min/max, mean, median |
| Schema/Structure | Data types, length ranges, empty strings |
Together, these checks form the foundation for everything downstream, from trust in dashboards to confidence in joins.
Framework Architecture
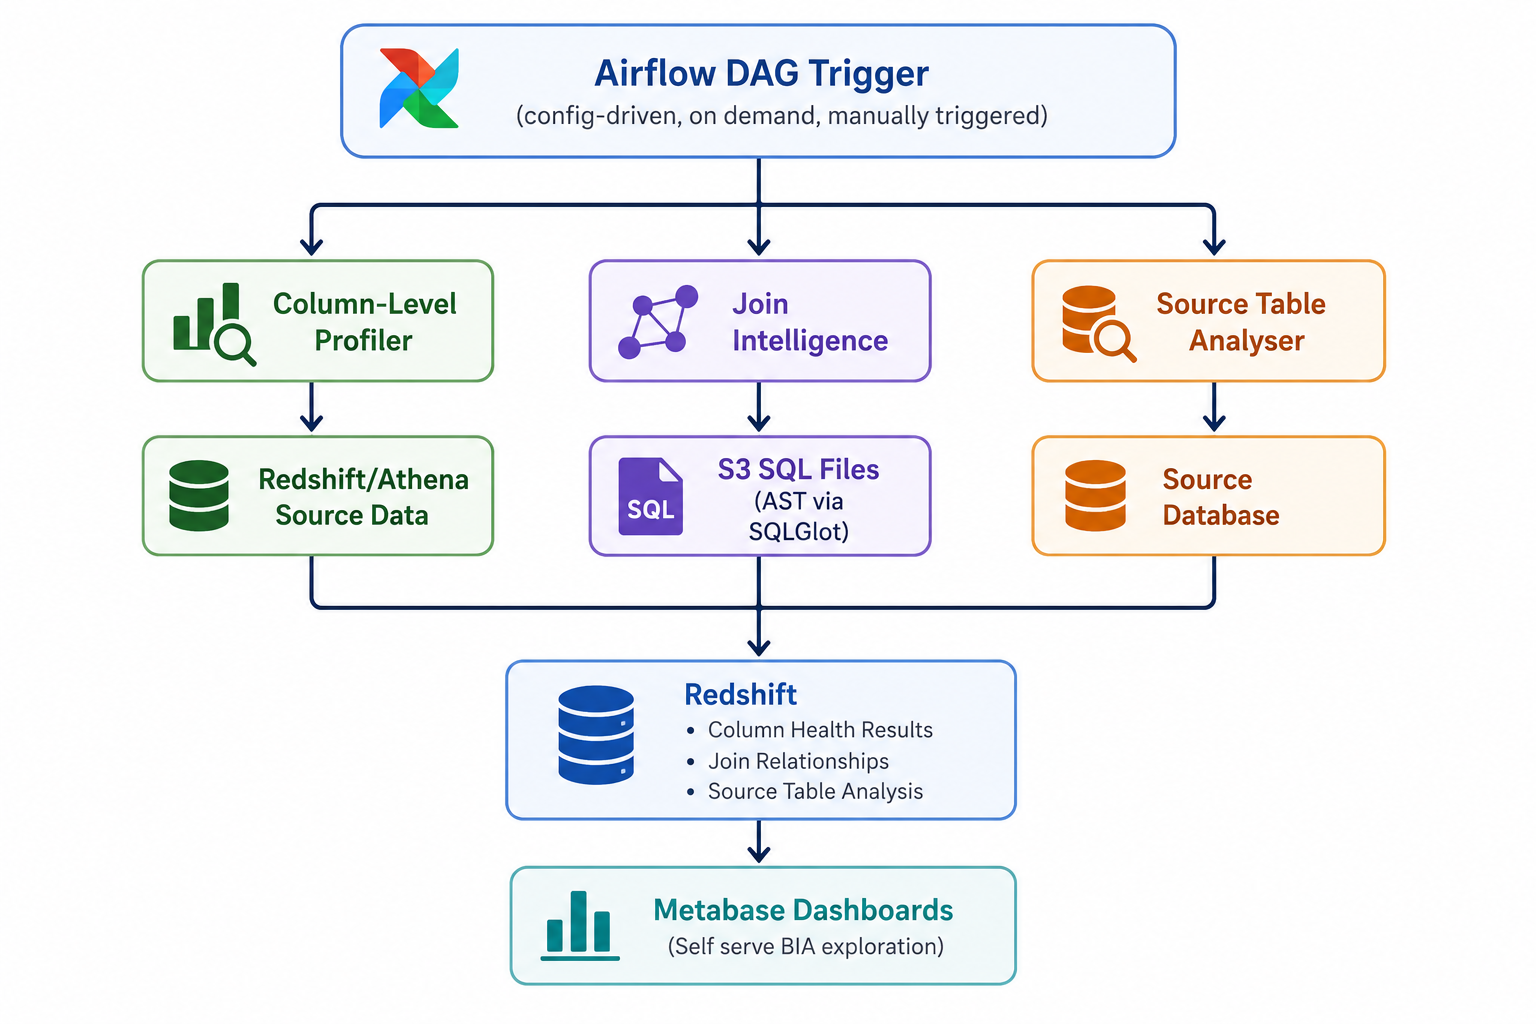
The framework was designed as a modular, Airflow-native system where each profiler solves a different aspect of data understanding. While the profilers operate independently, they follow a shared orchestration and storage pattern, allowing results to be centrally queried and visualized through Metabase dashboards.
At a high level, the architecture consists of three profiling components: column-level profiling, join intelligence extraction, and source table analysis.
Design Decisions & Trade-offs
Compute: Kubernetes Pods
- Profiling queries are pushed down to the database engine (Redshift or Athena)
- Kubernetes pods keep it lightweight and isolated
Batch Over Streaming
- Data profiling is inherently retrospective. Understanding data that already exists does not require real-time processing
- On demand DAG triggers (no schedule) let teams profile only when needed
Storage: Redshift + S3
- Results land in Redshift for queryability
- Athena query results are unloaded to S3 as Parquet files and then loaded into Redshift staging for further processing
- Staging table pattern prevents partial writes to production tables
Config-Driven, Not Hardcoded
- All profiling parameters (tables, date ranges, filters, group columns) are passed via a trigger config
- No code changes needed to profile a new table, just trigger the DAG with a JSON config
Parallel Execution via Dynamic Task Mapping
- Both profilers use dynamic fan out via Airflow's expand and map pattern
- Each table gets its own pod, fully isolated, one failure does not block others
SQLGlot vs SQLLineage: Why SQLGlot?
For the Join Intelligence profiler, we needed to parse existing SQL files and extract join relationships. Two serious candidates:
| Dimension | SQLLineage | SQLGlot |
|---|---|---|
| Primary Purpose | Lineage extraction (table level) | Full SQL parsing & AST traversal |
| Join Column Extraction | Not designed for it |
Native —
Column,
Join,
EQ
nodes
|
| Dialect Support | Limited | Spark, Redshift, Postgres, Trino, BigQuery |
| AST Access | Abstracted away | Full programmatic AST access |
| Error Handling | Opaque |
ParseError,
TokenError
— catchable
|
| Speed | Slower on large files | Fast, pure Python |
| Fallback Control | None | We control dialect fallback logic |
Why SQLGlot? We needed to extract which columns two tables join on and not just which tables reference each other. SQLLineage's column lineage is transformation oriented and not designed to extract join predicates. SQLGlot's AST gives us direct access to Join nodes, ON conditions, and Column references.
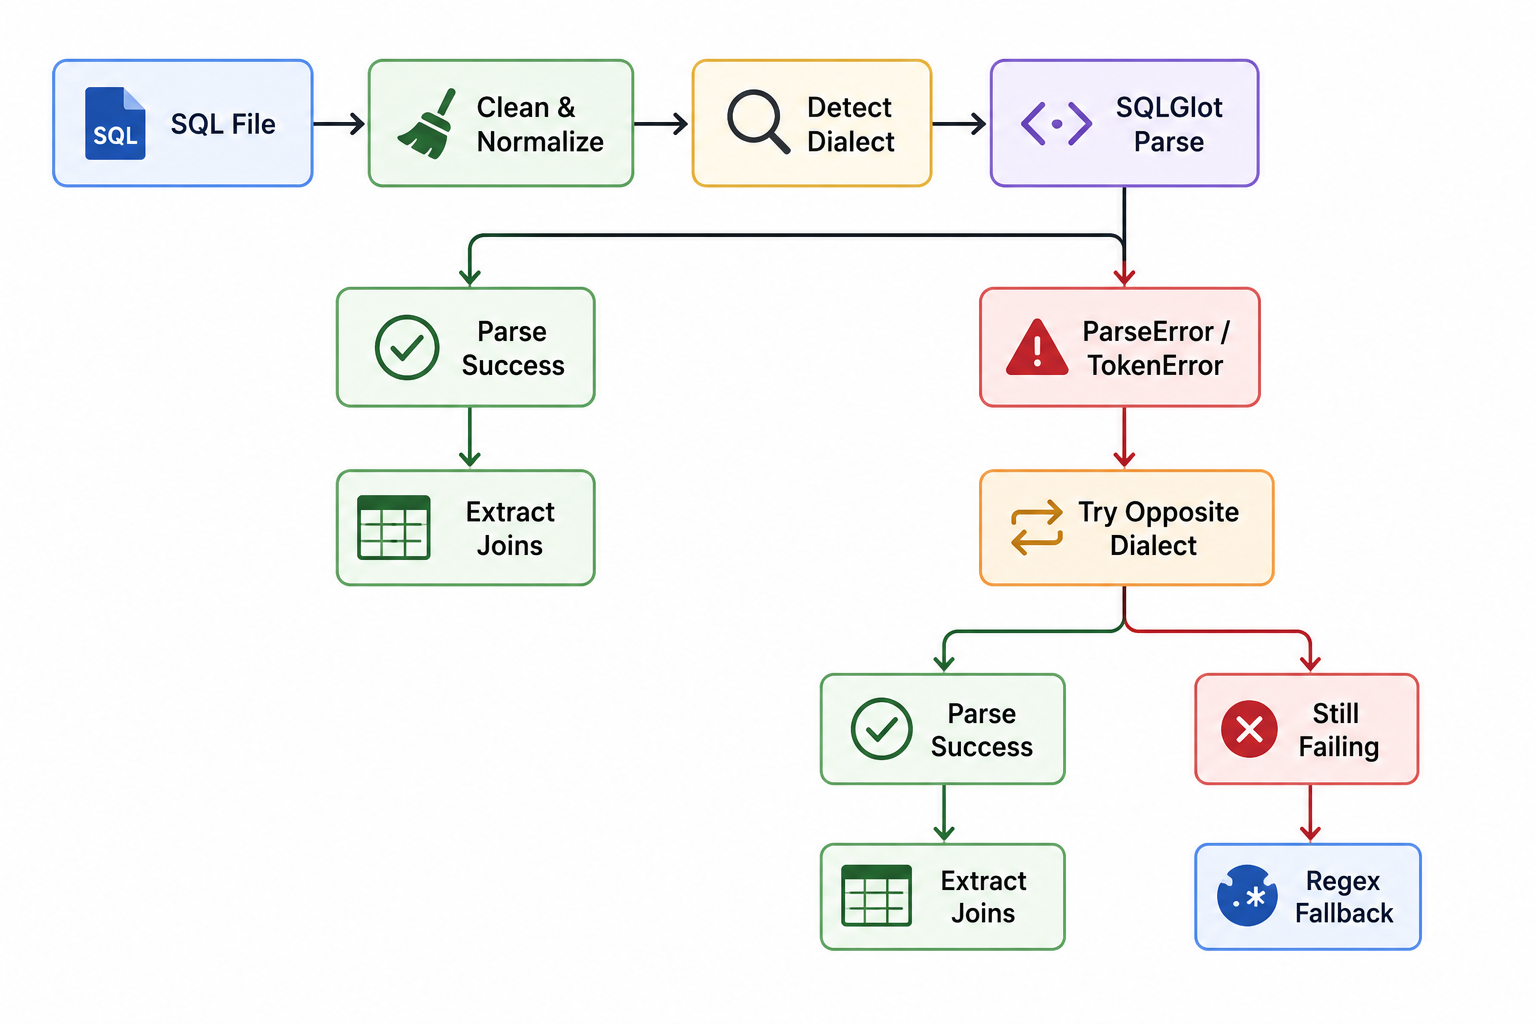
We also implemented a two pass dialect strategy: try the detected dialect first (Spark or Redshift based on keyword scoring), then fall back to the opposite, then fall back to regex extraction.
Key Features
Column-Level Profiler
The Column-Level Profiler generates profiling SQL dynamically based on the source engine and pushes execution directly to Redshift or Athena, avoiding any movement of raw data outside the warehouse. It supports three profiling modes:
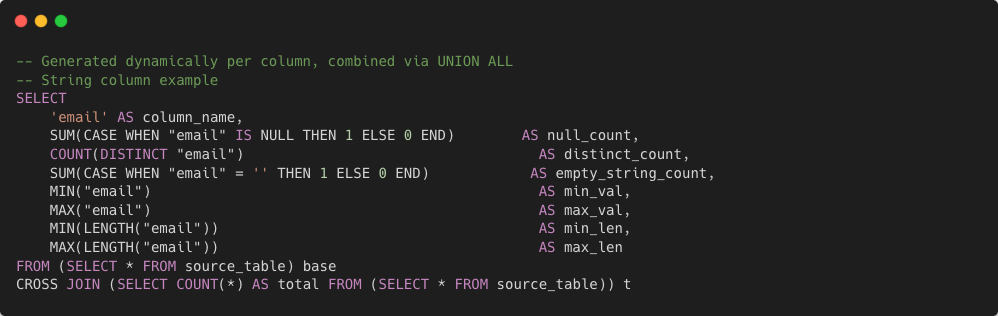
- Type 1 — Column Health: computes null percentage, distinct count, min/max values, length ranges, and numeric statistics using dynamically generated
UNION ALLqueries so the table is scanned only once.
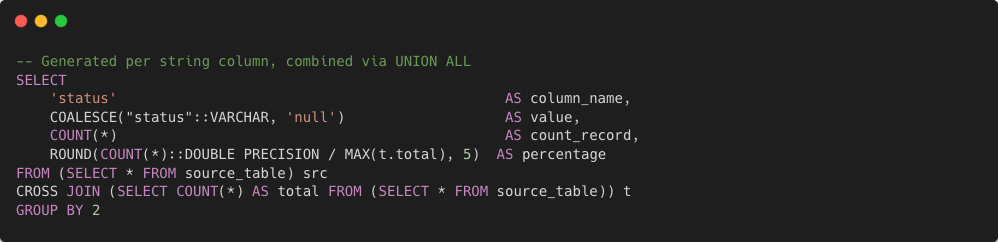
- Type 2 — Value Distribution: generates
GROUP BYqueries across string columns to compute value frequencies and percentage distribution for categorical analysis.
- Type 3 — Sample Records: uses
ROW_NUMBER() OVER (PARTITION BY ...)to extract one representative row per group for raw data inspection.
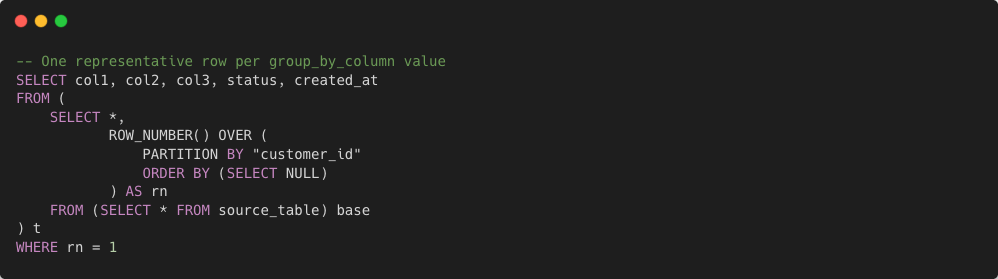
All outputs are first written into staging tables and then inserted into final result tables with a unique run_id for safe reruns and historical tracking. Optional filters such as date ranges and custom WHERE clauses allow profiling to be scoped to specific time windows.
Join Intelligence
The Join Intelligence profiler extracts real join relationships directly from production SQL files stored in S3. Before parsing, SQL files pass through a normalization pipeline that cleans encoding issues, replaces template macros, and standardizes dialect-specific syntax.
The profiler then:
- detects the likely SQL dialect
- parses SQL using SQLGlot AST traversal
- extracts tables, join columns, join types, and operators
- resolves aliases across nested CTEs and subqueries
If parsing fails, the workflow retries with an alternate dialect before falling back to regex-based extraction. Every extracted relationship is tagged with:
- source file
- detected dialect
- extraction method (
sqlglot_primary,fallback,regex)
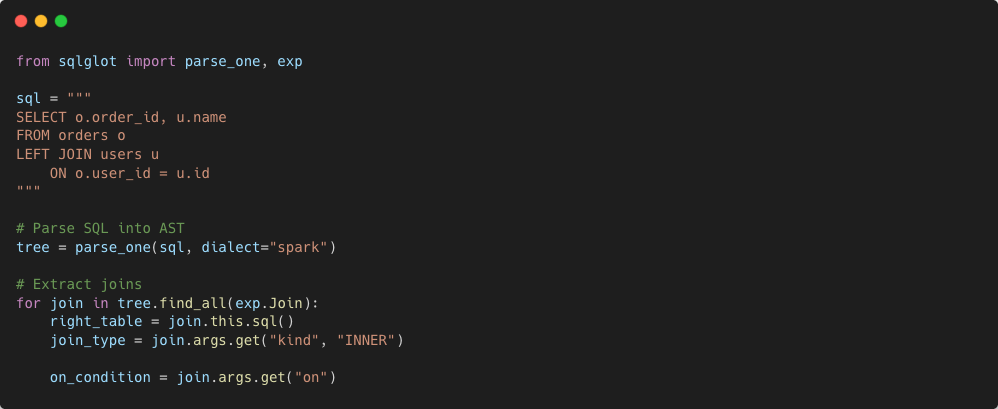
The extracted joins are batch inserted into Redshift to build a searchable relationship graph for downstream exploration.
Source Table Analyser
The Source Table Analyser profiles source systems safely without performing expensive full-table scans on transactional databases.
Instead of reading raw data directly, it primarily relies on information_schema and engine metadata to collect:
- table size
- estimated row count
- column count
- index information
The analyser automatically discovers timestamp columns and uses indexed time ranges for bounded sampling when available. Non-indexed tables fall back to metadata-only estimation to avoid unsafe scans.
Historical Hudi metrics such as file sizes, partition counts, and compaction efficiency are then combined with source metadata to generate:
- partition recommendations
- Spark executor sizing suggestions
- compaction priority
- partition explosion warnings
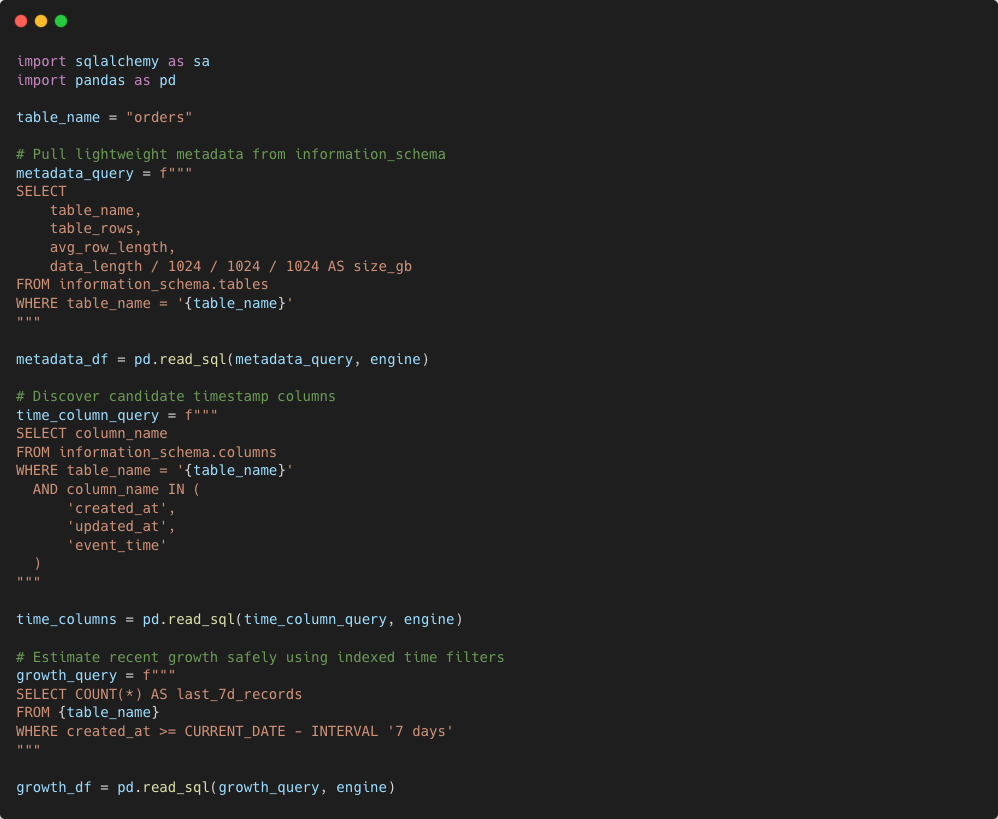
All recommendations and health signals are persisted into Redshift and surfaced through dashboards for operational visibility.
Implementation Highlights
The framework was designed to be operationally safe, scalable, and easy to extend. Since profiling workloads run across multiple tables and engines, the orchestration layer focused heavily on validation, isolation, and predictable execution.
Airflow DAG Structure
Every DAG follows a validation first pattern before any compute is triggered:
start → validate_config → decide_execution_path → profiling_tasks → endThe validation layer checks required parameters, profiling mode, engine compatibility, and date filters. Invalid configs fail immediately with a clear error rather than consuming warehouse or Kubernetes resources. A Branch Operator then routes execution to the correct profiler based on mode.
Kubernetes Pod Fan Out
Each table expands into its own isolated Kubernetes pod at runtime using Airflow Dynamic Task Mapping:
run_profiler = KubernetesPodOperator.partial(
    task_id="run_profiler",
    deferrable=True,
    reattach_on_restart=False,
).expand(
    arguments=table_configs.map(...)
)
deferrable=True releases the Airflow worker while pods run so no worker slots are held. reattach_on_restart=False prevents ghost pod reattachment on scheduler restart. One table failure does not block others and retries remain fully isolated.
Pushdown Compute
All heavy computation runs directly inside Redshift or Athena. No raw data moves through Airflow workers. Only aggregated profiling results are transferred back.
Staging Table Safety Pattern
For Athena to Redshift flows, a staging pattern guarantees atomic and re-runnable writes:
Athena UNLOAD → S3 (Parquet/GZIP) → COPY into staging → INSERT into production with run_idDELETE FROM staging_table;
COPY staging_table
FROM 's3://bucket/path/'
FORMAT AS PARQUET;
INSERT INTO production_table
SELECT *, :run_id FROM staging_table;This prevents partial writes, keeps reruns idempotent, and ensures production tables always contain complete profiling snapshots. The run_id on every row enables historical comparison across runs.
Sample Outputs
Type 1 — Column Health
This output provides a high-level health summary for every column in a table. It helps answer questions such as:
- Can this column be safely used as a join key?
- Does the column contain excessive nulls?
- Are there unexpected value ranges or outliers?
- How unique is the data?
For example:
order_idhas0%nulls and1,000,000distinct values, indicating it behaves like a reliable primary key.statushas only7distinct values, making it a good candidate for categorical analysis.amountshows a wide numeric range (0 → 9.9M), which can help detect abnormal spikes or data quality issues.
| column_name | data_type | null_pct | distinct_count | mean_val | min_val | max_val | total_records |
|---|---|---|---|---|---|---|---|
| order_id | varchar | 0.0 | 1000000 | — | ORD-0001 | ORD-9999 | 1000000 |
| status | varchar | 0.002 | 7 | — | cancelled | pending | 1000000 |
| amount | double | 0.05 | 84320 | 145230.5 | 0.0 | 9900000.0 | 1000000 |
Type 2 — Value Distribution
This output focuses on categorical distribution analysis. It is particularly useful for understanding business state distributions, skewed datasets, and dominant values.
In this example:
completedorders dominate the dataset (71.2%)pendingandcancelledform smaller but operationally important segments- sudden changes in these percentages over time can indicate pipeline regressions or business anomalies
This profiling mode is especially useful for:
- dashboard validation
- anomaly detection
- business KPI monitoring
- categorical feature understanding for ML workflows
| column_name | value | count_record | percentage |
|---|---|---|---|
| status | completed | 712000 | 0.712 |
| status | pending | 180000 | 0.18 |
| status | cancelled | 108000 | 0.108 |
Join Relationships
The Join Intelligence profiler converts production SQL into a searchable relationship graph between datasets.
This output helps analysts understand:
- which tables are commonly joined together
- which columns are trusted join keys
- how datasets are connected across domains
- where join inconsistencies may exist
For example:
orders.customer_id → users.idindicates a standard customer enrichment patternconsultations.doctor_id → doctors.idshows healthcare-domain relationships extracted directly from production queries
Because these joins are extracted from real SQL workloads instead of manually curated metadata, they reflect actual production usage patterns.
| left_table | left_column | right_table | right_column | join_type | query_file |
|---|---|---|---|---|---|
| orders | customer_id | users | id | LEFT | sql-query/oms/order_summary.sql |
| consultations | doctor_id | doctors | id | INNER | sql-query/care/consult_agg.sql |
Performance & Scalability
The framework was designed to scale across hundreds of tables while keeping Airflow, warehouses, and source systems operationally safe.
All profiling queries are pushed down directly to Redshift or Athena, so computation happens inside the warehouse itself instead of moving raw data through Airflow workers. Only aggregated profiling results are transferred back.
To scale horizontally, the framework uses Kubernetes pod fan-out where each table runs in its own isolated pod.
KubernetesPodOperator.partial(...)
    .expand(arguments=table_configs)
This provides:
- linear scalability across tables
- isolated retries and failures
- predictable resource allocation
For Join Intelligence, the framework skips known non-production paths such as backup and one-time activity folders before parsing SQL files. Extracted joins are committed in configurable batches to avoid long-running Redshift transactions.
if len(batch) >= commit_size:
    connection.commit()
For the Source Table Analyser, scalability focuses on protecting OLTP systems. The analyser uses indexed timestamp columns for bounded sampling and falls back to metadata-only estimation when indexes are unavailable, avoiding expensive full-table scans.
Together, these optimizations allow the framework to process large-scale profiling workloads efficiently while keeping infrastructure usage predictable and safe.
Real-World Impact
| Area | Before | After |
|---|---|---|
| Column Understanding | Writing the queries, executing them, and reviewing the results to understand a single table took close to an hour | Full column profile ready in around 10 minutes, self serve via Metabase with no SQL needed |
| Join Discovery | Finding the right join key was hit and trial, taking anywhere from 30 minutes to an hour and often still causing data loss | Join candidates found in under 10 minutes by querying the relationships table directly |
| Quality Baseline | No baseline existed, regressions went undetected for days or weeks until something broke | Historical runs tracked per execution, drift visible immediately on the next profiler run |
| Partition Strategy | Engineers manually reviewed table sizes and growth trends before deciding, often taking half a day | Recommendations generated automatically in a single analyser run, no manual investigation needed |
| Compaction Issues | Discovered only during production incidents, by which point resolution took hours | Flagged proactively on every run before they have a chance to impact any job |
Challenges & Learnings
SQL diversity is harder than expected
- Production SQL files contained Jinja macros, smart quotes, BOM characters, half written
BETWEENclauses, and dialect mixed queries - Solution: a layered normalization pipeline before any parsing attempt
AST extraction needs fallback layers
- No single parser handles all real world SQL perfectly
- Solution: primary dialect → opposite dialect → regex — with method tracked per file for observability
Staging table concurrency
- Multiple pods writing to the same staging table caused race conditions
- Solution:
DELETE+INSERTpattern with per run isolation
Information schema row counts are estimates
- Row counts from the database's information schema are approximate for InnoDB tables
- Solution: flagged in output metadata; indexed time range
COUNTused as the primary source when available
Partition explosion is a silent killer
- Some tables had 50k+ partitions due to misconfigured granularity
- Solution: explicit threshold check (>10,000 partitions) with a warning flag in output
Conclusion
The Halodoc Data Profiling Framework turned data understanding from a manual, engineer-dependent process into a self serve, automated system. By combining:
- Column-level profiling for data quality and trust
- Join relationship mining via SQLGlot AST analysis
- Source table intelligence for informed ingestion decisions
We gave engineers visibility into production data quality, surfacing issues before they silently propagate downstream.
Data profiling is not a one-time activity, it is infrastructure. The earlier you build it into your pipelines, the more trust your data platform earns.
References


Join us
Scalability, reliability, and maintainability are the three pillars that govern what we build at Halodoc Tech. We are actively looking for engineers at all levels and if solving hard problems with challenging requirements is your forte, please reach out to us with your resumé at careers.india@halodoc.com.
About Halodoc
Halodoc is the number one all-around healthcare application in Indonesia. Our mission is to simplify and deliver quality healthcare across Indonesia, from Sabang to Merauke.
Since 2016, Halodoc has been improving health literacy in Indonesia by providing user-friendly healthcare communication, education, and information (KIE). In parallel, our ecosystem has expanded to offer a range of services that facilitate convenient access to healthcare, starting with Homecare by Halodoc as a preventive care feature that allows users to conduct health tests privately and securely from the comfort of their homes; My Insurance, which allows users to access the benefits of cashless outpatient services in a more seamless way; Chat with Doctor, which allows users to consult with over 20,000 licensed physicians via chat, video or voice call; and Health Store features that allow users to purchase medicines, supplements and various health products from our network of over 4,900 trusted partner pharmacies. To deliver holistic health solutions in a fully digital way, Halodoc offers Digital Clinic services including Haloskin, a trusted dermatology care platform guided by experienced dermatologists.
We are proud to be trusted by global and regional investors, including the Bill & Melinda Gates Foundation, Singtel, UOB Ventures, Allianz, GoJek, Astra, Temasek, and many more. With over USD 100 million raised to date, including our recent Series D, our team is committed to building the best personalized healthcare solutions — and we remain steadfast in our journey to simplify healthcare for all Indonesians.