
Real Time Aggregation of Test Reports using TestNG
Why Automation?
In an agile world, test automation is very crucial. With incremental developments, frequent changes and continuous testing, it is imperative to have test automation in place. These automated tests will help in getting a quick visibility into code quality early on and the turn-around time can be reduced considerably. With automation, testing can be repeated as many times allowing detailed and exhaustive examination of the code. This is highly useful in ensuring code quality when working in a limited testing window.
What is TestNG and Why?
In simple words, TestNG is a test framework which can be used to automate tests starting from unit tests, integration tests to system tests.
You can read more about the functionalities TestNG offers from their official website, here. Because of these reasons, here at Halodoc, TestNG is being used in most of our test automation projects.
Challenges with Automation tracking and Test Reports
With increased number of test automation projects (Both FE and BE), having CI/CD pipeline set-up for each project was a necessity. Even with this, tracking the progress of test automation and the results of test executions were becoming a challenge. (You can find more details on how we automate in an agile environment, here.)
Real time aggregated test reporting in Halodoc
At Halodoc, most of our automation frameworks are integrated with TestNG. We needed a mechanism to capture automation progress as well as the test execution results. We leveraged TestNG and TestNG Listeners to capture and display all the metrics from different test projects on to a single dashboard. InfluxDB was selected as a datasource to store all the captured metrics.
TestNG Listeners
One of the interesting features that TestNG offers is TestNG Listeners. TestNG Listeners are interfaces using which we can alter the behaviour of test execution. These listeners listen to the events during program execution.
Grafana Dashboard
Grafana is a multi-platform open source analytics and interactive visualization web application. It provides charts, graphs, and alerts for the web when connected to supported data sources. It is expandable through a plug-in system. End users can create complex monitoring dashboards using interactive query builders.
How did we achieve this?
Below diagram shows the integration and interaction between test automation, TestNG, InfluxDB and Grafana.
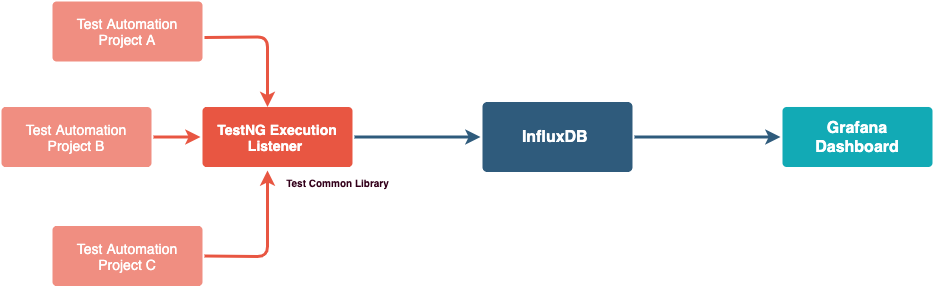
Using TestNG Listeners, we aggregated results of various automation suites in real time into InfluxDB. Grafana Dashboard was used (with necessary plugins) to display the details graphically . With large number of test automation projects and suites, having a consolidated report helped in tracking the progress of test automation along with the test results.
Test Commons
We have a common projects for test automation. All the reusable components across different test automation projects are maintained here. We added few common libraries. One for establishing an influxDB connection and the other for capturing the test results or metrics during the run using TestNG Listeners (Sample is given below for illustration purpose).
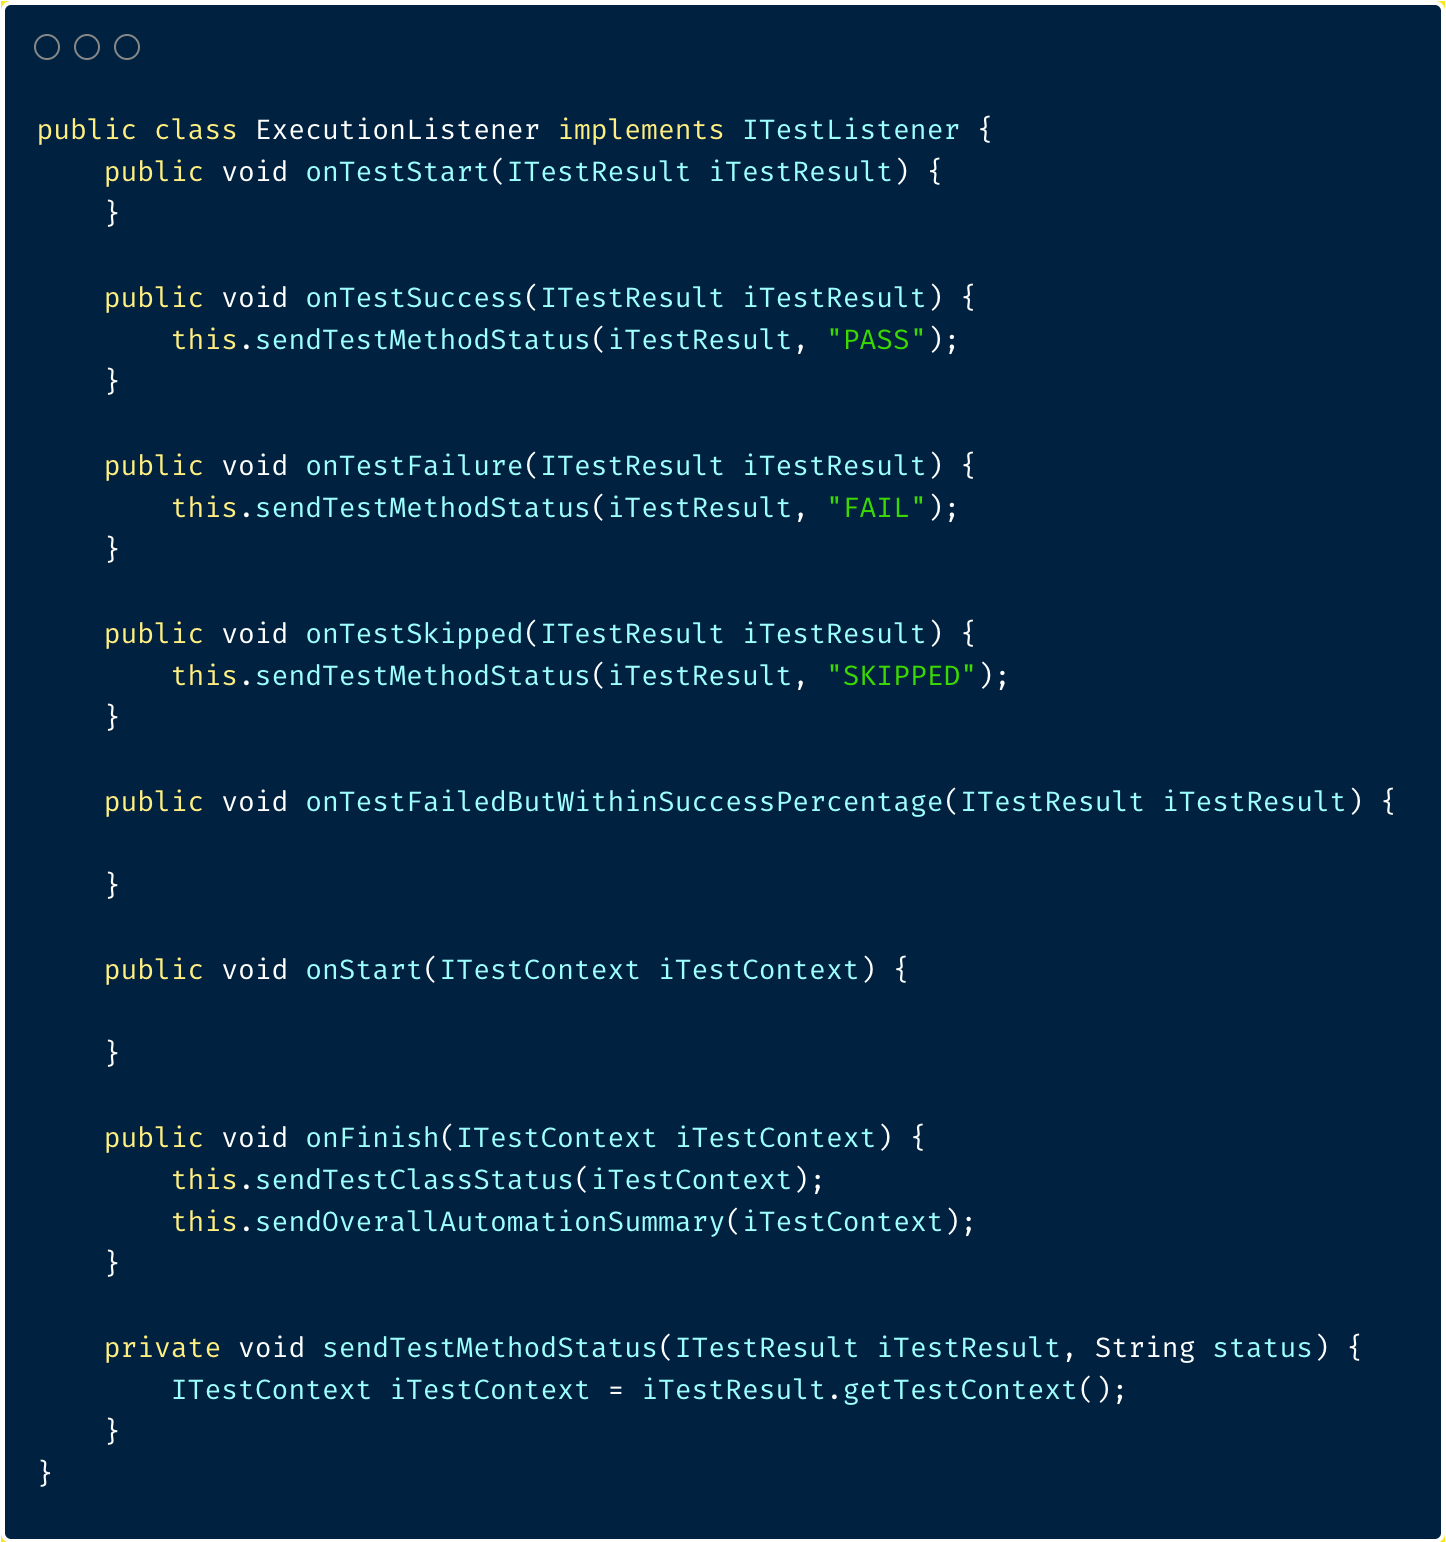
Any custom listener (ex: ExecutionListener) implementing TestNG listener will have implementations for each events fired during the execution of the test. We captured different parameters that are required for our reports and stored them in influxDB (ex: test class status, overall test summary, etc) using these custom listeners.
Test Project
Create a property file to hold DB configuration: We maintained a property file in project's build path containing influxDB connection details.
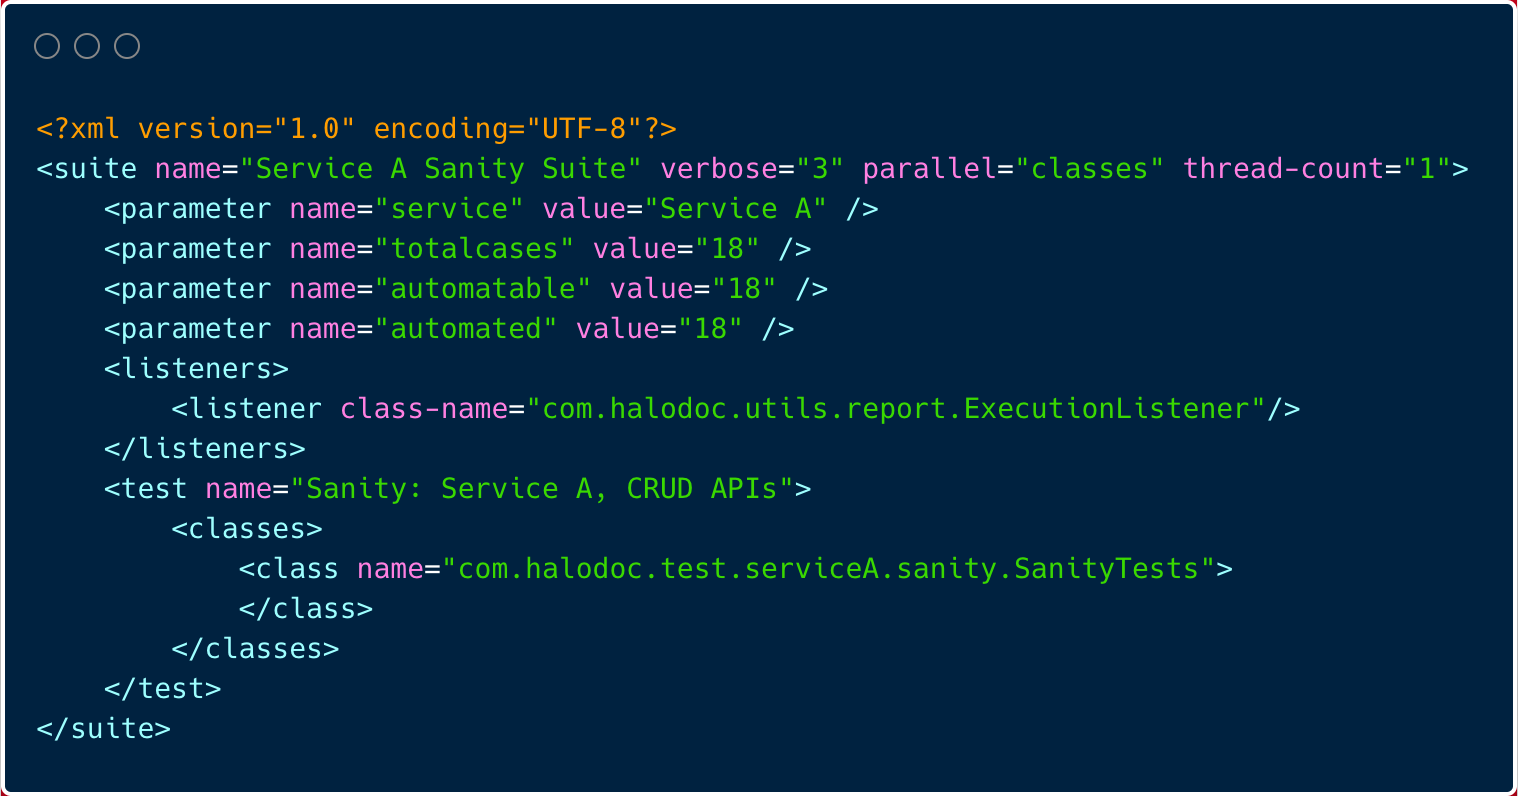
We added an ExecutionListener to our testng.xml file along with additional params for tracking. ExecutionListener will listen to the test execution and will capture different parameters such as,
- Test suite name
- Test name
- Test class
- Test method
- Total tests run
- Test status: PASS/FAIL/SKIP
These additional parameters (defined in testng.xml) can be used to track progress of automation in agile STLC. An example testng.xml file is given below. The parameters defined are also stored (influxDB) and captured in reports (Grafana).
In future, we can make TestNG listen to more metrics and capture the same to create more sophisticated reports.
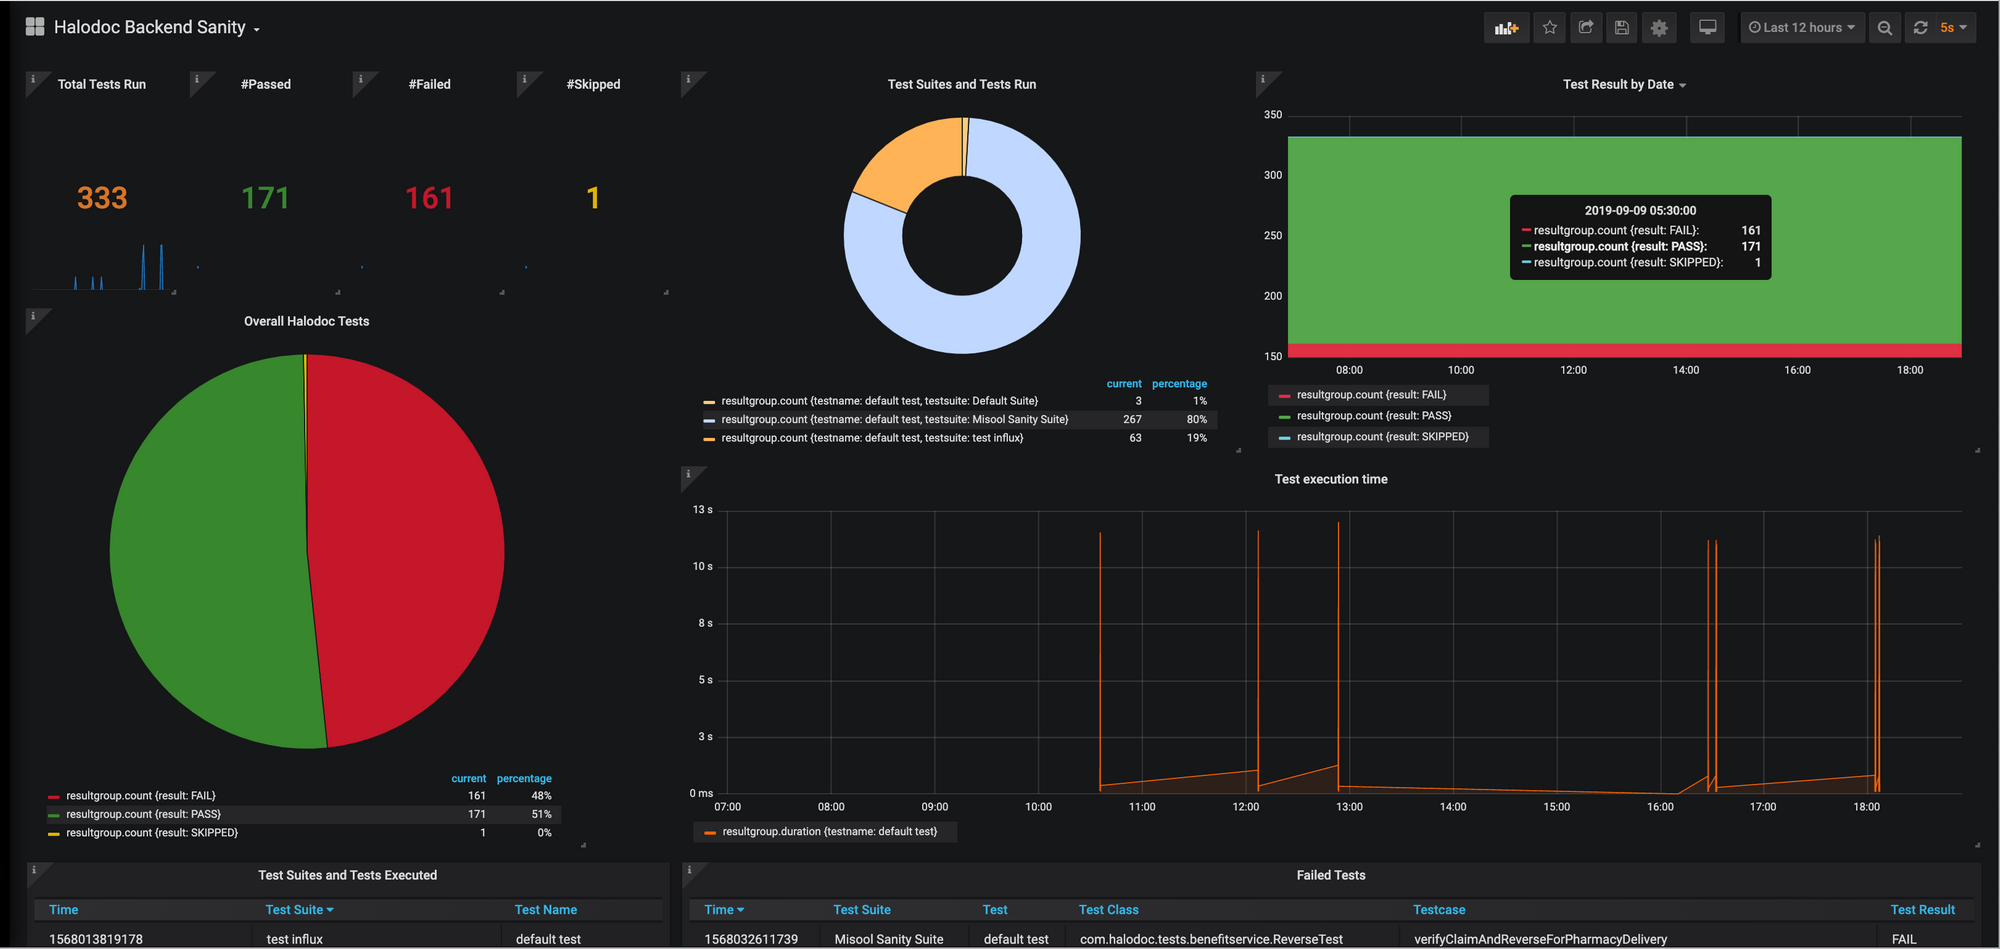
When we execute above suite xml, captured data are pushed and stored in inflixDB. We can create a dashboard on Grafana which pulls data from influxDB and displays it.
We made use of different panels that Grafana dashboard offers to display the metrics captured. Grafana offers different kinds of customised plugins. Based on our requirements, we can choose the ones that we like to use.
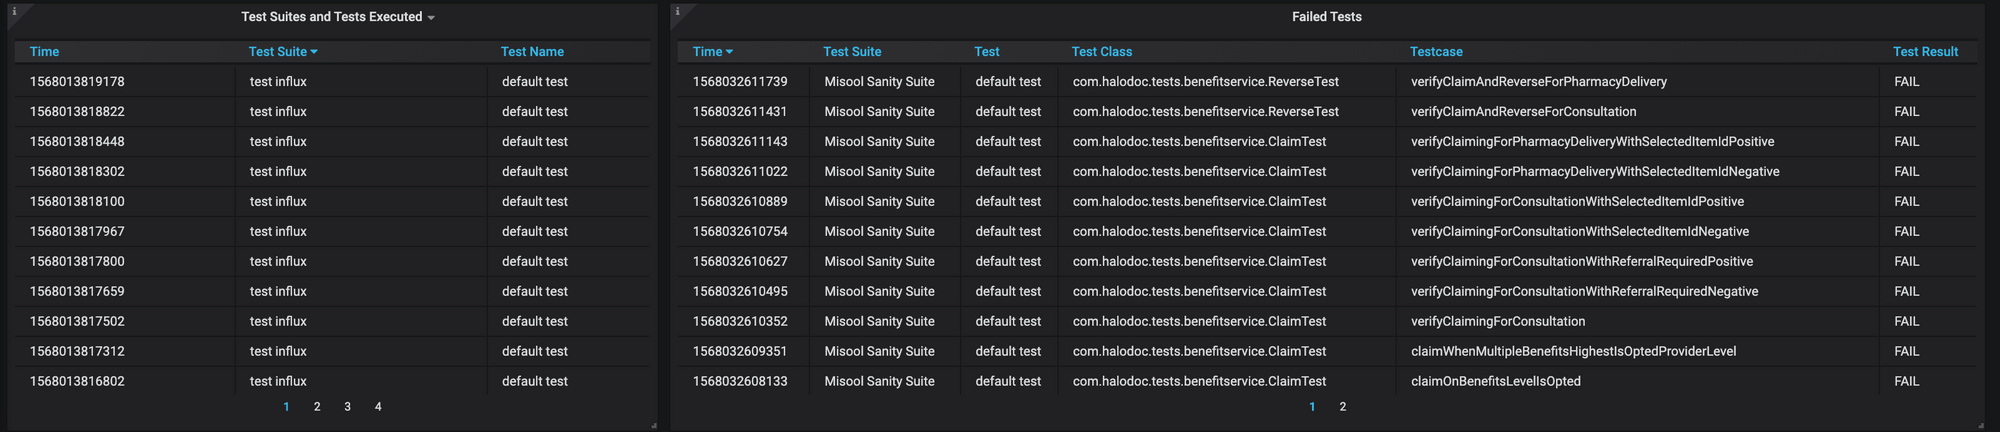
A sample snapshot of dashboard is captured below for reference.
Final notes
With this article we have tried to explain how TestNG listeners can be used to create customised graphical reports with the dashboard we created to track our automation progress and execution reports.
Join us
We are always looking out to hire for all roles in our tech team. If challenging problems that drive big impact enthral you, do reach out to us at careers.india@halodoc.com
About Halodoc
Halodoc is the number 1 all around Healthcare application in Indonesia. Our mission is to simplify and bring quality healthcare across Indonesia, from Sabang to Merauke.
We connect 20,000+ doctors with patients in need through our Tele-consultation service. We partner with 1500+ pharmacies in 50 cities to bring medicine to your doorstep. We've also partnered with Indonesia's largest lab provider to provide lab home services, and to top it off we have recently launched a premium appointment service that partners with 500+ hospitals that allows patients to book a doctor appointment inside our application.
We are extremely fortunate to be trusted by our investors, such as the Bill & Melinda Gates foundation, Singtel, UOB Ventures, Allianz, Gojek and many more. We recently closed our Series B round and In total have raised USD$100million for our mission.
Our team work tirelessly to make sure that we create the best healthcare solution personalised for all of our patient's needs, and are continuously on a path to simplify healthcare for Indonesia.