
Automation Strategies for Monitoring and Self-healing of Data Pipelines
Introduction
At Halodoc, we have adopted Lake House Architecture hosted on AWS to achieve a more scalable and flexible data platform to meet the requirements of a fast-growing business (an overview of our data lake architecture can be found in this blog post). The source data undergoes multiple processes from its raw state upon extraction and transformation into Hudi tables, which are modelled into a data warehouse and presented in reports that follow business logic to provide the single source of truth for analytics. All of these processes require different tools. Naturally, unexpected behaviours will occur, such as an unpredictable value for a column or changes in table partitions leading to stuck jobs. Due to the diversity of our data platform, it is challenging to identify them immediately. An unidentified error is a risk for our data delivery and might lead to an increase in cost.
As our data platform heads toward maturity, we have implemented multiple pipelines that will alert us or even fix the problems as soon as they arise. In this blog, we are showing some examples of how we use automation strategies in different data layers to improve our pipeline's reliability and cost management.
Raw Layer Monitoring: AWS Data Migration Service (DMS) Silent Errors
Background
The first layer of our data platform is the raw layer, where we capture transactional data from MySQL, Postgres, or NoSQL databases using change data capture (CDC). We utilise an AWS Data Migration Service (DMS) for ongoing replication or CDC. In DMS, we create incremental migration tasks for each database where each task contains more than one table. These incremental migration tasks read the binary logs (or binlog) of the source databases and format the data for the target data store. Binlogs are retained for around two weeks, so capturing the changes is time-sensitive.
Problem Statement
Previously, alerts were set for a whole migration task if it failed, and the table-level error would go unnoticed. Such errors, like changes in partitions and binlog read errors, might lead to missing data in the downstream processed and reporting layers that are difficult to explain and identify. As mentioned previously, the binlog of the source databases are only available temporarily, which means a failure to recover the data might lead to permanent data loss.
It is possible to retrieve the data using a full load, which copies it from the source database. However, this is a more expensive activity and if older data are archived, our data might be truncated.
Solution: Utilising AWS' APIs to Recognise Errors
Using boto3, the AWS SDK for Python, it is possible to configure and access AWS services. We use Airflow to schedule a regular job, which will send an alert to a Slack channel to notify the team about any error that occurs in the DMS task.
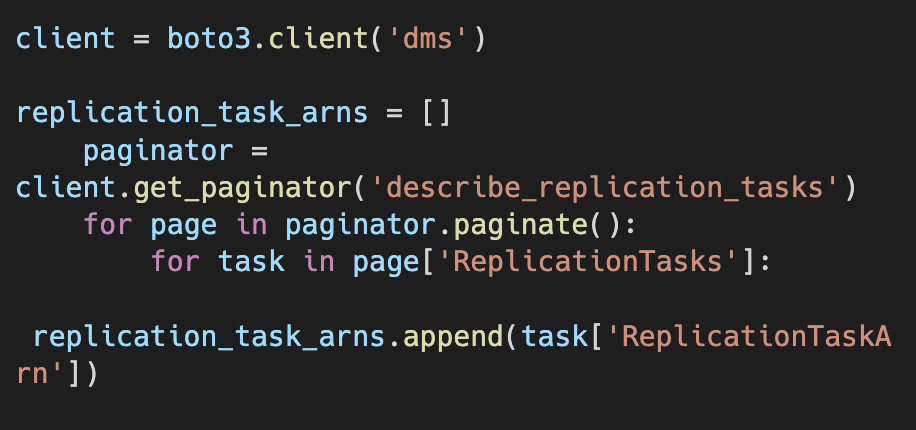
What the block of code above does:
- boto3.client: allows access to any AWS service, in this case DMS
- get_paginator: get values from every page (not limited to the restriction of the API)
- describe_replication_tasks: triggers the API that gets information from DMS tasks. The output from boto3 contains an elaborate dictionary of the task (an example is available in the AWS documentation).
- Output: A list of information about replication tasks in the current region of the account. We take the replication tasks' ARNs, or Amazon Resource Names, which are the unique identifiers of an Amazon resource. We use these identifiers to get more information on the specific tasks.
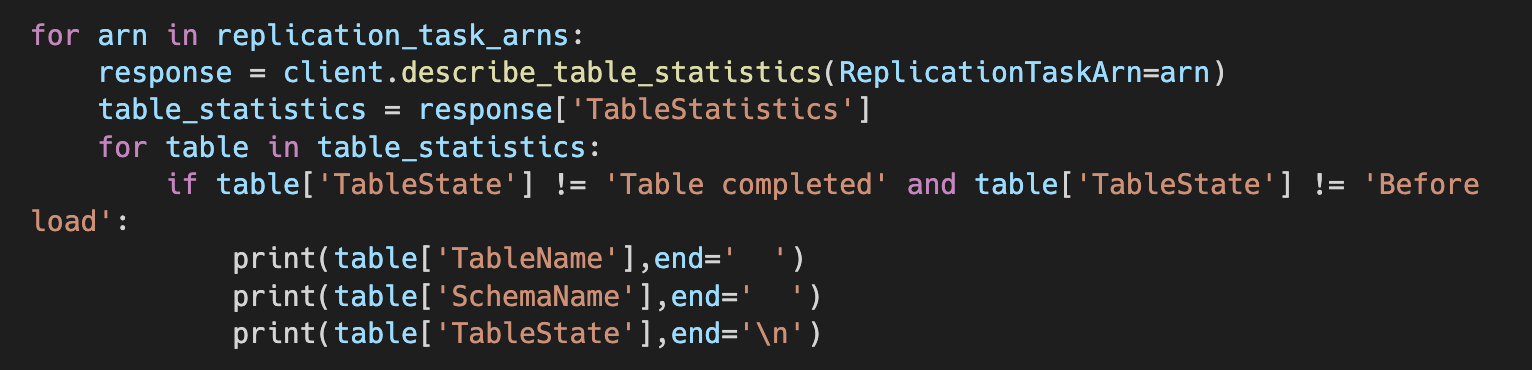
In this block of code, using the replication task ARNs, we get the TableStatistics, which contains various information about the table being migrated by the task, including schema name, table name, number of rows inserted, updated, and deleted, and so on.
The most relevant for this alert is the TableState value, which stores the state of the table. By filtering out tasks in completed or not started states, as shown in the image above, we can get tables that failed and send the schema name, table name and table state to Slack.
Using this alerting job, we have been able to identify errors and take action sooner.
Processing Layer Monitoring: Alerts and Auto-termination for AWS Elastic MapReduce (EMR) on EC2 and EKS Stuck Jobs
Background
EMR is an AWS managed cluster platform that we use to process raw data into processed tables optimised to create tables for business analysis and reporting in business intelligence tools. An EMR cluster consists of multiple compute instances, and we can configure and run our data processing jobs in Elastic Compute Cloud (EC2) directly or on Elastic Kubernetes Service (EKS) cluster (more thorough comparison between the two services in this blog post or this AWS documentation). In both cases, the billing is based on usage time and the type of instance used. Naturally, the cost will be higher if a job takes a long time to run.
Problem Statement
Despite setting an auto-termination policy, sometimes there are EMR jobs that are stuck, whether it is due to an error or if it is being used to run ad-hoc analyses or tests in Jupyter Notebook via EMR notebook. Some clusters even ran for days in an idle state, leading to an unexpected spike in EMR cost and skipping the next scheduled job.
Solution: Setting a Threshold and Monitoring using AWS' API
Similar to how we monitor the raw layer, we also use Airflow to schedule a regular monitoring job and boto3 to get information about the EMR clusters that are currently running.
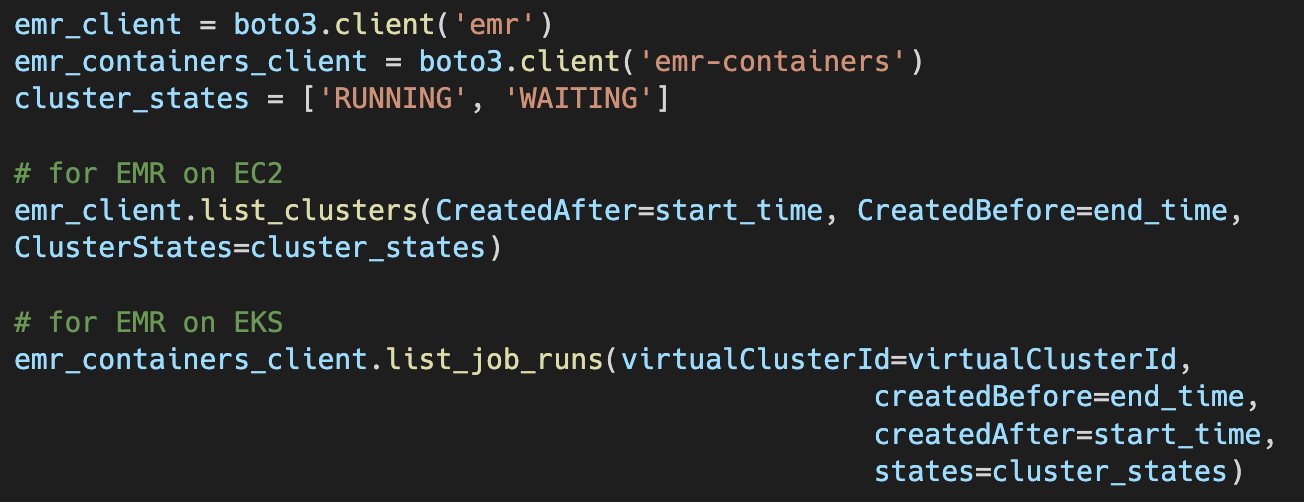
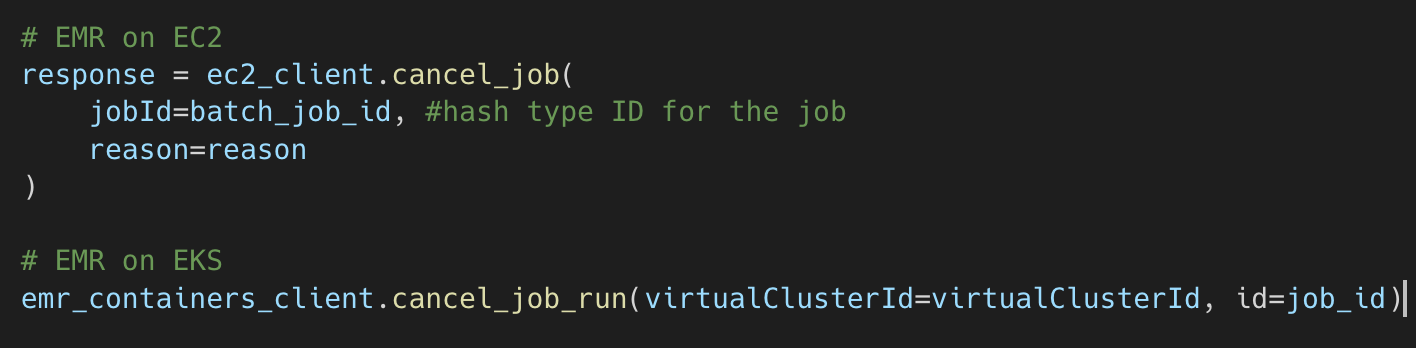
This code will return the details of all clusters (on EC2) or jobs (on EKS) that ran within the specified periods with the states of running or waiting / pending (idle). The cluster or job start time and end time are available in this output, and the duration of the cluster or job run can be calculated (more details of the output for this API call can be found here for EC2 and here for EKS). The code below returns a list of cluster or job IDs that our job will send in our alerts. The duration threshold that we set is 120 minutes. This number is based on the runtime of our current jobs, which run for 1 hour at most. A long-running job ID will be sent to a Slack channel, and because our jobs are idempotent, it can be killed and retried.
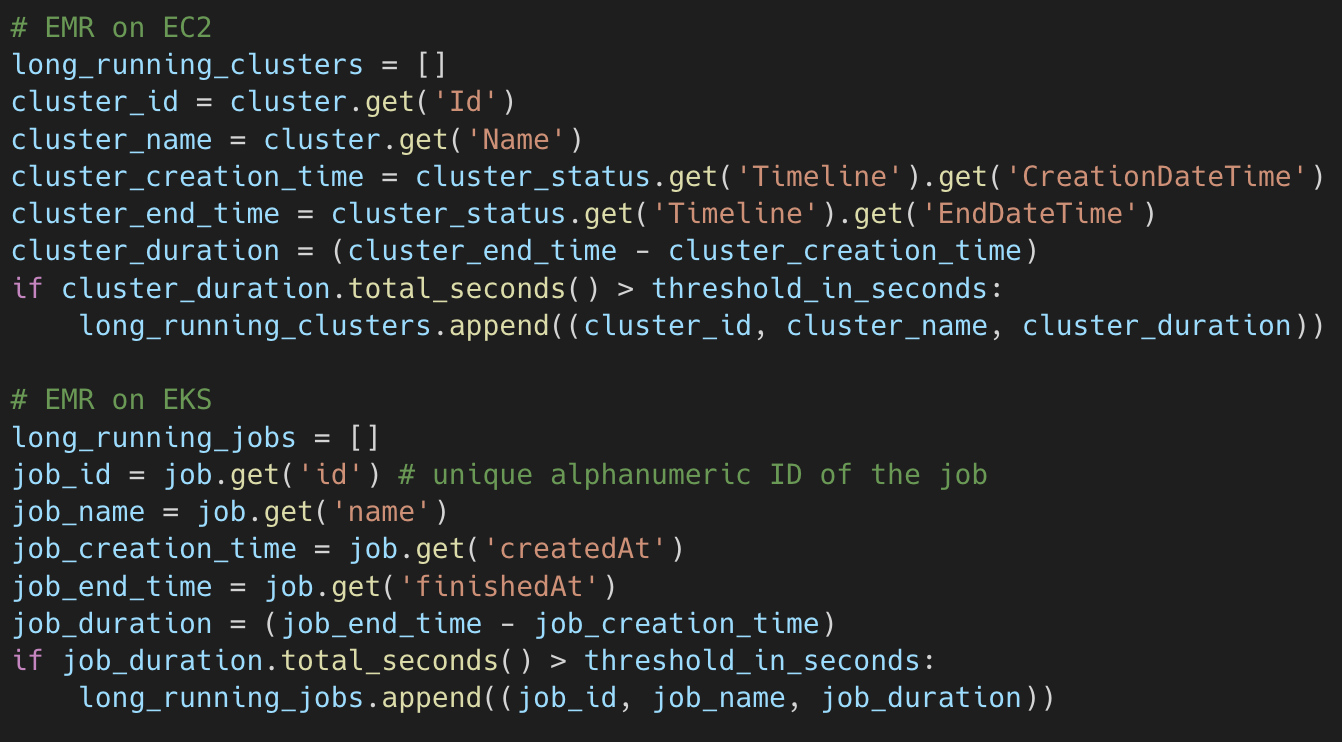
We have implemented auto-termination for EMR on EKS, which we use for most of our data processing job. We set a higher threshold of 180 minutes to make sure that it is most likely that there is no real job running.
Reporting Layer Monitoring: Self-healing Columns in Redshift Data Warehouse
Background
Two data layers exist in Redshift, the data warehouse, which consists of a dimensional model layer from processed layer data (stored in S3) and the presentation layer, which joins and applies business logic to data from the data warehouse. Because there is no upsert operation in Redshift, we do insert and truncate operations to update data in existing tables. Data is loaded incrementally according to the date filter and inserted into a stage table based on the target table. If the data exists in the target table, it will be truncated, and the newly updated data will be inserted into the target table.
Problem Statement
As a growing startup, there are a lot of new businesses and features, leading to new tables with sometimes unexpected values. This resulted in varchar length errors when the table's column length was not long enough for the data. It takes time and manual effort to solve this and it might delay the updates for our reports.
Unlike MySQL, Redshift's ALTER operation can only change the column length of a varchar type column. Changing other data types is more complicated and involves dropping and adding a new column with the correct data type, which will change the order of the column.
Solution: Capturing Error Message for Self-Healing Varchar Columns and Alerts
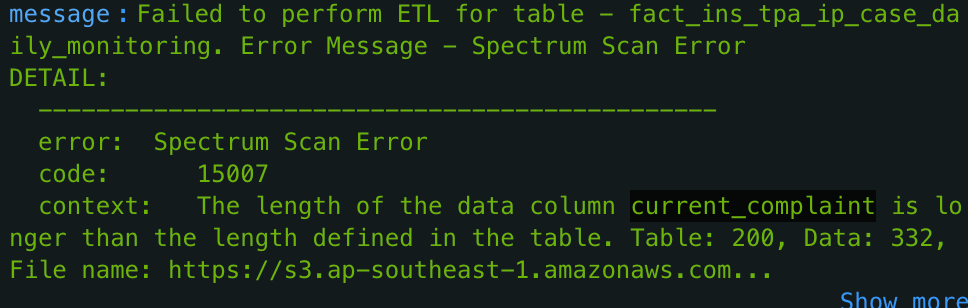
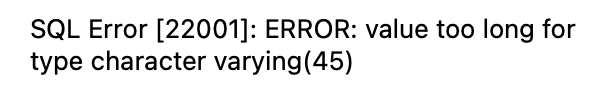
We insert data from S3 into Redshift using a COPY operation. Like the INSERT operation, COPY returns an error when there is a mismatch in data type. An advantage of using the COPY operation is when there is a varchar length error (i.e. target table is not long enough), it specifies the column in question and suggests a new column length, as shown in this example below.
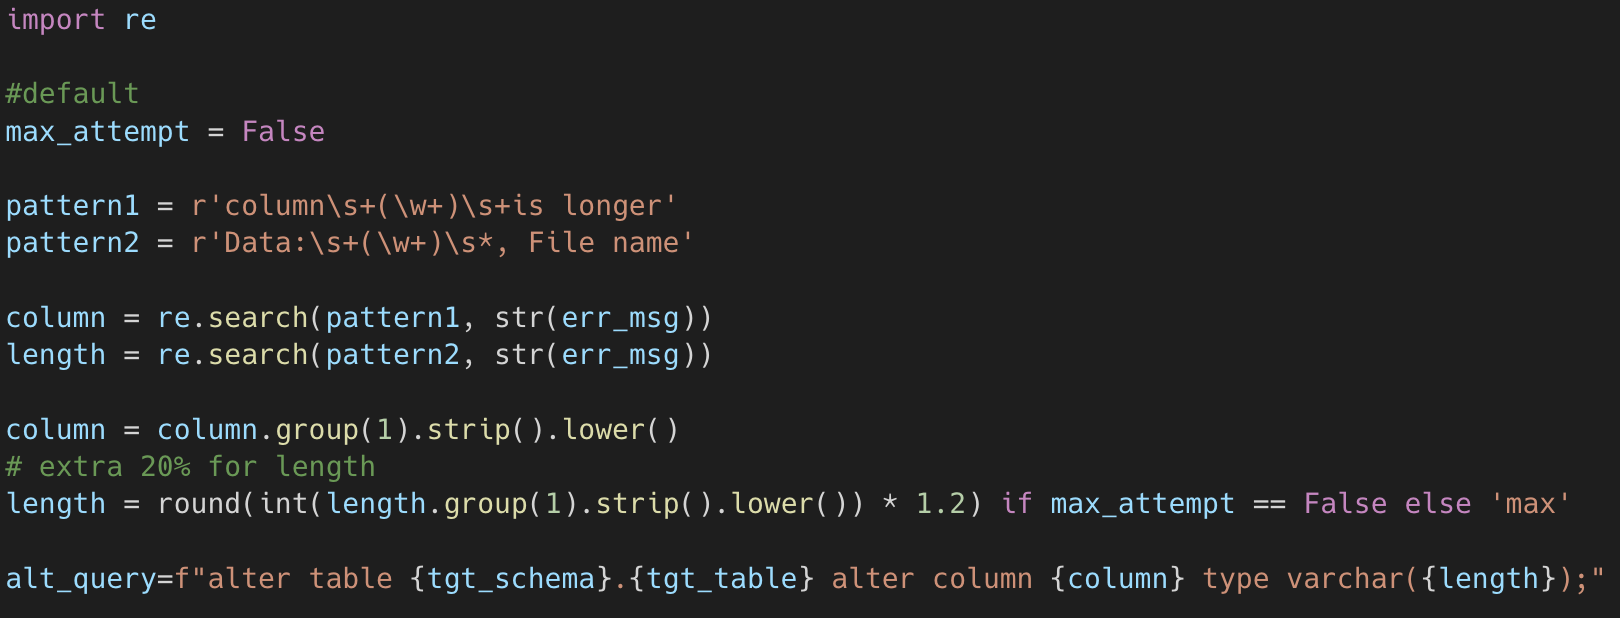
We use the column name and suggested column length from the error message to write an ALTER operation for that column as shown below. The code looks for the part of the error message that preludes and follows the information that we want. We give a buffer for the new column length just in case there is a longer value in a different partition file in the processed layer. The max_attempt variable limits the number of attempts in a try-catch block.
Any change made in the data warehouse must be reflected in the presentation layer. In the presentation layer, columns might be concatenated with other columns and we have to manually check if the length of that column needs to be altered. In addition, we do not have the column lineage to identify target columns. Because the change in the presentation layer is manual, the pipeline will alert us by sending an alert containing the ALTER operation done in the data warehouse.
Further Improvements
Raw Layer
- There is a possibility to automate the solution to an error in DMS in the case of binlog read error, which we have experienced when the database was upgraded.

- In most cases, we can restart the task from one day before. Boto3 can restart the task by using start_replication_task and setting the day to one day before to ensure complete recapturing of the missing data.
Reporting Layer
- Adding self-healing mechanisms for other errors.
Currently, this self-healing mechanism only includes varchar alteration. As mentioned previously, Redshift only allows for the alteration of column type string values. To alter a column to a different data type than the original one or the length of a decimal value, a new column with the desired data type would have to be added, which changes the order of the columns. Fortunately, our pipeline can handle the change in column order, so it is possible to automate other column alterations.
- Adding column lineage
Automating alteration in downstream tables can only be realised if there is a column lineage. Knowing the target columns in the presentation layer will reduce the manual work of looking for the relevant downstream columns. A Python library like sqllineage could help us achieve this. However, as mentioned previously, if the column is concatenated to other columns, the alter operation required might not be the same as the one executed in the previous layer.
Conclusion
Automations have helped our data platform to be more resilient, reliable, and cost-efficient. In the raw and processing layer, AWS APIs enable the automation of alerts and termination of clusters or jobs with unexpected behaviours. In the reporting layer, we incorporate information from error messages to a self-healing process.
References
- Halodoc infrastructure
- Amazon DMS
- Amazon DMS operation describe_replication_tasks
- Amazon DMS operation result TableStatistics
- Amazon EMR on EKS in Halodoc
- Amazon EMR on EKS
- Amazon Redshift ALTER TABLE
Join us
Scalability, reliability and maintainability are the three pillars that govern what we build at Halodoc Tech. We are actively looking for engineers at all levels and if solving hard problems with challenging requirements is your forte, please reach out to us with your resumé at careers.india@halodoc.com.
About Halodoc
Halodoc is the number 1 all around Healthcare application in Indonesia. Our mission is to simplify and bring quality healthcare across Indonesia, from Sabang to Merauke. We connect 20,000+ doctors with patients in need through our Tele-consultation service. We partner with 3500+ pharmacies in 100+ cities to bring medicine to your doorstep. We've also partnered with Indonesia's largest lab provider to provide lab home services, and to top it off we have recently launched a premium appointment service that partners with 500+ hospitals that allow patients to book a doctor appointment inside our application. We are extremely fortunate to be trusted by our investors, such as the Bill & Melinda Gates Foundation, Singtel, UOB Ventures, Allianz, GoJek, Astra, Temasek, and many more. We recently closed our Series D round and In total have raised around USD$100+ million for our mission. Our team works tirelessly to make sure that we create the best healthcare solution personalised for all of our patient's needs, and are continuously on a path to simplify healthcare for Indonesia.