
DataWarehouse’s Presentation Layer in Halodoc
At Halodoc, we have always been committed to simplifying healthcare for our end users and our ultimate goal is to excel as a data-driven organization.
In the previous blog, we explained how to process the data model adopted at Halodoc in the process zone to the report zone(fact and dim). In this blog, we will explain about the Presentation layer zone(PL).
What is the Presentation Layer Zone?
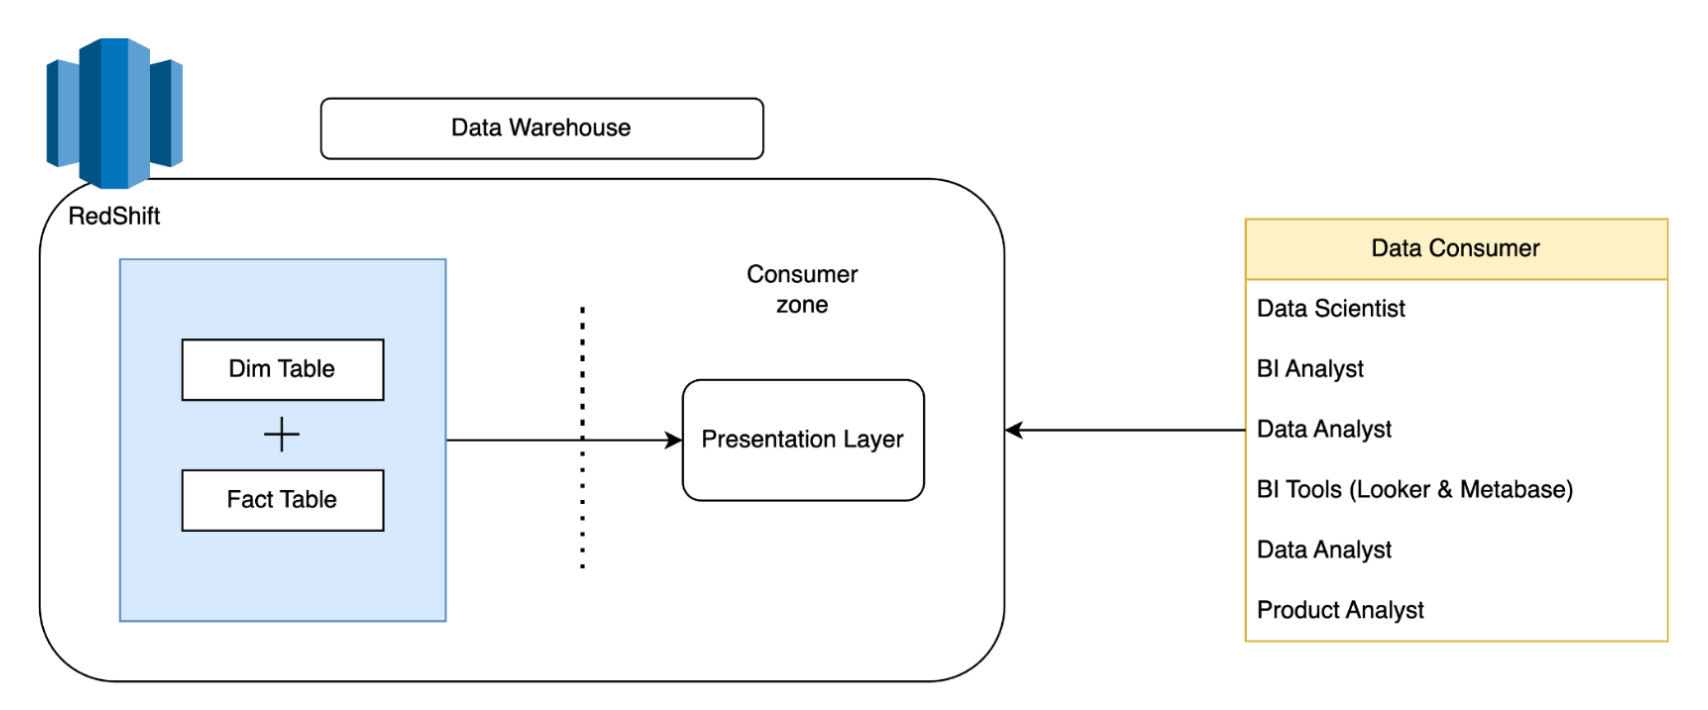
The presentation layer zone is the last layer of the data warehouse in Halodoc. The presentation layer zone is a table that is used for reporting data needs at Halodoc and used by data analysts to perform data analysis. Before we go into more detail, we will explain why we need this zone.
- To meet the very dynamic business needs of Halodoc, sometimes we are required to combine several fact tables. And if we do this process on BI tools, Linking two or more fact tables may require joining several multi-billion row tables which will make the CPU and memory on redshift work hard. If the CPU and memory on redshift work hard, we have to scale our Redshift cluster, which has a direct impact on redshift costs.
- With this zone, the analyst does not need to join tables that involve multiple-billion rows of facts. Analysts can only join the table presentation layer and dimension table with BI-tools(data visualization like metabase, looker, etc). So that the BI-tools still apply the star schema concept.
- The existence of this zone will also minimize query errors that cause distrust in reporting data. Because the process of manipulating the columns in the table and the aggregate columns in the table are in the presentation layer. It will make related data displayed in BI tools come from the same source.
Process of Designing and Developing the presentation layer :
Design Presentation Layer :
We already have a report zone that contains the fact and dimension tables. Examples of fact tables and dim tables.
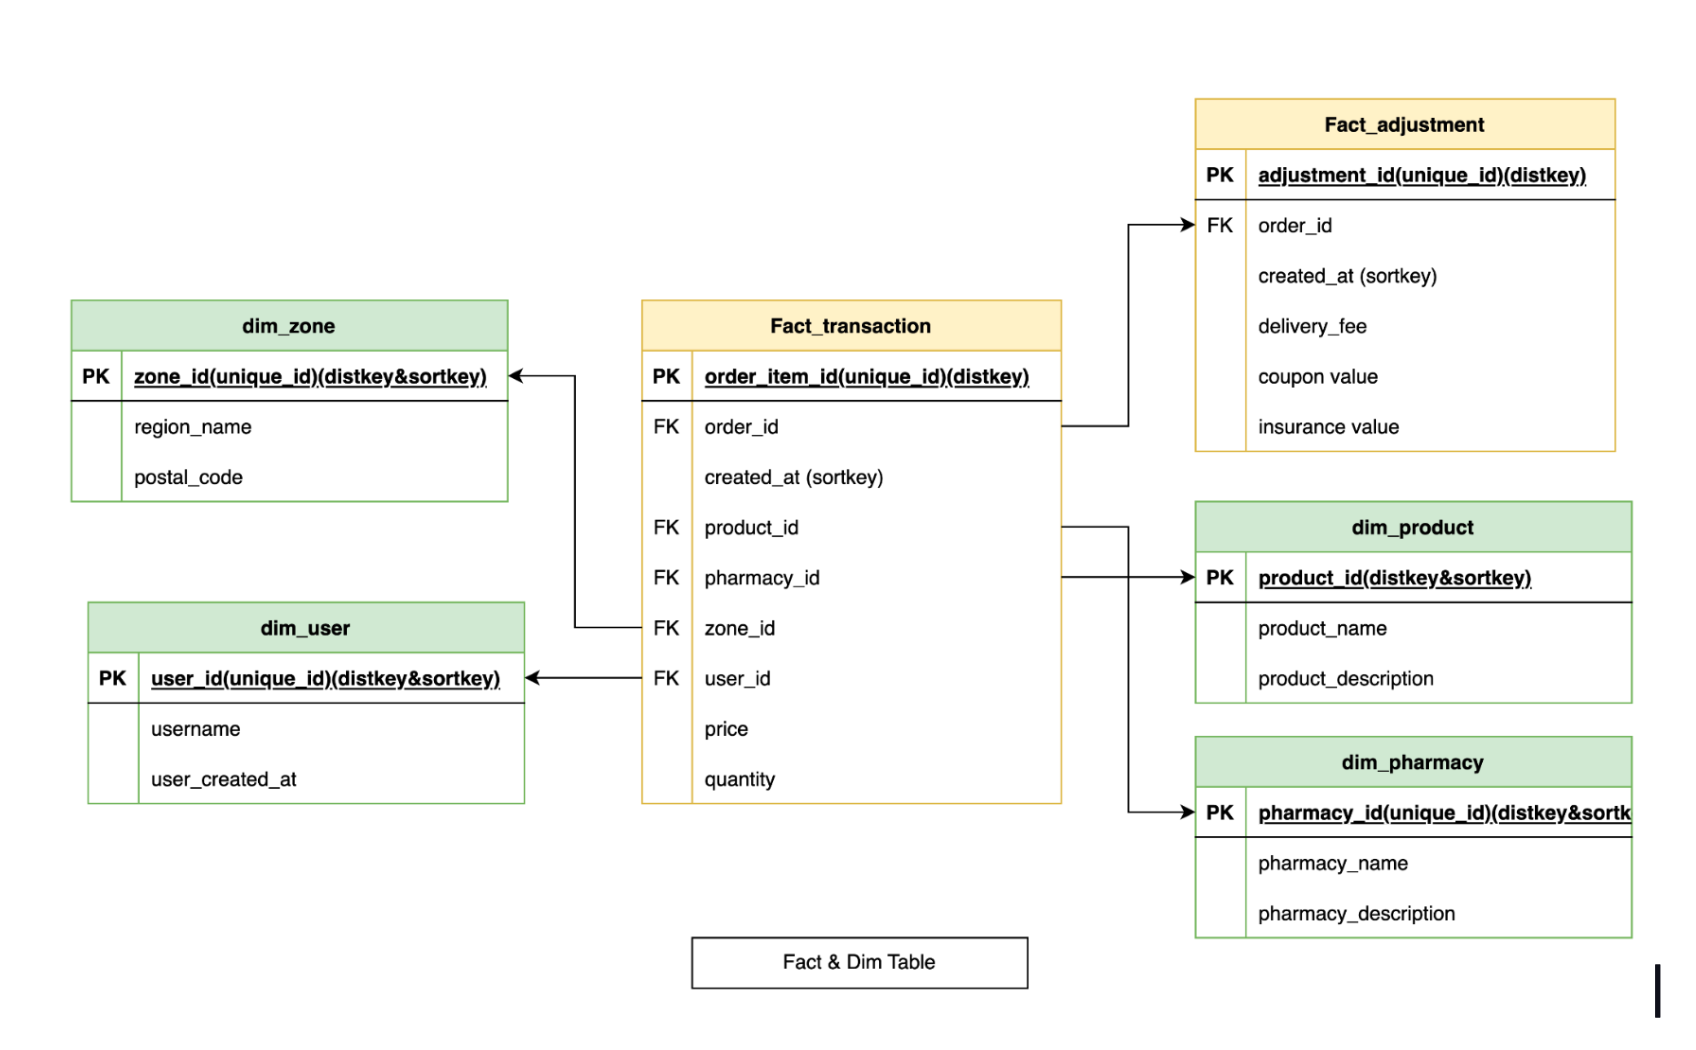
Here we can see that the need for reporting and analysis sometimes makes us need to join multiple fact tables. In the example above, if we join this table in the report zone, we will mess up the granularity of the fact table. Because this order_id is not 1 to 1. Below we will show what the presentation layer looks like that we developed from the example table above.
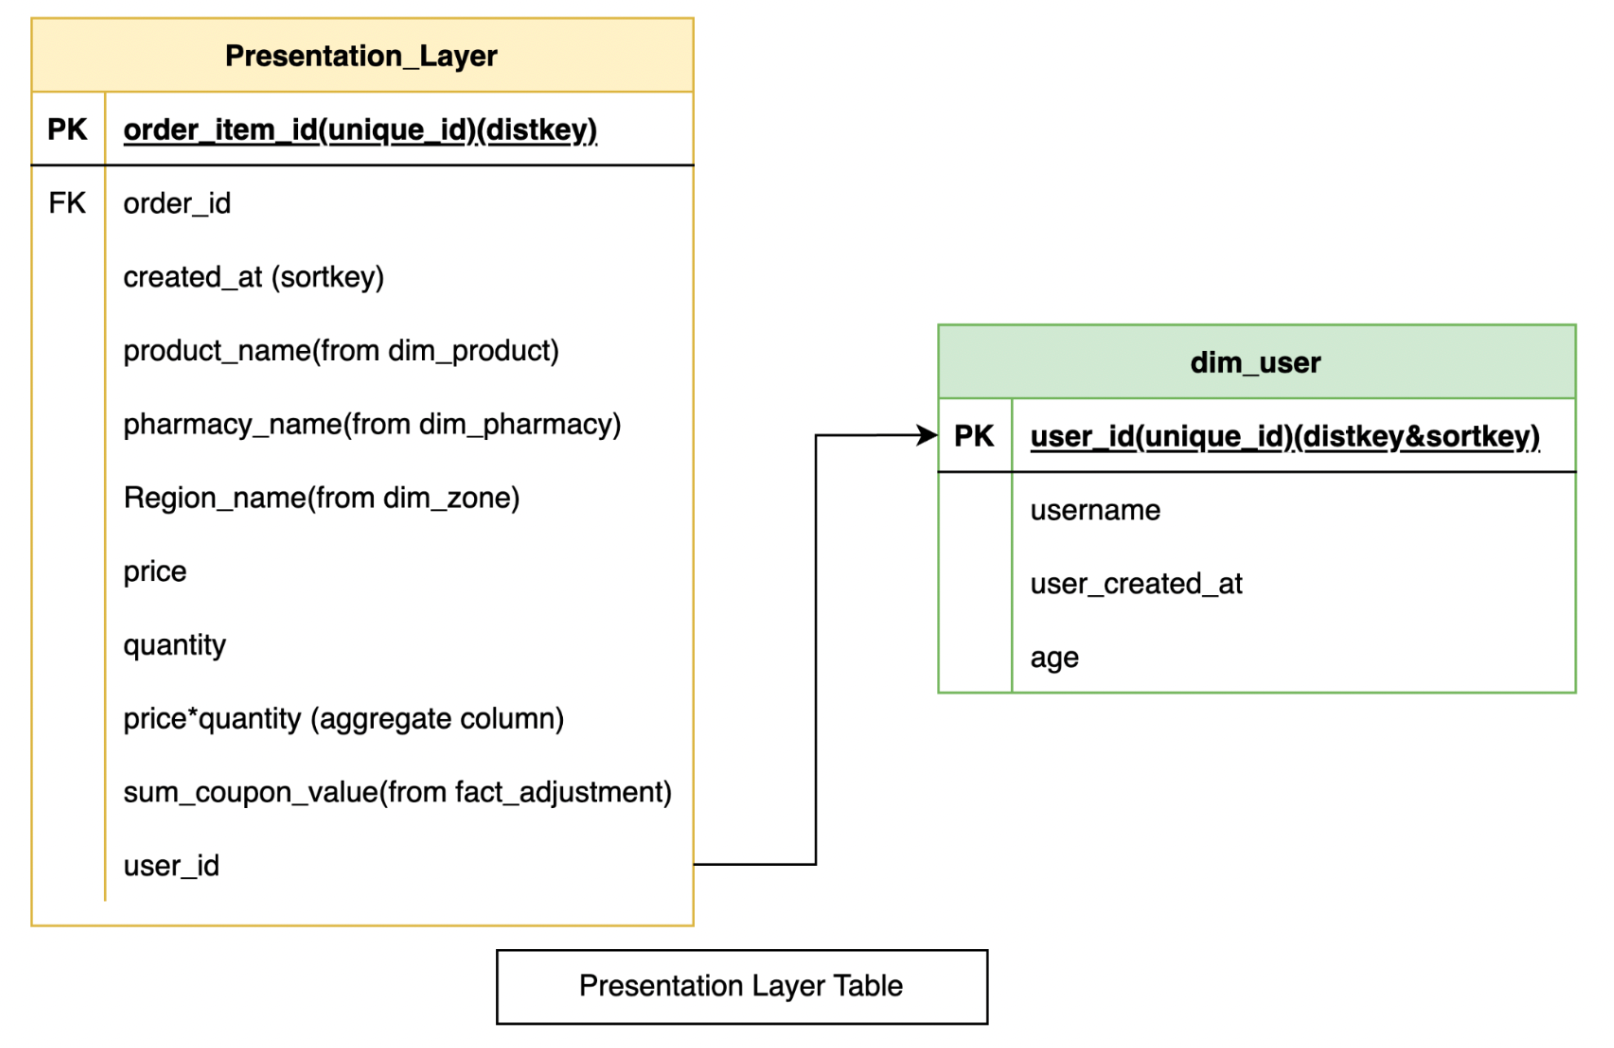
In the picture above, the presentation layer is the result of a joining between the fact table and the dim table. Because a fact table is a table with minimum data transformation, therefore in the presentation layer we also perform data transformations such as aggregate data, data manipulation, etc. In the example above, you can see that we allow a table join between the presentation layer and the dim table in BI tools. Because the presentation layer still applies the star schema concept, we allow analysts to join the presentation layer table and the dim table.
Develop presentation layer :
Based on the previous blog, it has been explained how the process of developing fact tables and dim tables.
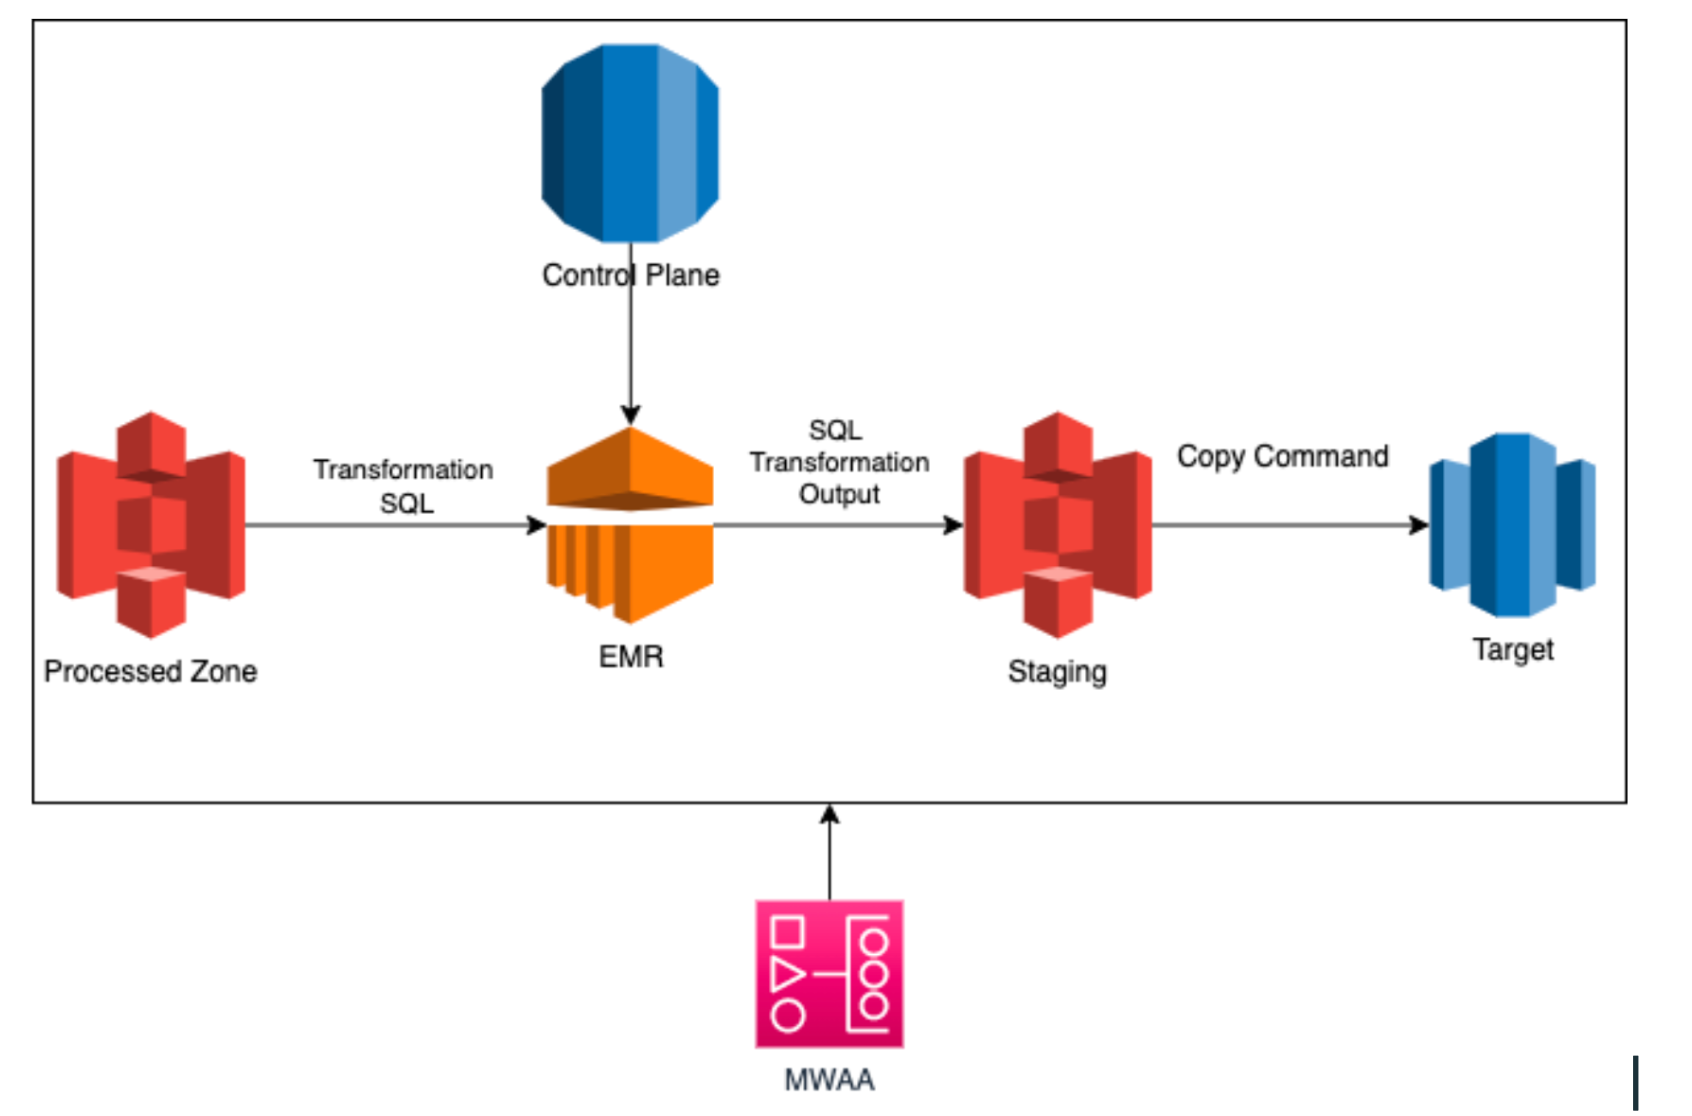
Based on the previous blog , it has been explained how the process of developing fact tables and dim tables. In the developing presentation layer process, we use almost the same method. The difference is we don't use Spark and hence we don't need EMR.
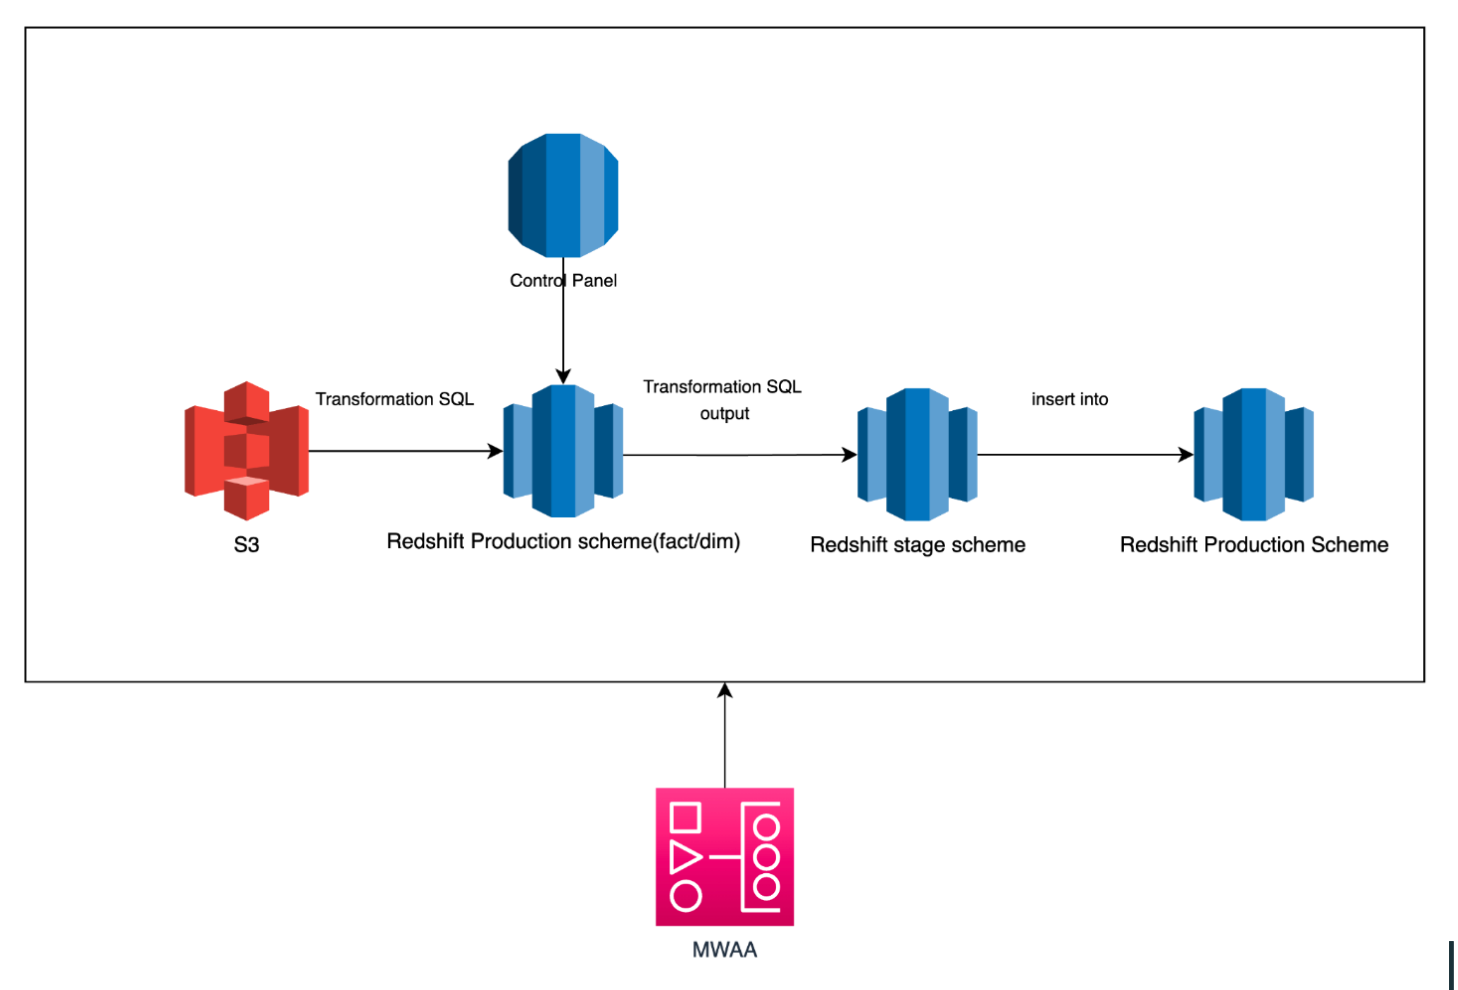
On the PL we use RedShift, RDS, S3, and Amazon Managed Workflows for Apache Airflow (MWAA).
- Redshift : run transformation query in RedShift production scheme, insert ouput to stage scheme RedShift , and insert into RedShift production scheme.
- S3 : Place to store transformation query
- MWAA : To orchestrate the pipeline
- RDS : Control Panel
So, the PL is managed in the RedShift environment.
Pros & cons
Pros :
- Presenting the results of the join between the fact tables.
- Managed in the RedShift environment.
- Single source of truth for related data when used in bi tools.
- Reduce the join table when used.
- Doesn't need transformation like case when,aggregate column, or other sql function in bi tools. Easy to use for analysts (only use select and from).
- Cost efficiency on RedShift because there's no hard process from BI tools.
Cons :
- Need to pay attention to the schedule of the table report zone that is called in the presentation layer. Solution We need to create data lineage.
- The data warehouse engineer will maintain many presentation layer tables.
Summary :
The presentation layer will greatly facilitate analysts in the process of creating reporting on BI tools and performing analysis. The presentation layer can also be a single source of truth for related data. The presentation layer also has an impact on cost efficiency because BI tools can only access the presentation layer and do not perform transformations. But the data warehouse engineer needs to be careful in choosing the schedule for the presentation layer updates, because the resulting data has a very high dependency on the fact table or dim table.
Join us
Scalability, reliability and maintainability are the three pillars that govern what we build at Halodoc Tech. We are actively looking for engineers and analyst at all levels and if solving hard problems with challenging requirements is your forte, check Halodoc's Career Page here. About Halodoc Halodoc is the number 1 all around Healthcare application in Indonesia. Our mission is to simplify and bring quality healthcare across Indonesia, from Sabang to Merauke. We connect 20,000+ doctors with patients in need through our Tele-consultation service. We partner with 3500+ pharmacies in 100+ cities to bring medicine to your doorstep. We've also partnered with Indonesia's largest lab provider to provide lab home services, and to top it off we have recently launched a premium appointment service that partners with 500+ hospitals that allow patients to book a doctor appointment inside our application. We are extremely fortunate to be trusted by our investors, such as the Bill & Melinda Gates Foundation, Singtel, UOB Ventures, Allianz, GoJek, Astra, Temasek and many more. We recently closed our Series C round and In total have raised around USD$180 million for our mission. Our team works tirelessly to make sure that we create the best healthcare solution personalised for all of our patient's needs, and are continuously on a path to simplify healthcare for Indonesia.