Driving Efficiency and Performance: Zabbix Implementation for Network Monitoring
Introduction
Effective network monitoring plays a crucial role in ensuring optimal system performance and timely issue resolution. Currently, Halodoc has implemented Zabbix, a powerful open-source platform with comprehensive capabilities for real-time network monitoring, alerting, and performance visualization. In this blog, we will explore how Halodoc's adoption of Zabbix has successfully improved the efficiency and effectiveness of our network management. With the primary goal of optimizing network performance and accelerating issue resolution, Halodoc leverages Zabbix as a reliable and innovative solution.
What is Zabbix?
Zabbix is an open-source network monitoring and management platform that offers comprehensive solutions for monitoring the performance and availability of various IT infrastructure components. It provides real-time monitoring, alerting, and visualization capabilities, enabling businesses to proactively manage networks. Zabbix supports a wide range of devices, including servers, routers, switches, and applications, making it a versatile solution for organizations of all sizes.
How does Zabbix work?
Zabbix works by collecting data from various devices and systems within a network, analyzing that data, and providing real-time monitoring and alerting capabilities. Here is a simplified explanation of how Zabbix functions:
- Data Collection: Zabbix uses agents, which are small software modules installed on the devices to be monitored (such as servers, routers, and switches). These agents collect relevant data, such as system metrics, network traffic, and application performance, from the devices. Additionally, Zabbix can also collect data using agentless methods like SNMP (Simple Network Management Protocol) and IPMI (Intelligent Platform Management Interface).
- Data Processing: The collected data is sent to the Zabbix server for processing and analysis. The server aggregates and stores the data in a database for future reference and analysis. Zabbix also supports distributed monitoring through the use of Zabbix proxies, which can be deployed in remote locations to collect and forward data to the central server.
- Monitoring and Triggers: Zabbix continuously monitors the collected data in real-time. It compares the data against predefined thresholds and rules set by administrators. These thresholds define the acceptable range of values for specific metrics. If a metric exceeds or falls below the defined threshold, Zabbix triggers an event.
- Alerting and Notifications: When an event is triggered, Zabbix generates alerts and notifications. It can send notifications via various channels such as email, SMS, instant messaging, or custom scripts. Administrators can configure different notification actions based on the severity of the event, ensuring that the right people are informed promptly.
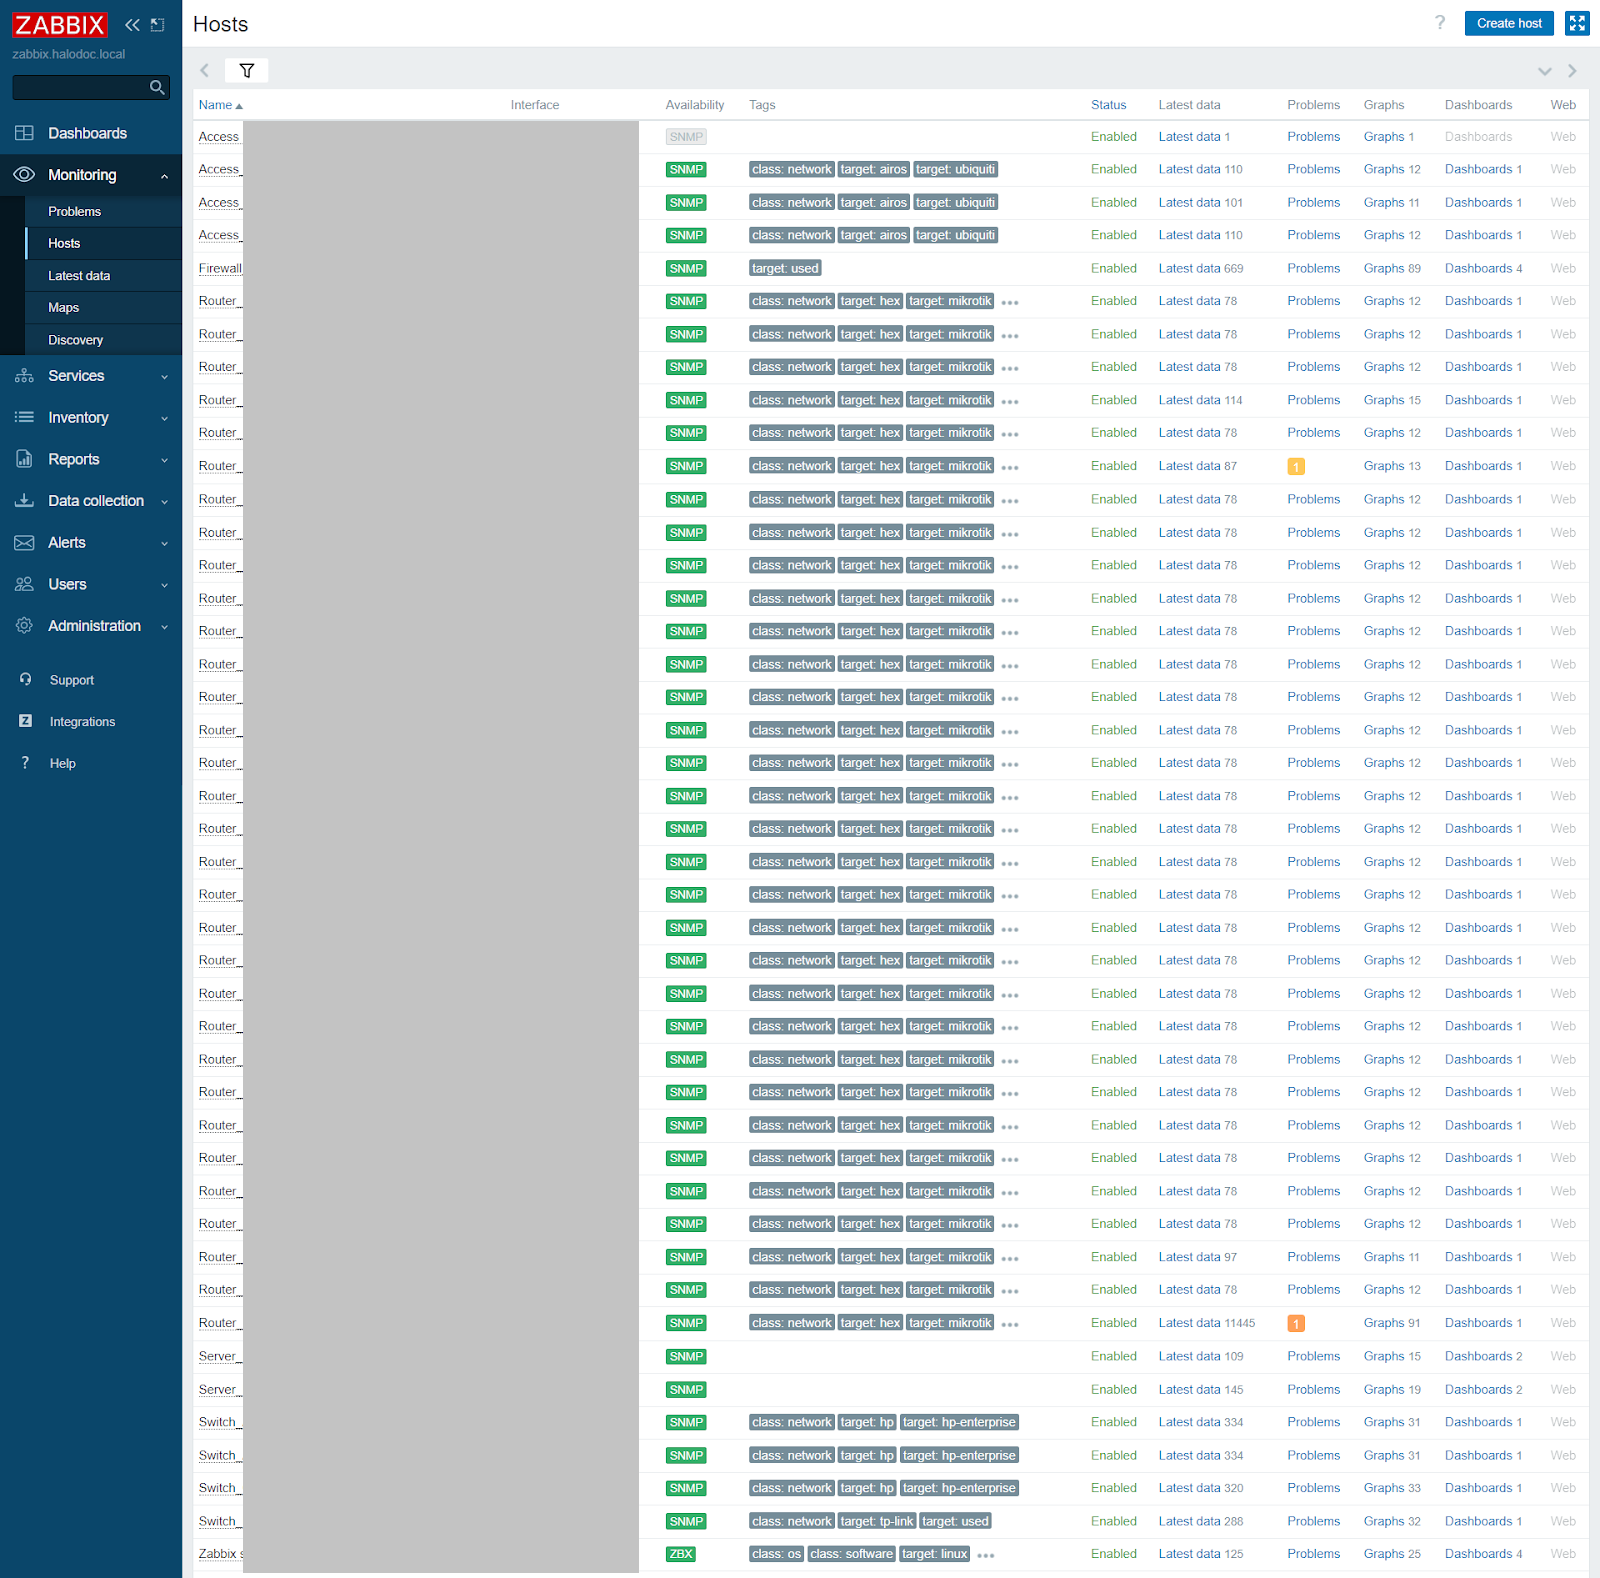
- Visualization and Reporting: Zabbix provides a user-friendly web interface where administrators can create customized dashboards, graphs, and reports to visualize the collected data. These visual representations help in identifying trends, analyzing historical data, and gaining insights into the network's performance and health.
Advantages and Challenges of Zabbix
Implementing Zabbix for network monitoring brings several its own set of advantages and disadvantages:
Advantages:
- Open-source nature: Zabbix is free to use, eliminating licensing costs and allowing organizations to invest resources elsewhere.
- Active community: Zabbix has a large and active user community, providing access to extensive resources, support, and knowledge sharing.
- Flexibility: Zabbix's flexibility allows it to adapt to diverse network environments, making it suitable for businesses with complex infrastructures.
- Customization: Zabbix allows to create custom monitoring templates, rules, and notifications to align with specific requirements.
Challenges:
- Resource-Intensive: Zabbix can consume significant server resources, especially when monitoring a large number of devices and collecting a vast amount of data. Proper hardware planning and performance tuning may be necessary.
- Maintenance Overhead: Regular maintenance, such as database cleanup and software updates, is necessary to keep Zabbix running smoothly. Neglecting maintenance tasks can lead to performance issues over time.
Process of Implementing Zabbix at Halodoc
Halodoc's transition from PRTG to Zabbix involved a structured implementation process. The steps undertaken included:
- Requirements: Designed the necessary requirements, including Zabbix Hardware, Software, databases, and specific needs.
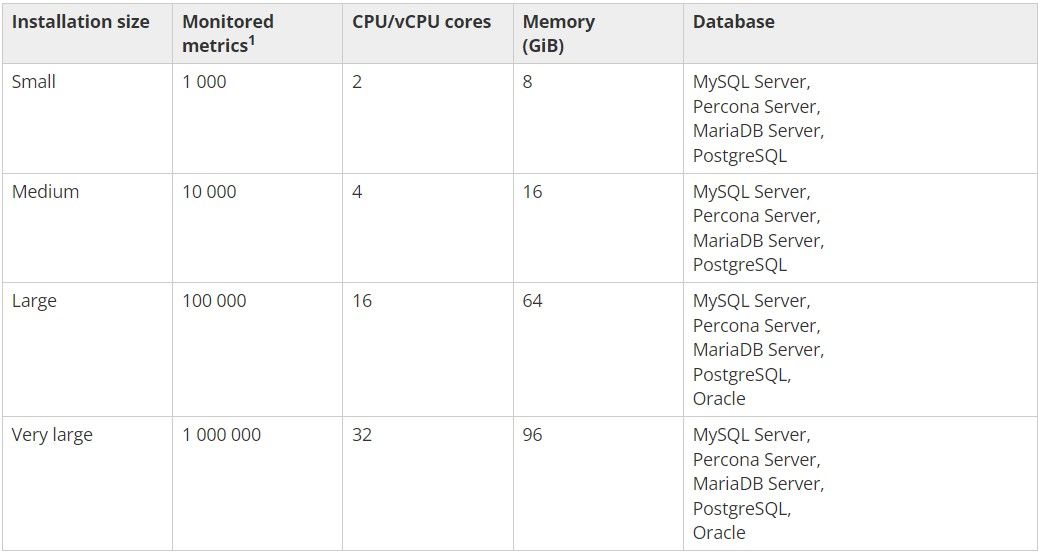
- Hardware configuration
The table provides examples of hardware configuration, assuming a Linux/BSD/Unix platform.
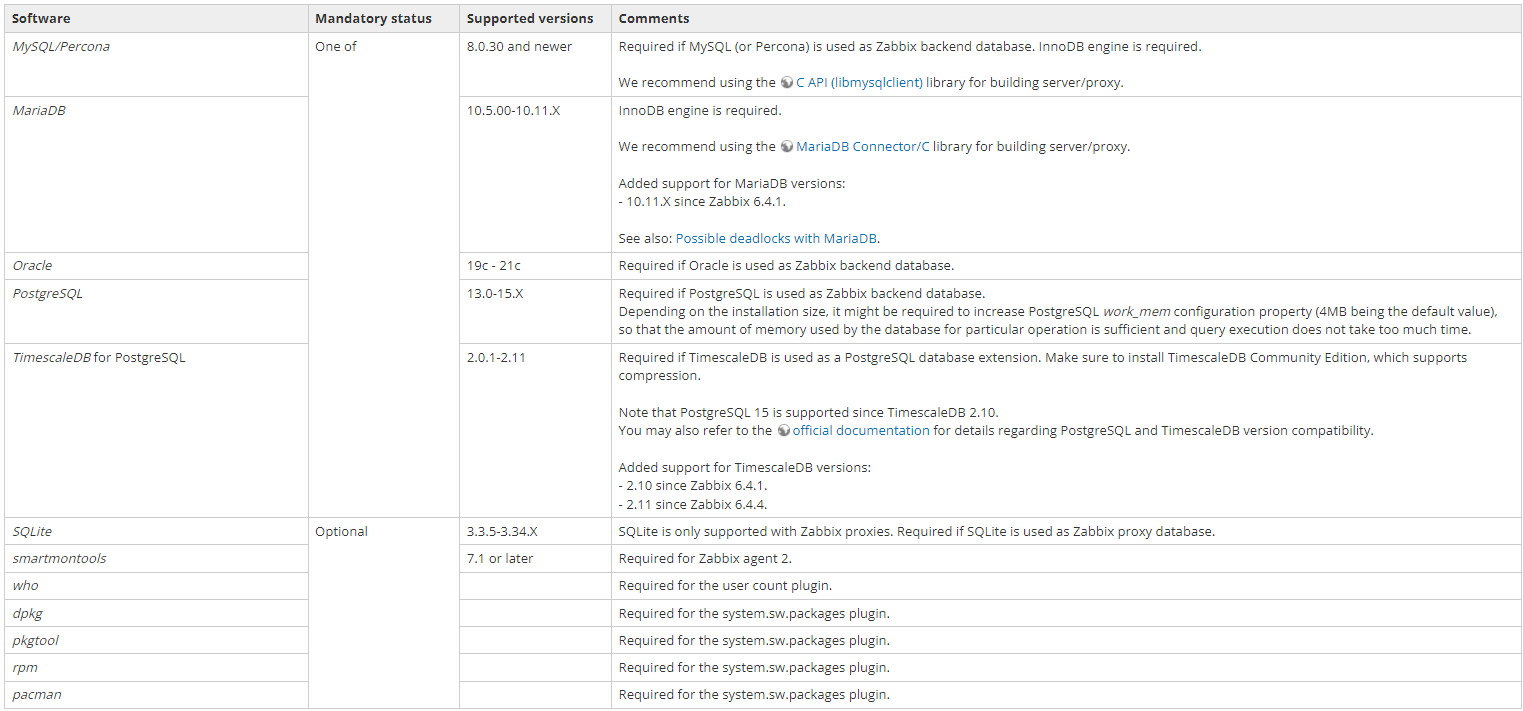
- Required software
Mandatory requirements are always needed. Optional requirements are needed for the support of the specific function.
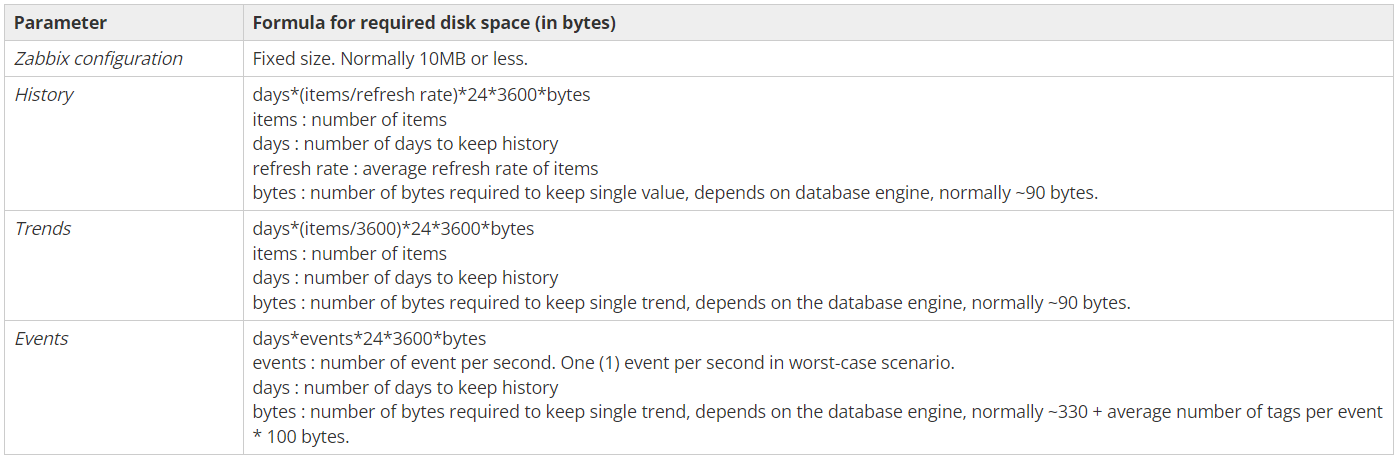
- Database size
The table contains formulas that can be used to calculate the disk space required for the Zabbix system.
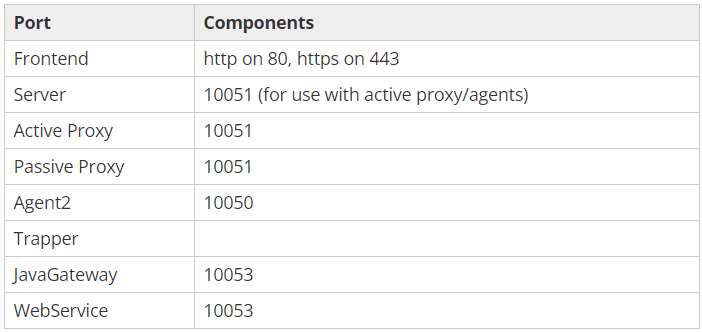
- Network requirements
The following list of open ports per component is applicable for default configuration.
- Installation and Configuration: configured Zabbix according to monitoring requirements, creating rules, fine-tuning settings, and setting up notifications.
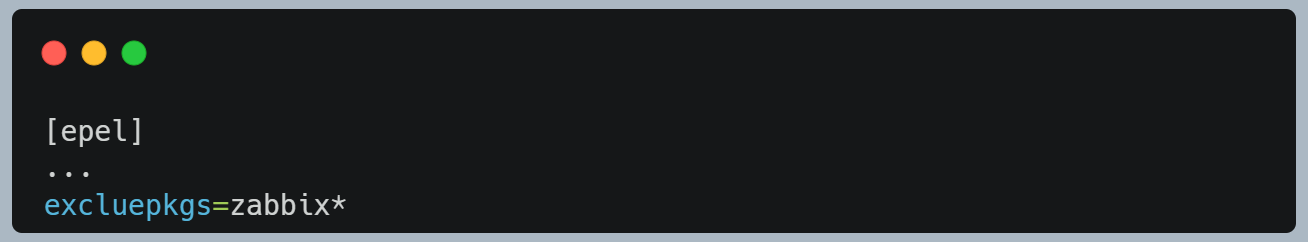
- Install Zabbix repository
Disable Zabbix packages provided by EPEL, Edit file /etc/yum.repos.d/epel.repo and add the following statement.
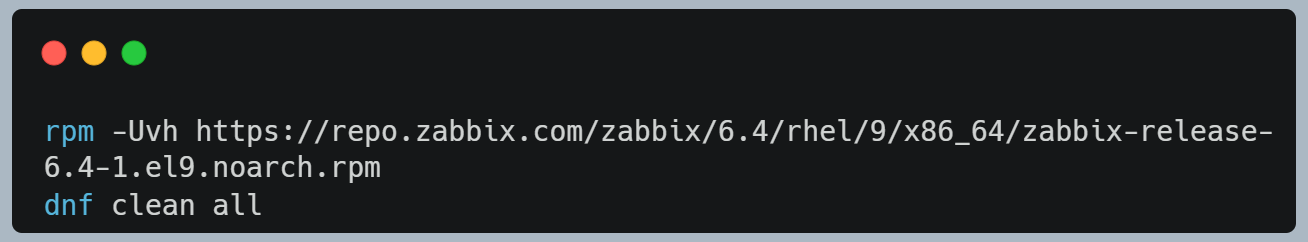
- Proceed with installing the zabbix repository
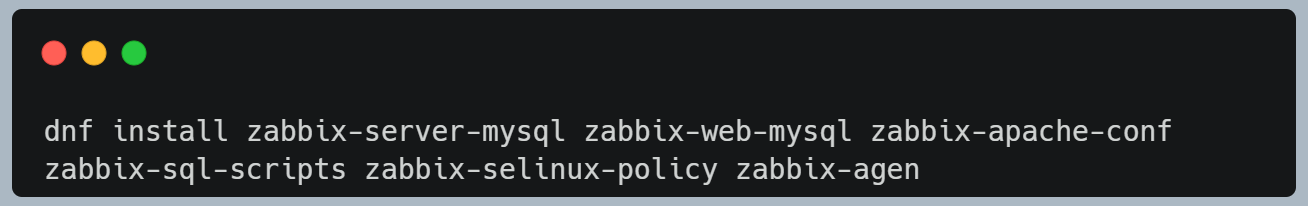
- Install Zabbix server, frontend
- Create initial database
Make sure the database server is up and running. Run the following on the database host.
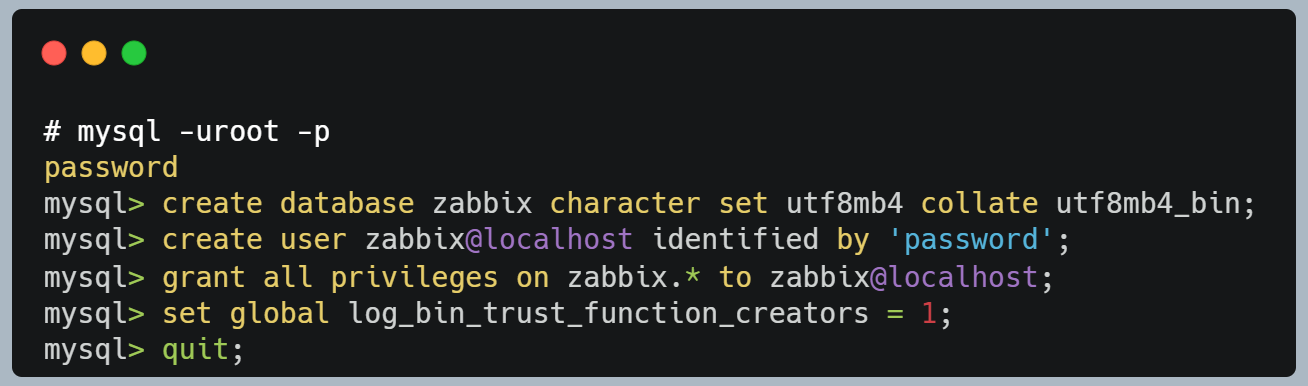
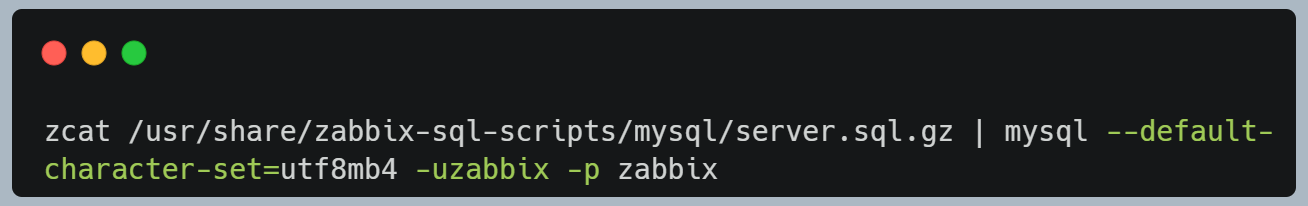
On the Zabbix server host imports initial schema and data. will be prompted to enter newly created password.
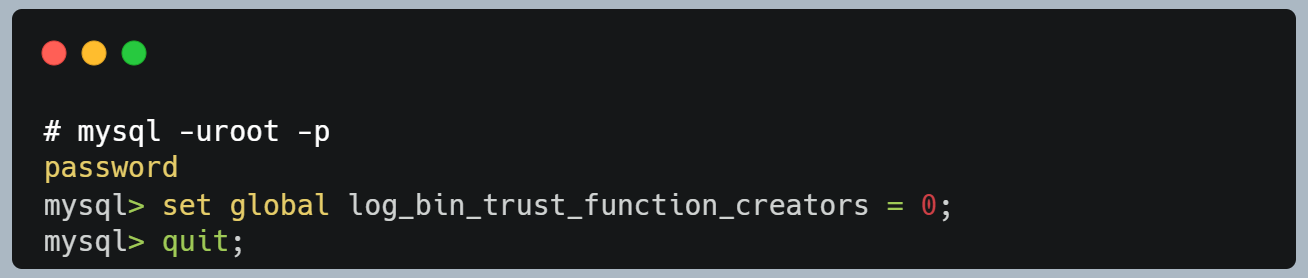
Disable log_bin_trust_function_creators option after importing database schema.
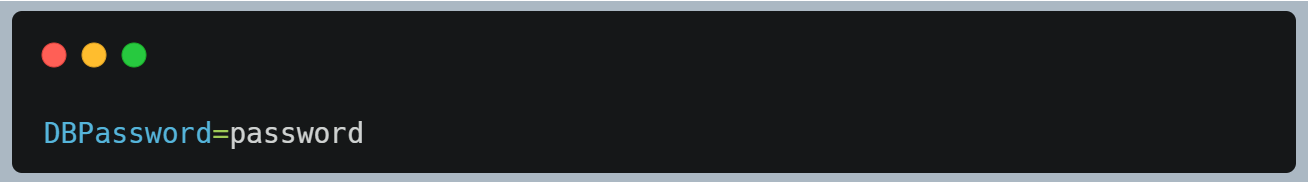
- Configure the database for Zabbix server
Edit file /etc/zabbix/zabbix_server.conf
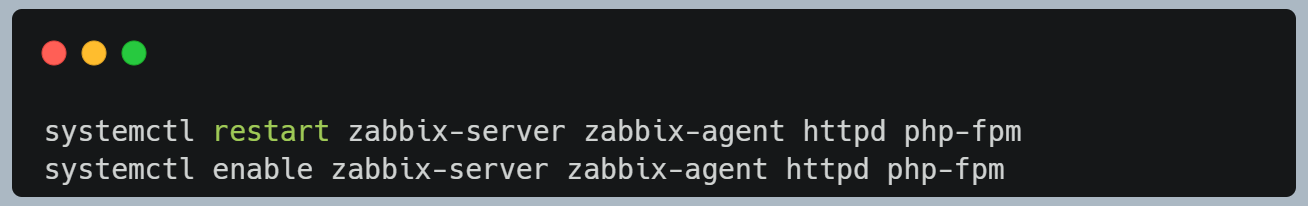
- Start Zabbix server and agent processes
Start Zabbix server and agent processes and make it start at system boot
- Data Migration: Existing network monitoring settings, including devices, sensors, and configurations.
- Integration for alerts:
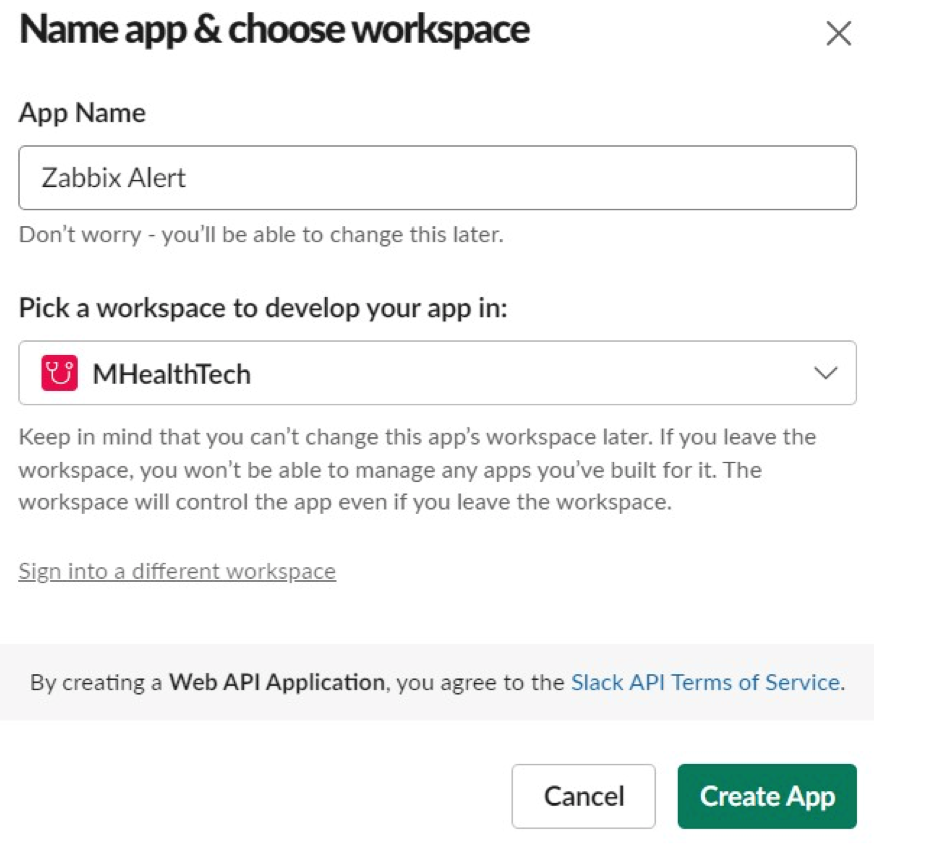
# Setting up a Slack bot
- On the page Your Slack API Application, press Create an App
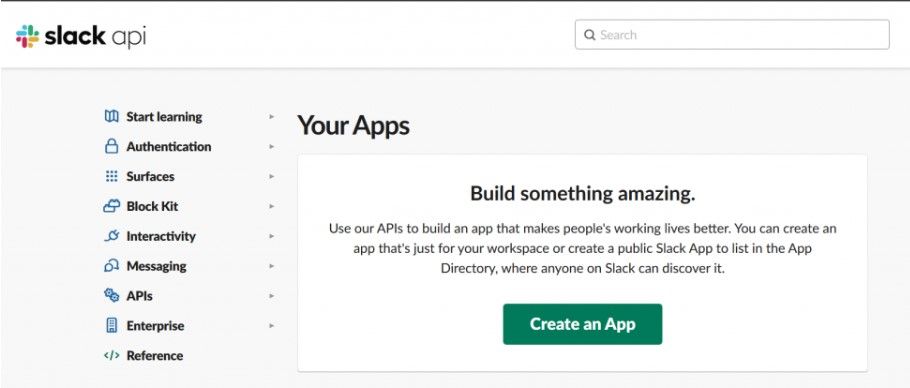
- On the page Slack API Application, press Create an App
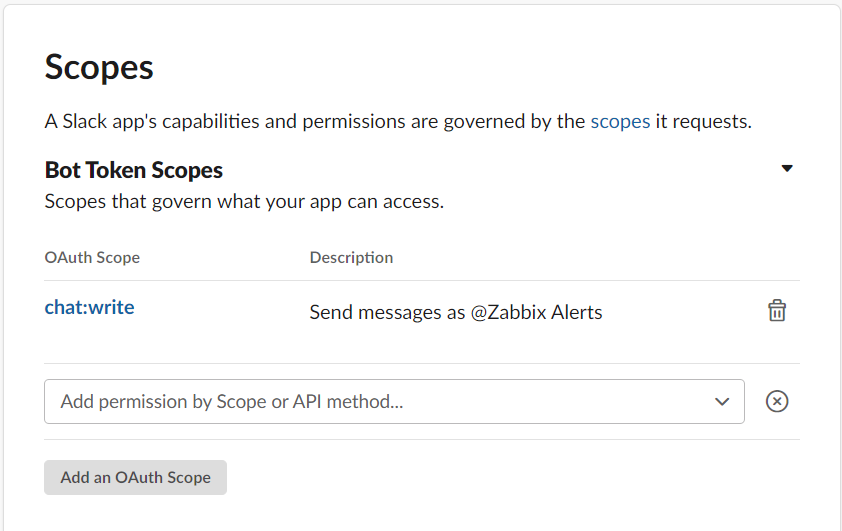
- In the Scopes section, find Bot Token Scopes, press Add an OAuth Scope and add chat:write scopes.
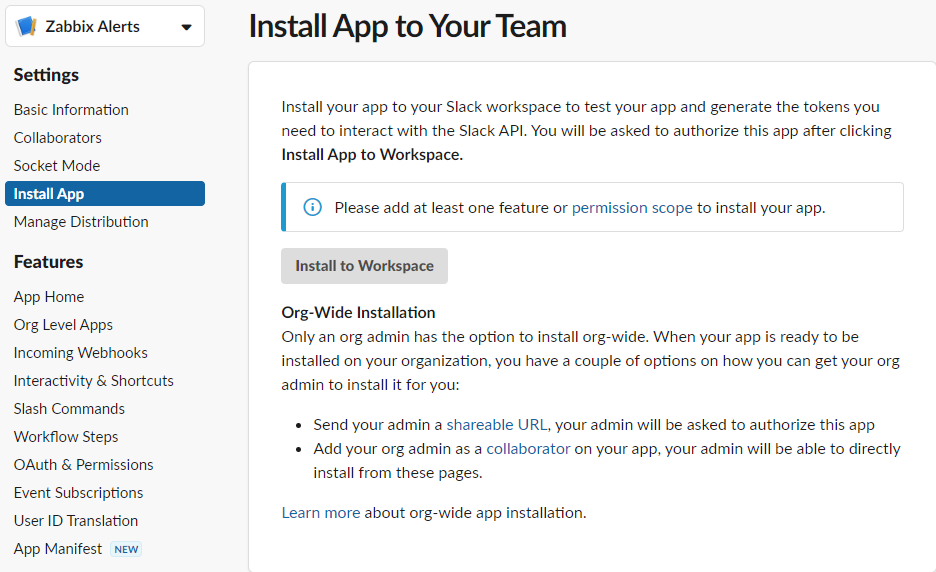
- In the Settings section on the left side of the page press Install App and then Install to Workspace.
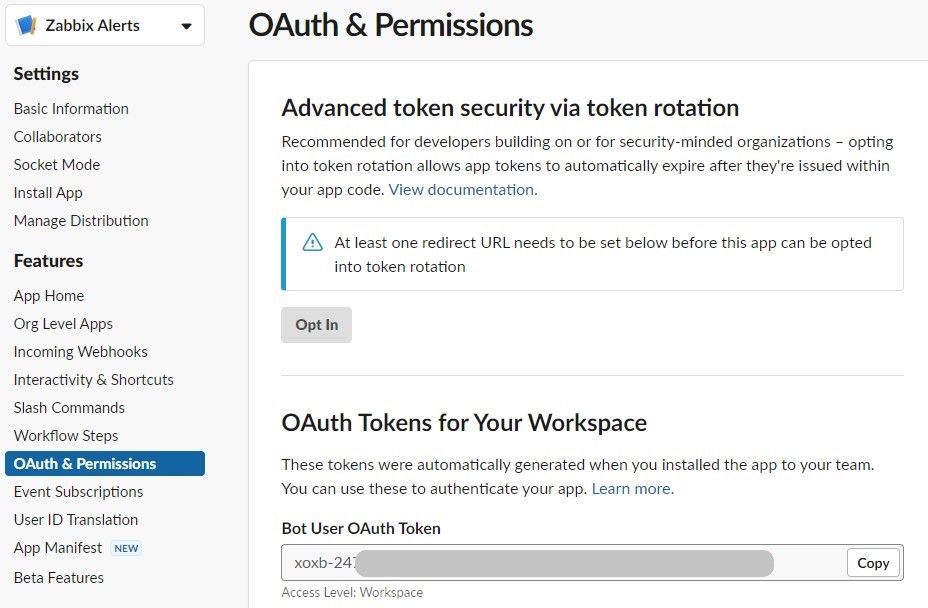
- Press Allow and copy Bot User OAuth Access Token, which will be used to set up a webhook.
# Webhook configuration
- Before setting up the Webhook, need to set up the global macro {$ZABBIX.URL}, which must contain the URL to the Zabbix frontend.

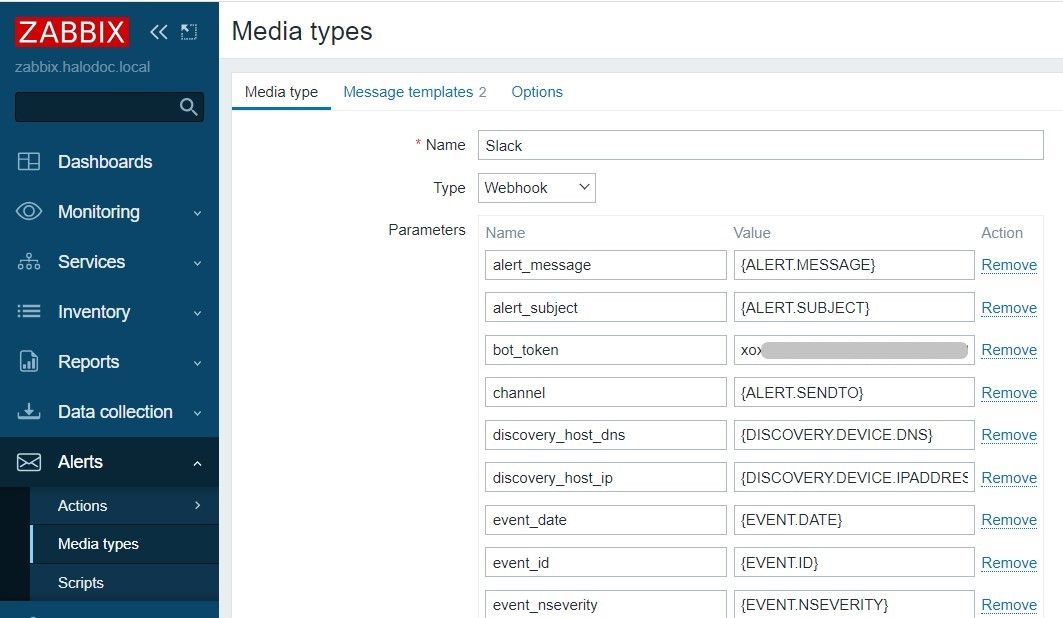
- In the Alerts > Media types section, import the media_slack.yaml
- Before setting up the Webhook, you need to set up the global macro {$ZABBIX.URL}, which must contain the URL to the Zabbix frontend.
Also can choose between two notification modes:
- Alarm (Default); Update messages will be attached as replies to Slack message thread & Recovery message from Zabbix will update initial message.
- Event; Recovery and update messages from Zabbix will be posted as new messages.
- Click the Update button to save the Webhook settings.
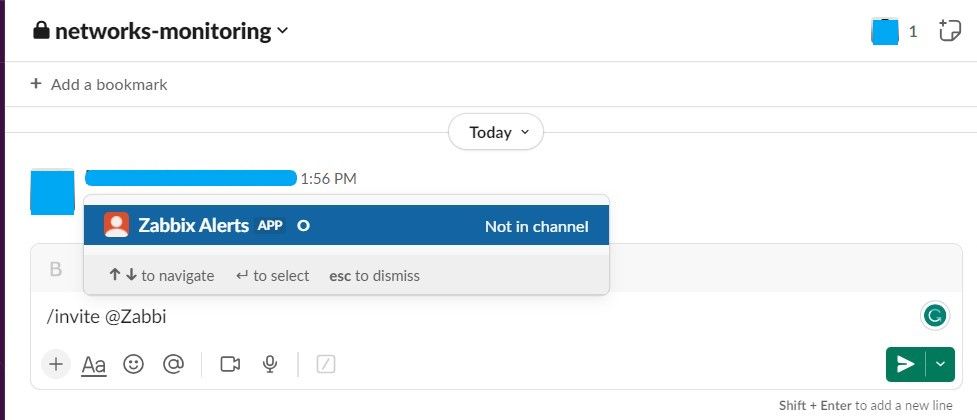
- Create a new channel in your workspace and invite app in your channel.
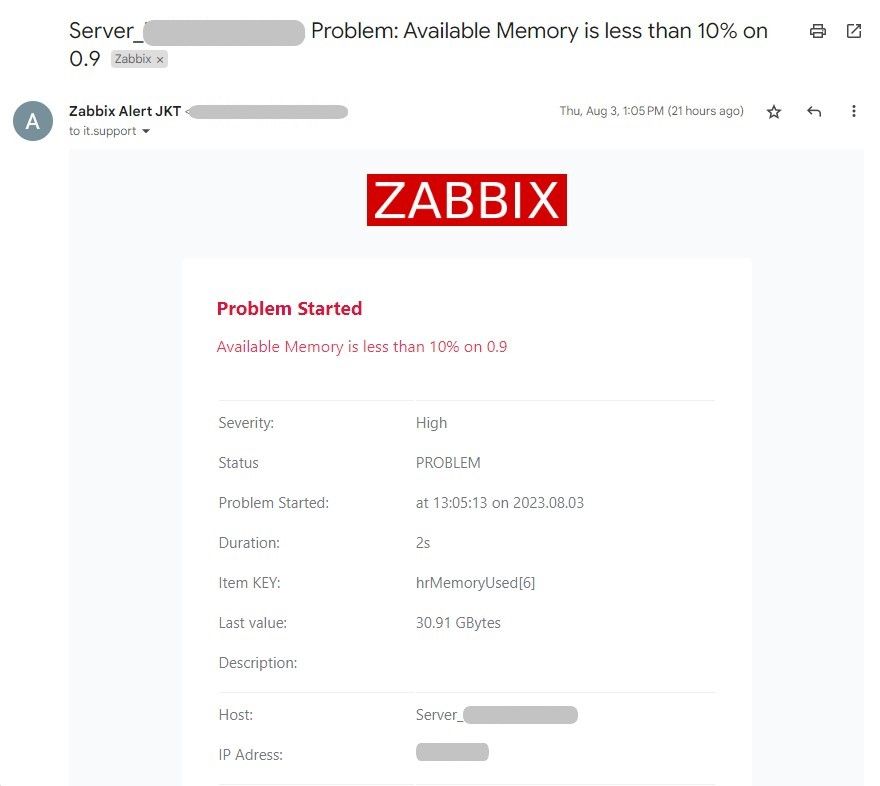
- The last part is to receive alerts base on threshold.
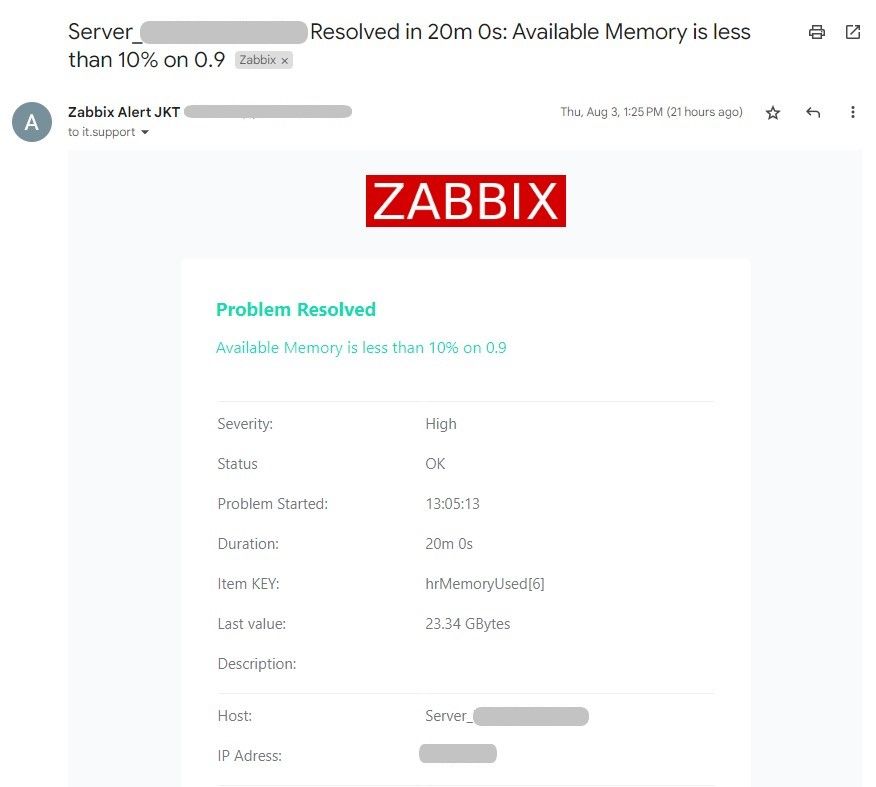
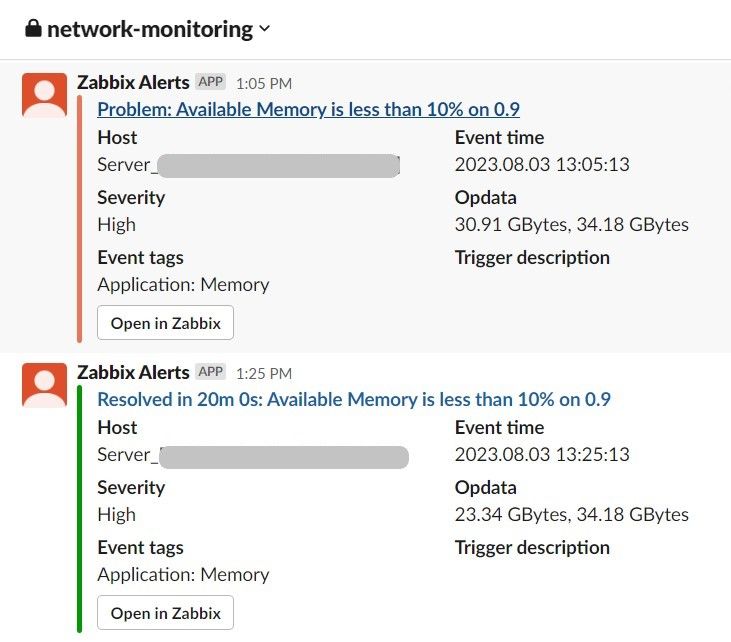
Example Alert problem Memory utilization with threshold, if available Memory is less than 10%, zabbix will send alert problem & if the available memory is more than 10% will send problem resolved
- Email Alert
- Slack Alert
Error Handling
Working with Zabbix, It is important to handle errors properly. There are several steps you can take to troubleshoot issues and resolve them:
- Monitor Logs: Regularly check the Zabbix logs for any error messages or anomalies. The logs provide valuable information about the system's health and can help identify the root cause of issues.
- Review Triggers and Alerts: Ensure that triggers are set up correctly to detect abnormalities in monitored items. Verify that alerting thresholds are appropriate, and alerts are configured to be sent to the right recipients.
- Verify Monitoring Configuration: Double-check the configuration of monitored hosts, items, and templates in Zabbix. Ensure that all necessary parameters are set correctly to collect the desired data.
- Test Connectivity: Verify that Zabbix can communicate with the monitored devices or systems. Test network connectivity and ensure that firewalls or other security measures are not blocking communication.
- Check External Dependencies: If Zabbix relies on external services or databases, ensure that these dependencies are operational and accessible.
- Monitor Resource Utilization: Keep an eye on the resource utilization of the Zabbix server and database. Ensure that there are no performance bottlenecks that may affect the monitoring system's functionality.
- Troubleshoot Actions: Review the configured actions in Zabbix, such as notifications and escalations, to ensure they are working as intended.
- Perform Updates and Maintenance: Keep Zabbix and its components up to date with the latest patches and updates. Regularly maintain the Zabbix infrastructure to prevent potential issues.
- Monitor and Analyze Trends: Identify patterns in error occurrences and performance issues. Analyze trends over time to understand potential root causes and plan improvements.
- Involve the Zabbix Community: If troubleshooting becomes challenging, reach out to the Zabbix community or support forums for assistance and insights from experienced users.
By following these steps, you can effectively handle errors in Zabbix, ensuring the reliability and effectiveness of your monitoring system.
Conclusion
Halodoc's decision to implement Zabbix for network monitoring was driven by the need to improve efficiency and performance. Zabbix offers a powerful, flexible, and open-source platform with real-time monitoring, advanced alerting capabilities, and scalability. Although it requires technical expertise for installation and maintenance, the benefits of cost savings, customization, and adaptability outweigh the challenges. The successful implementation of Zabbix highlights the importance of choosing the right network monitoring system to enhance efficiency and performance in today's technology-driven world.
Join us
Scalability, reliability and maintainability are the three pillars that govern what we build at Halodoc Tech. We are actively looking for engineers at all levels and if solving hard problems with challenging requirements is your forte, please reach out to us with your resumé at careers.india@halodoc.com.
About Halodoc
Halodoc is the number 1 all around Healthcare application in Indonesia. Our mission is to simplify and bring quality healthcare across Indonesia, from Sabang to Merauke. We connect 20,000+ doctors with patients in need through our Tele-consultation service. We partner with 3500+ pharmacies in 100+ cities to bring medicine to your doorstep. We've also partnered with Indonesia's largest lab provider to provide lab home services, and to top it off we have recently launched a premium appointment service that partners with 500+ hospitals that allow patients to book a doctor appointment inside our application. We are extremely fortunate to be trusted by our investors, such as the Bill & Melinda Gates Foundation, Singtel, UOB Ventures, Allianz, GoJek, Astra, Temasek and many more. We recently closed our Series C round and In total have raised around USD$180 million for our mission. Our team works tirelessly to make sure that we create the best healthcare solution personalised for all of our patient's needs, and are continuously on a path to simplify healthcare for Indonesia.