Enhancing Java Application Performance: Transitioning from G1GC to ZGC at Halodoc
At Halodoc, our commitment to providing top-tier healthcare solutions is matched only by our dedication to continuous improvement. As we navigate the dynamic landscape of technology, optimising our Java applications for peak performance and reliability remains a cornerstone of our mission. In this blog post, we're excited to share our journey of elevating our garbage collection strategy from G1GC to ZGC, enhanced with custom parameters, using JDK 17 and JDK 21. This strategic evolution represents not just a technical upgrade but a pivotal step forward in our quest to deliver seamless healthcare experiences to our users. Let's delve into the transformative impact of this migration and the personalised approach we've taken to unlock new levels of performance and efficiency on our platform.
Understanding G1GC and ZGC:
G1GC (Garbage First Garbage Collector) is a Java garbage collection algorithm that divides the heap into smaller parts to clean up efficiently. It helps reduce pauses in application execution, offering better predictability. Its main features include dividing the heap, cleaning up gradually, and adapting to the application's needs. This makes garbage collection smoother, minimises interruptions, and adjusts settings based on how the program runs.
Challenges with G1GC:
- High CPU Overhead: G1GC can use more CPU resources because of its complex algorithms and frequent collection cycles.
- Not Suitable for All Workloads: While G1GC offers predictable pause times for many applications, it might not be the best choice for those with very large heaps or strict latency requirements.
- Elasticity Issues: G1GC's adaptive sizing might not always adjust optimally, potentially leading to suboptimal performance or inefficient heap usage in some cases. For example, a microservice with fluctuating workloads can cause G1GC to allocate more memory during peak hours or fail to reclaim memory quickly during off-peak hours. This results in inefficient resource utilisation and poor performance.
ZGC, known as the Z Garbage Collector, was introduced in Java 11 to address specific issues and deliver advantages that other garbage collectors, such as G1GC, may not fully deliver. It's designed to provide low-latency garbage collection for large heaps, making it suitable for applications with strict latency requirement
Benefits of ZGC:
- Predictable Pause Times: ZGC's concurrent algorithms minimised pause times, ensuring consistent application responsiveness and user experience.
- Scalability: ZGC's ability to scale with large heaps accommodated our growing workload demands without sacrificing performance.
- Low Latency: ZGC's focus on low-latency garbage collection was instrumental in maintaining smooth and uninterrupted healthcare services, even during peak usage periods.
- Simplified Operations: With ZGC's automatic heap resizing and concurrent garbage collection, it reduces operational overhead and simplifies memory management.
After exploring the benefits of ZGC, we initially implemented it in 60 microservices at Halodoc, yielding impactful results. However, during implementation, we encountered challenges, such as the committed heap reaching the maximum heap size, resulting in pod restarts with OOM (Out of Memory) killed errors, especially with high-memory-intensive applications. To overcome these challenges, we explored new features and parameters for ZGC, which are listed below:
Introducing ZGenerational and Soft Limit Parameter: To further optimize our memory management strategy with ZGC, we embraced two powerful features: ZGenerational and the Soft Limit Parameter.
ZGenerational: Focusing on short-lived objects, ZGC minimises pause times in real-time healthcare applications by dividing memory into generations and prioritising rapid collection, ensuring critical performance optimizations.
-XX:+UseZGenerationalBy enabling, ZGenerational ZGC mode organises objects into young and old generations, allowing tailored garbage collection strategies. Fast incremental sweeps in the young generation ensure responsive performance, while comprehensive, less frequent clean-ups in the old generation maintain stability over time, exclusively supported in recent JDK versions like JDK 21.
Soft Limit Parameter: One of the most exciting additions to ZGC is the soft limit parameter. This parameter allows us to specify a memory threshold, known as the soft limit. As Java application approaches this threshold, ZGC proactively starts reclaiming memory to prevent excessive memory usage and long pause times, hence improving performance and stability.
-XX:SoftMaxHeapSize=${SoftMaxLimit}By adding the SoftMaxHeapSize parameter, it creates a soft limit for heap size, similar to -xms, to efficiently manage memory use.
Implementation and Configuration:
Transitioning from G1GC to ZGC in Halodoc microservices involves careful implementation and configuration to ensure a smooth migration. Here's an overview of the steps involved:
- Assessment and Planning: We began by evaluating our application's memory usage patterns, garbage collection behaviour, and performance requirements. This assessment helped us identify the potential benefits and challenges of migrating to ZGC.
- Compatibility Check: Ensuring compatibility with the our Java versions (jdk17) was crucial, particularly because the ZGC's full suite of features is only accessible in recent releases. While ZGC itself was introduced earlier, its enhanced capabilities, such as Z Generational Garbage Collection, are exclusively available in subsequent releases. Consequently, we meticulously updated our application codebase and dependencies to align with this compatibility requirement.
- Configuration Tuning: Fine-tuned ZGC configuration parameters based on workload characteristics and performance goals. Adjusted parameters such as heap size, pause time targets, and concurrency levels to optimise performance and resource utilisation
- Testing and Canary Deployment: Conducted rigorous testing in a controlled environment to evaluate ZGC's performance with various workloads. Utilised canary deployment to progressively introduce ZGC to non-critical services and environments, enabling meticulous monitoring and iterative parameter fine-tuning.
- Tuning and Optimization: We fine-tuned ZGC parameters, such as heap size and concurrent threads, based on observed behaviour and performance metrics. Continuous optimization ensured optimal performance and resource utilisation.
- Monitoring and Maintenance: Robust monitoring and alerting mechanisms were implemented to detect and respond to any issues arising from the migration. Garbage collection metrics, application performance, and user experience were closely monitored to ensure seamless operation.
In the configuration steps for migrating from G1GC to ZGC at Halodoc, we followed these key steps:
- Update Service Helm Chart: Initially, we added the soft limit parameter to the service Helm chart. This involves configuring the Soft Max Heap Size to ensure optimal memory allocation for ZGC.
export SoftMaxLimit={xms-value} - Modify Service Startup File: Next, we included specific parameters in the service startup file to enable and configure ZGC. This includes adding "
-XX:+UseZGC -XX:+ZGenerational -XX:SoftMaxHeapSize=${SoftMaxLimit}" to activate ZGC with generational mode and setting the soft limit heap size dynamically. - Canary Deployment: After merging the code changes, we released changes via the canary deployment strategy. This phased rollout approach allowed us to gradually introduce ZGC to a subset of services or environments, enabling careful monitoring and validation of its performance before full deployment.
- Monitor Heap and Memory Usage: Throughout the migration process, we continuously monitored the heap and memory usage. This ensured that the changes introduced by migrating to ZGC did not adversely affect the system's stability or performance. Any deviations or issues detected are promptly addressed to maintain seamless operation.

Here's a comparison table of the performance statistics between G1GC and ZGC:
ZGC appears to outperform G1GC in all measured aspects: it shows lower average response times, higher throughput, reduced garbage collection time, and lower memory usage. Additionally, ZGC's proactive garbage collection approach eliminates the need to wait for memory to reach a certain threshold before initiating garbage collection, which can help in more consistent performance and reduced latency spikes.

-XX:+UseG1GC
-XX:+UseZGC
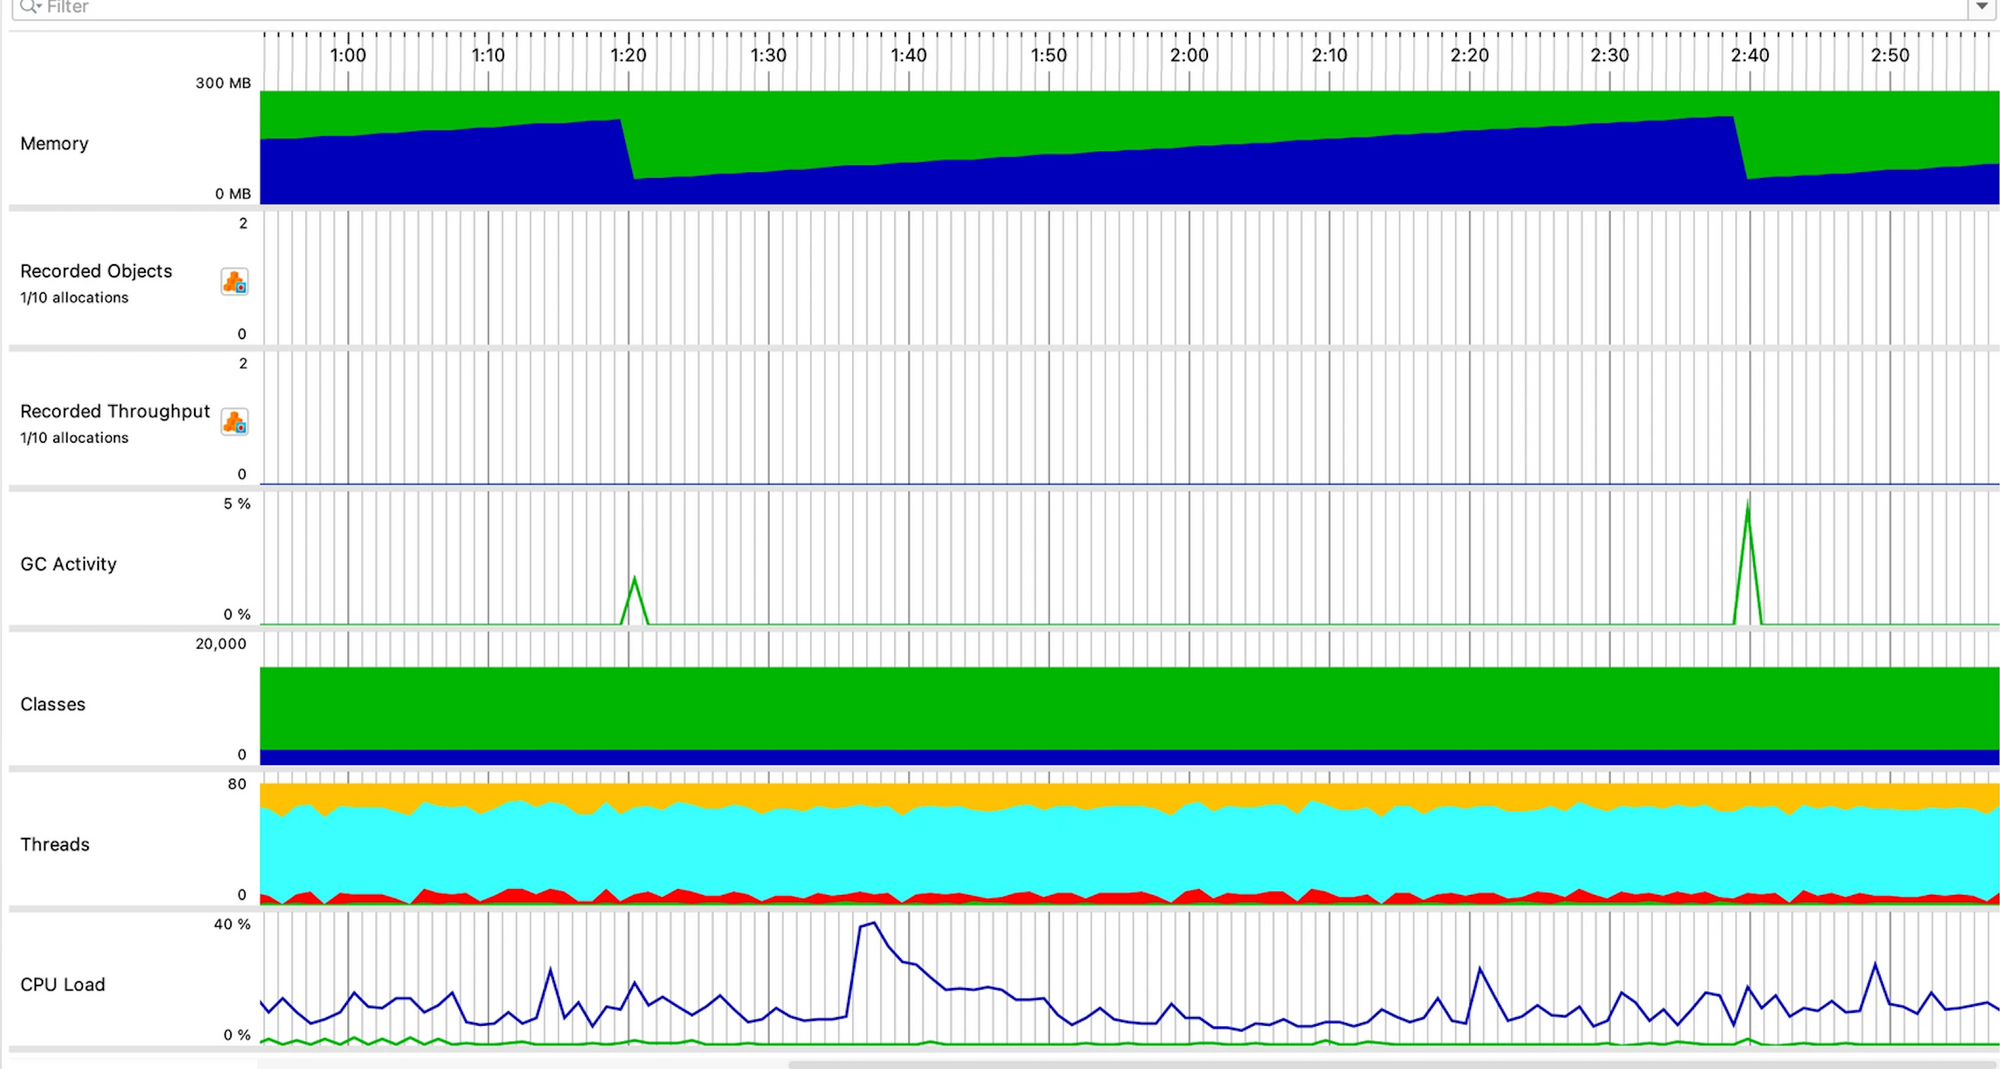
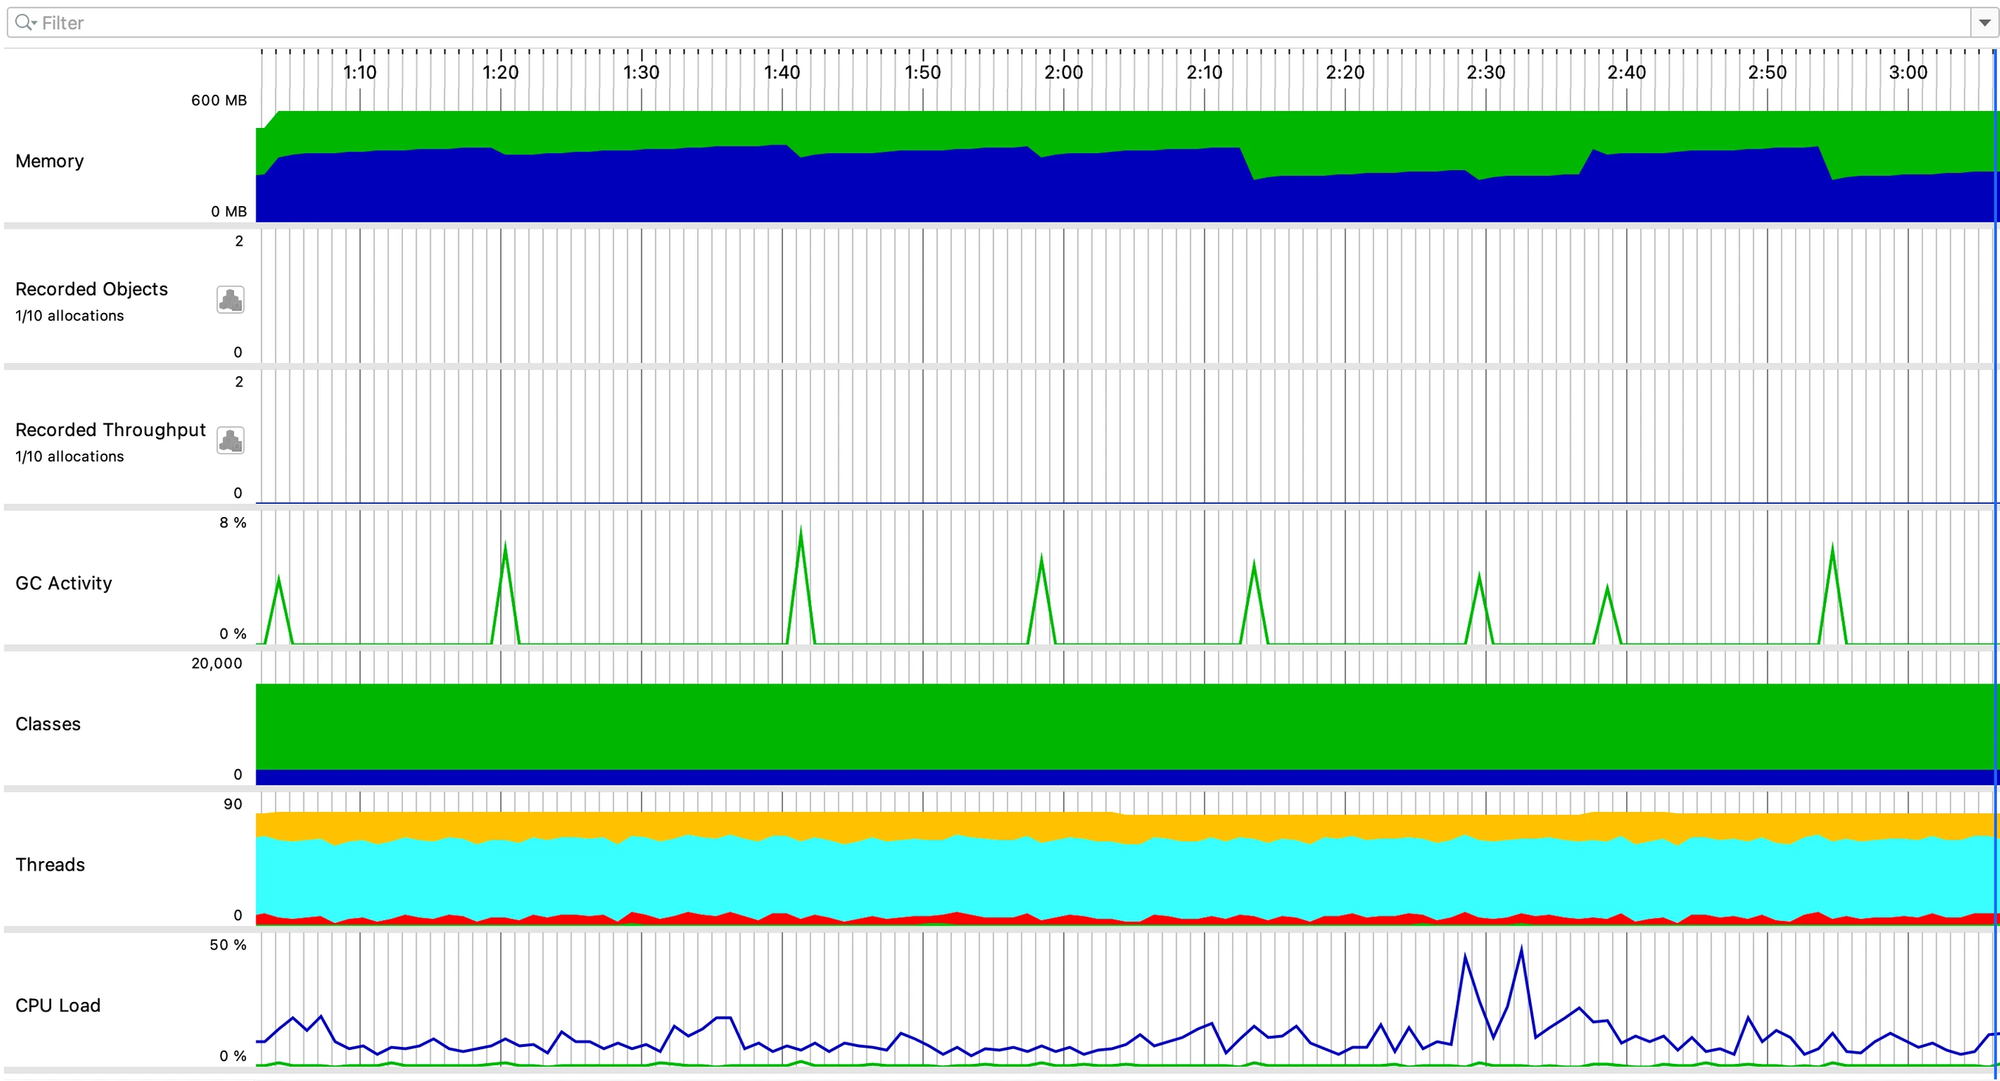
The diagrams illustrate contrasting behaviours of the G1 Garbage Collector (G1GC) and the Z Garbage Collector (ZGC), particularly in terms of their triggering mechanisms and garbage collection approaches. G1GC adopts a reactive strategy, initiating garbage collection only when free memory nears a predefined threshold, aiming to maintain a balanced memory profile. On the other hand, ZGC takes a proactive stance, triggering garbage collection preemptively without waiting for free memory to reach critical levels, ensuring efficient memory management and low latency, especially in scenarios with larger heap sizes and stringent latency requirements.

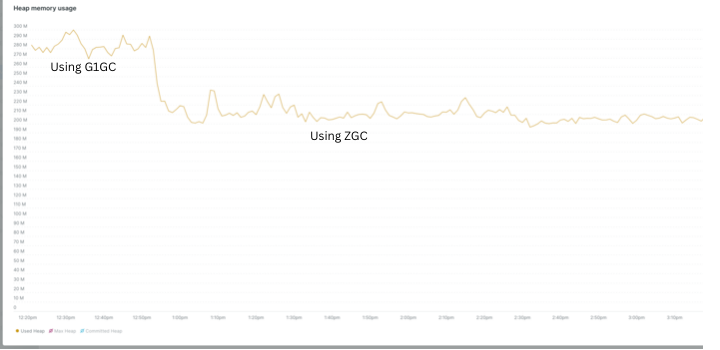
This diagram compares heap memory usage in our micro-service with ZGC implementation, including ZGenerational and soft limit parameters, we've observed a notable 20% reduction in utilised heap space.
We achieved the following optimisations at Halodoc:
- 20% Reduction in Average Response Time: By implementing ZGC, we successfully trimmed down the average response time by 20%. This optimisation ensures that our users experience faster interactions with our services, enhancing overall user satisfaction and engagement.
- 25% Reduction in Memory Usage: ZGC's efficient utilization of memory resources not only optimizes operational costs but also improves system stability and scalability, enabling us to accommodate more throughput without compromising performance. It's important to note that while ZGC may reclaim committed heaps more aggressively, the actual used heap may not be reduced by the same margin. In practical terms, this means that while ZGC might indicate a 25% reduction in memory usage, the actual reduction in heap memory may be approximately 15%.
- 10% Decrease in Garbage Collection Time: The adoption of ZGC led to a notable 10% reduction in garbage collection time. By minimising interruptions caused by garbage collection processes, we've achieved smoother and more consistent application performance, enhancing the overall reliability of our services.
- 30% Increase in Throughput: This improvement allows our systems to handle a higher volume of requests efficiently, achieving the same or increased throughput with the same or reduced resource allocation per pod, ensuring seamless scalability to accommodate growing user demands.
Conclusion:
The transition to ZGC at Halodoc represents a significant milestone in our journey to enhance Java application performance and reliability. Leveraging ZGC's advancements in the latest JDK versions, we've been able to deliver seamless healthcare experiences while effectively managing resource utilisation. Join us in embracing ZGC for optimal performance and efficiency in your Java applications.
Looking ahead, we plan to implement these enhancements across all 80+ Java services, along with leveraging JDK 21 changes. These advancements have enabled us to deliver seamless healthcare experiences while efficiently managing resource utilisation. In our future enhancements, we aim to further optimise garbage collection processes, explore additional performance tuning opportunities, and integrate cutting-edge features introduced in JDK 21 to continually elevate the performance and reliability of our Java applications
References
Join Us
Scalability, reliability and maintainability are the three pillars that govern what we build at Halodoc Tech. We are actively looking for engineers at all levels and if solving hard problems with challenging requirements is your forte, please reach out to us with your resume at careers.india@halodoc.com.
About Halodoc
Halodoc is the number 1 all around Healthcare application in Indonesia. Our mission is to simplify and bring quality healthcare across Indonesia, from Sabang to Merauke. We connect 20,000+ doctors with patients in need through our Tele-consultation service. We partner with 3500+ pharmacies in 100+ cities to bring medicine to your doorstep. We've also partnered with Indonesia's largest lab provider to provide lab home services, and to top it off we have recently launched a premium appointment service that partners with 500+ hospitals that allow patients to book a doctor appointment inside our application. We are extremely fortunate to be trusted by our investors, such as the Bill & Melinda Gates Foundation, Singtel, UOB Ventures, Allianz, GoJek, Astra, Temasek, and many more. We recently closed our Series D round and In total have raised around USD$100+ million for our mission. Our team works tirelessly to make sure that we create the best healthcare solution personalised for all of our patient's needs, and are continuously on a path to simplify healthcare for Indonesia.


