
Enhancing system statistics with custom metrics via Collectd
To scale the application up/down based on scenarios, we can’t rely on system metrics. To overcome this problem of autoscaling, we at Halodoc used collectd to collect custom metrics and auto scale our application.
This blog will walk you around overview of collectd, installation, configuration, cloudwatch agent installation, configuration, integrating cloudwatch with collectd and metrics alarm setup.
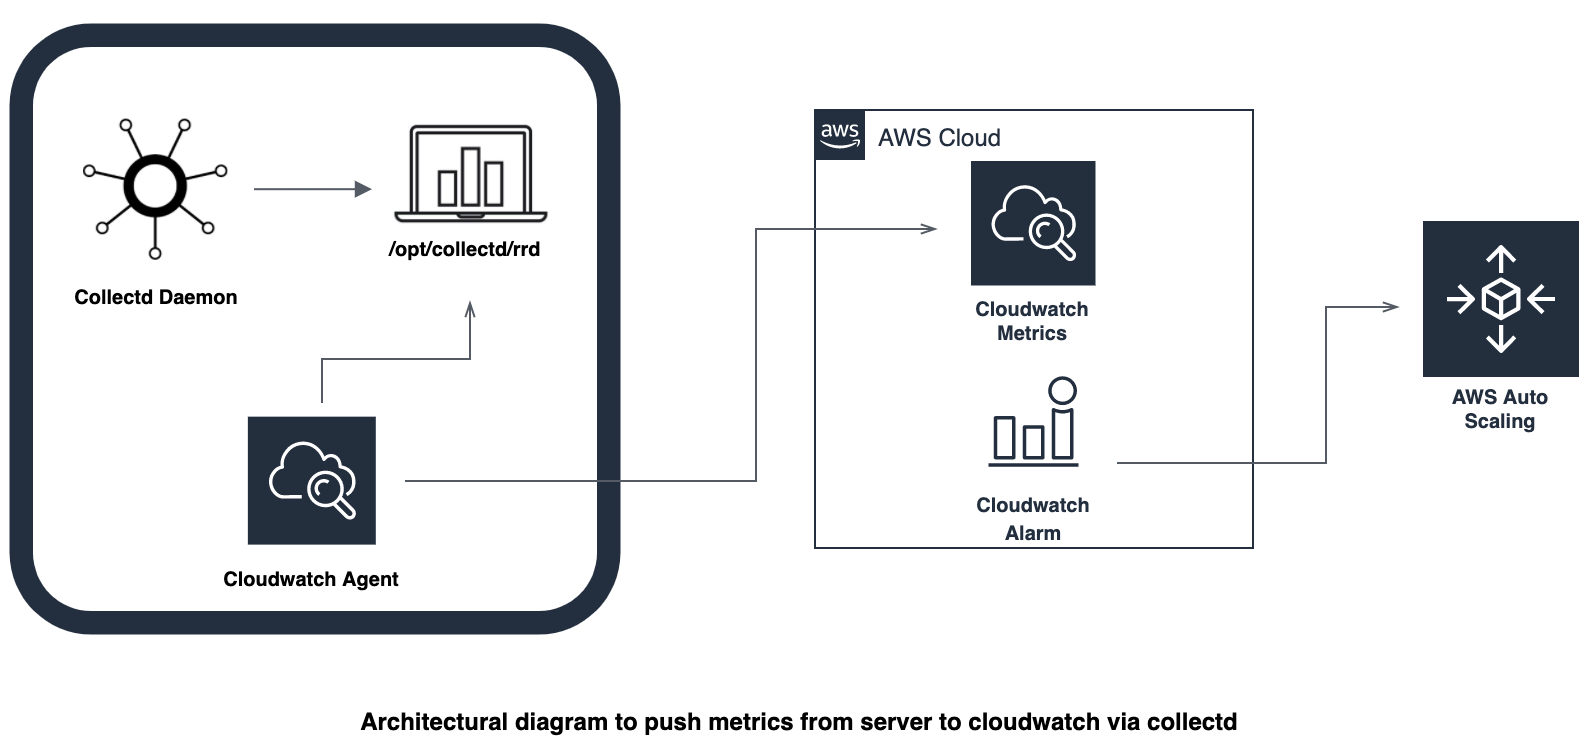
Overview of Collectd
The Collectd is a unix daemon which continuously runs on your underlying fleet of EC2 instances to collect and store custom metrics such as memory, heap, GC etc. Collectd daemon is written in C for performance and portability. It supports numerous plugins which allow you to collect system statistics on your system.
Why Collectd?
Collectd collects the custom metrics in a very short interval of time (minimum 1sec). It runs as a daemon in the system which doesn't use a public network to collect the system metrics for triggering the Auto Scaling.
Installing and configuring Collectd
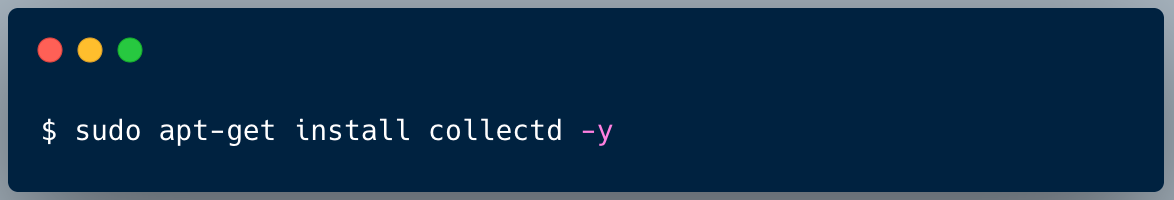
- Installation of collectd on Ubuntu system.
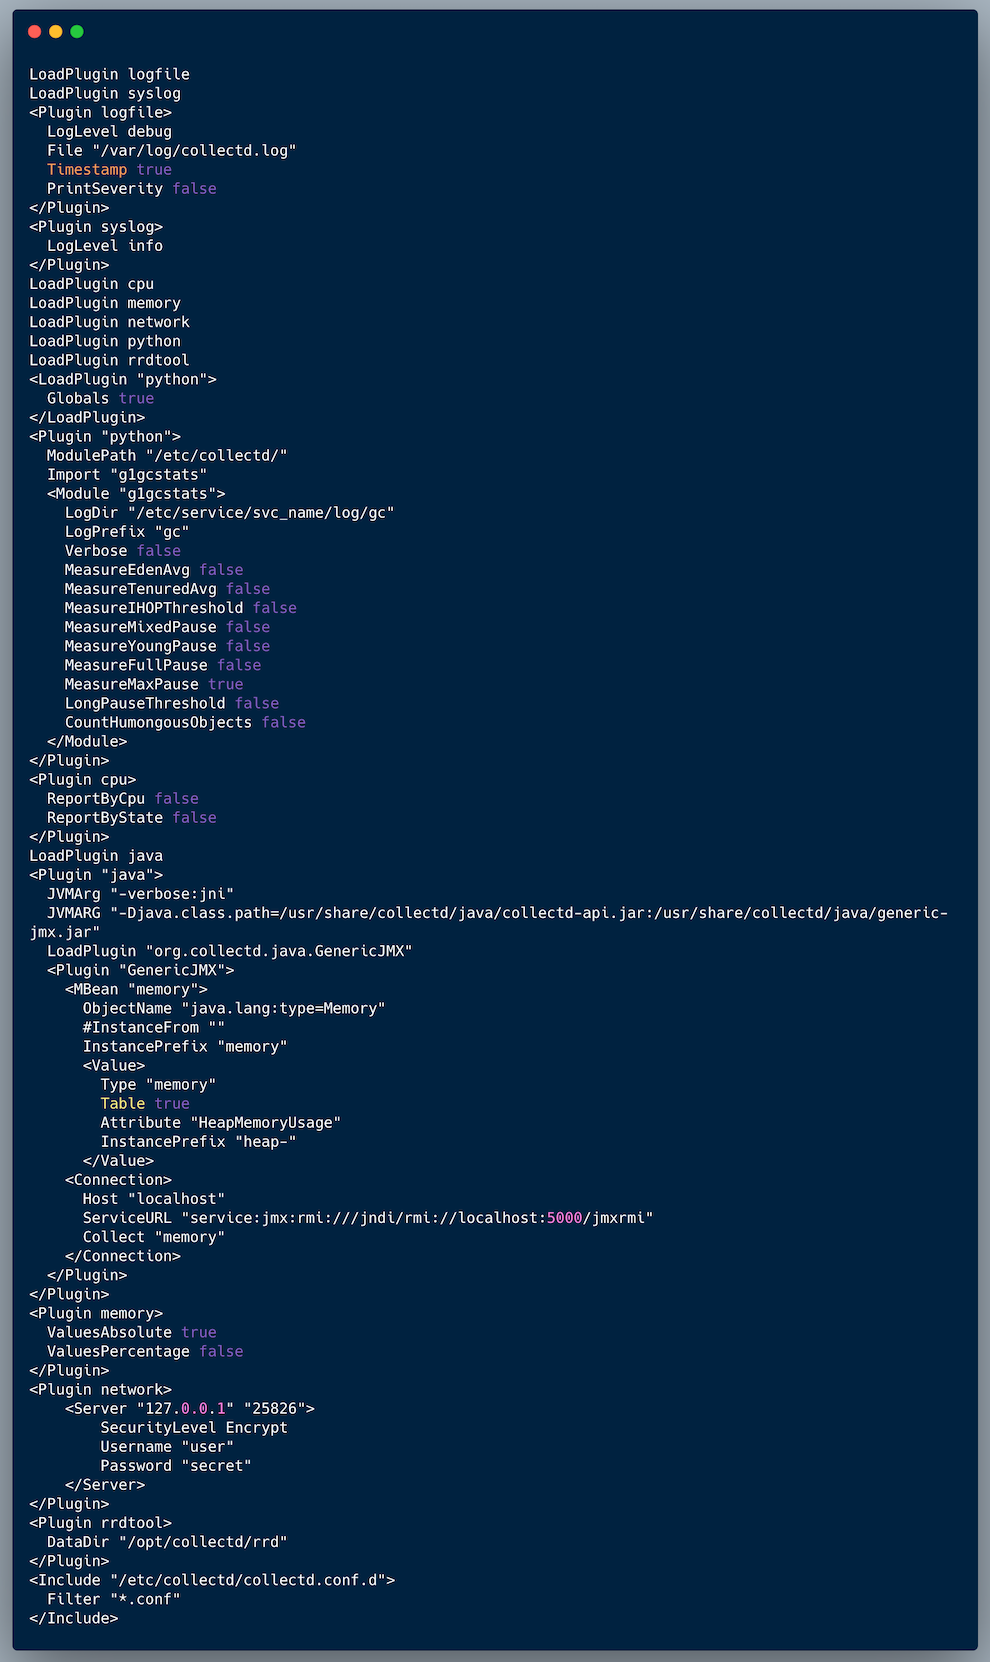
2. Configuring collectd based on requirement
In this config (/etc/collectd/collectd.conf) you will find numerous plugins of your system. We have enabled only a few plugins which are required to trigger our ASG. After configuring the collectd.conf file it looks like this.
Restart the collectd service to reflect the changes.
After this you should be able to see the enabled metrics in collectd data directory i.e (/opt/collectd/rrd/)
Integrating Collectd with Cloudwatch agent
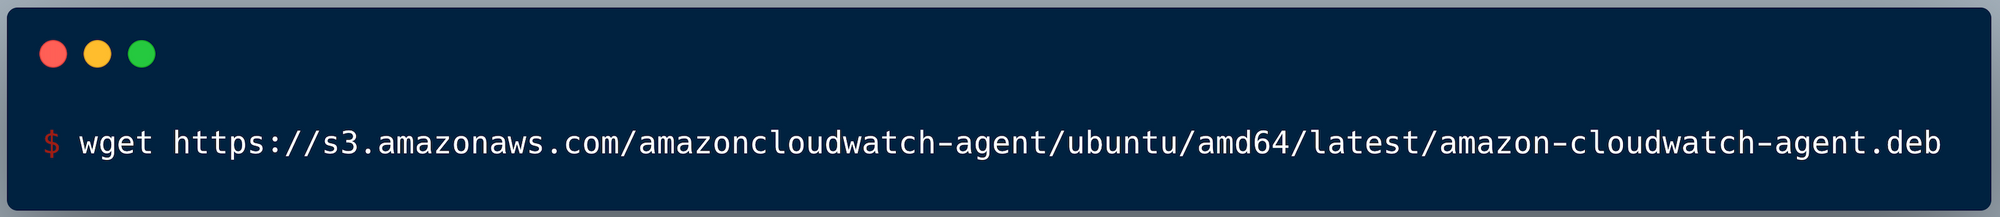
- Download cloudwatch agent.
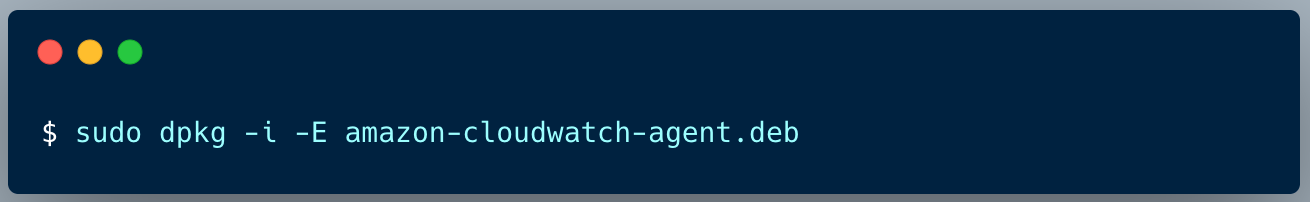
2. Install cloudwatch agent.
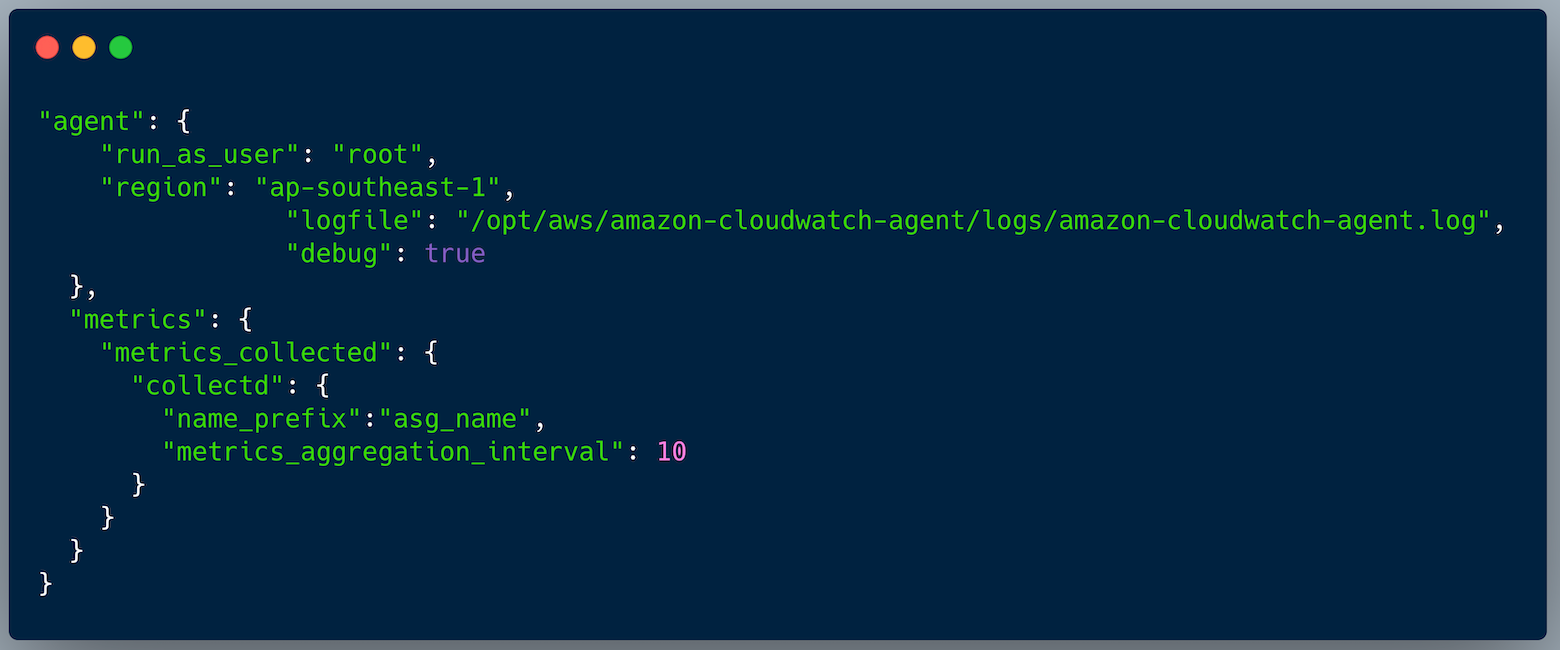
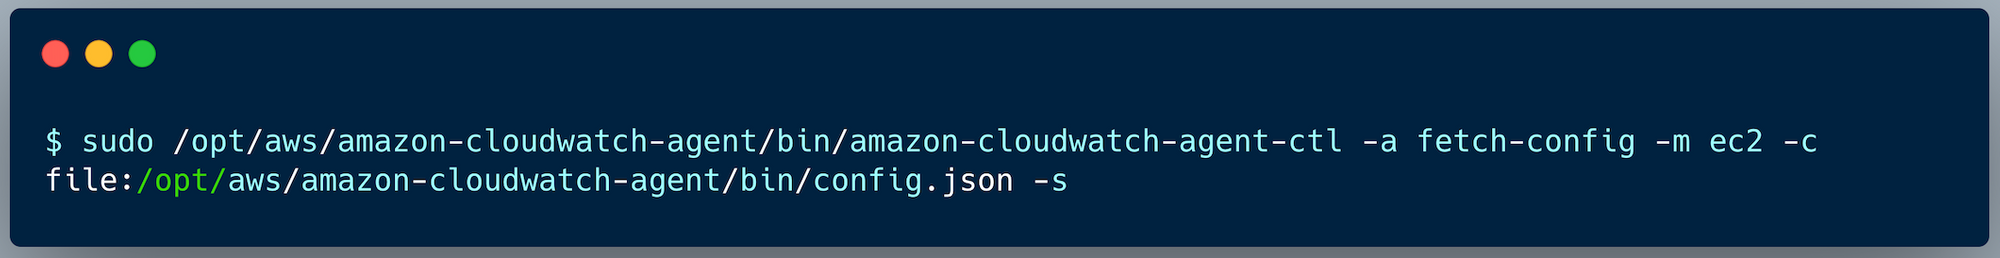
3. Configuring the config.json file from where cloudwatch agent will get to know from where it will read the metrics and push to cloudwatch console.
4. Pass cloudwatch config.json to cloudwatch agent.
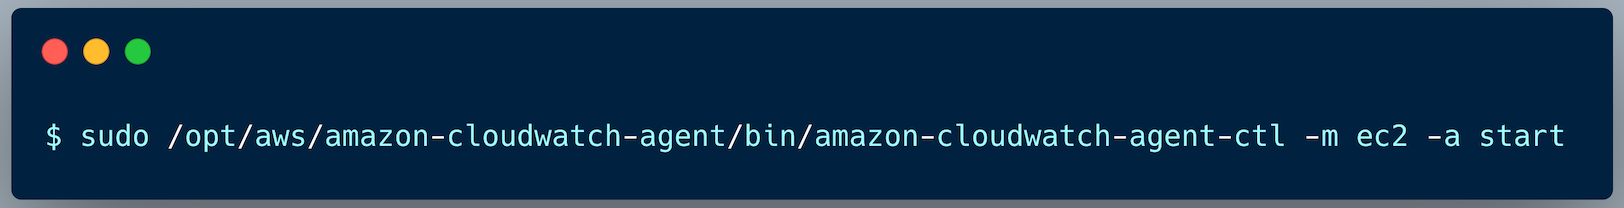
5. Start the cloudwatch agent.
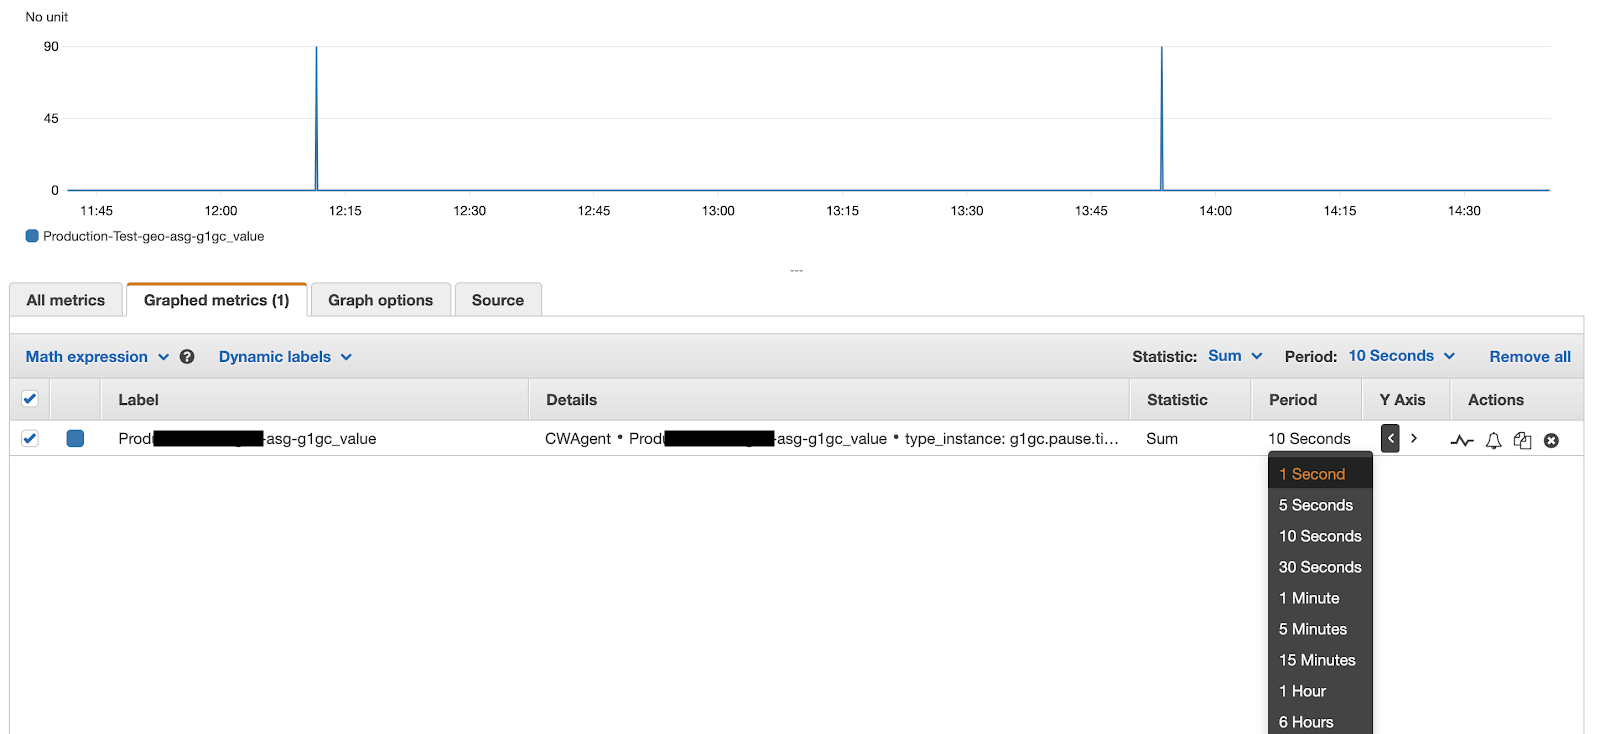
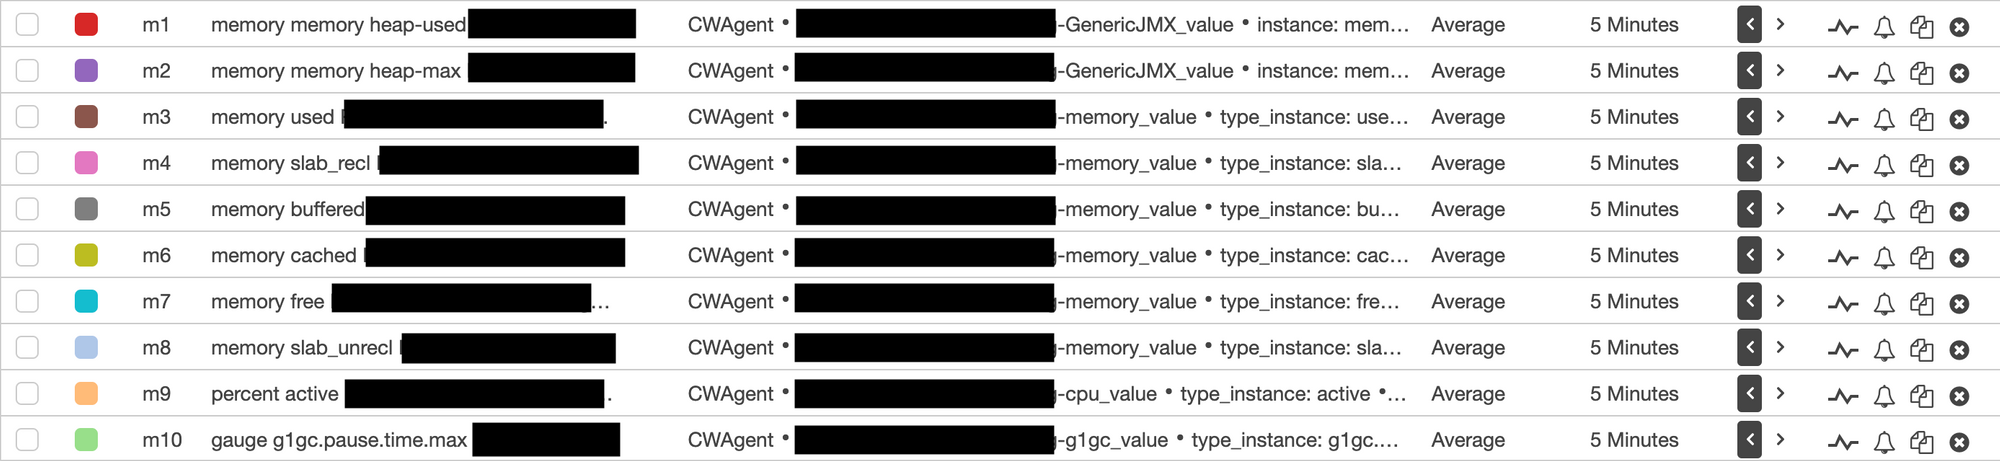
After starting cloudwatch agent, metrics will start to appear in the cloudwatch metrics as shown in the image below.
6. Configuring cloudwatch metrics to trigger cloudwatch alarm
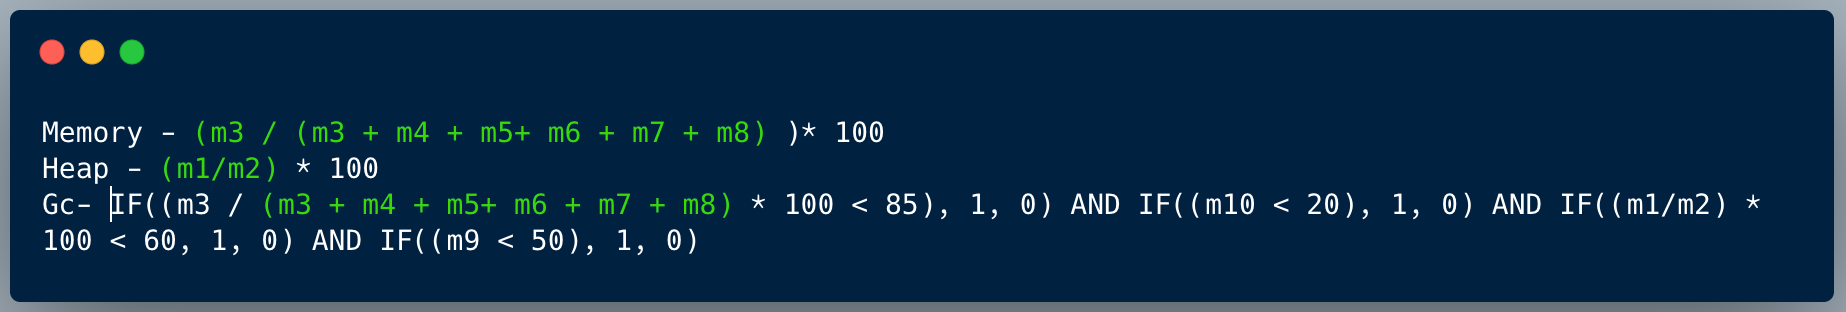
After getting above metrics we need to create custom expressions. As seen in the screenshot below, we created three expressions.
a. heap percentage
b. memory percentage
c. GC percentage
All the metrics coming to cloudwatch has metrics ID. We used these metrics ID to create an expression.
Below are the expressions for heap, memory and GC.
where,
m1 = heap used
m2 = heap max
m3 = memory used
m4 = memory slab_reclaimable
m5 = memory buffered
m6 = memory cached
m7 = memory free
m8 = memory slab_unreclaimable
Leveraging metric alarms for managing ASG
We used metric alarm to scale up the ASG as it watches a single cloudwatch metric or the result of a math expression based on cloudwatch metrics. We used composite alarm to scale down the ASG as it includes a rule expression that takes into account the alarm states of all other alarms. This is because we wanted to scale down the application keeping in mind CPU, memory & GC.
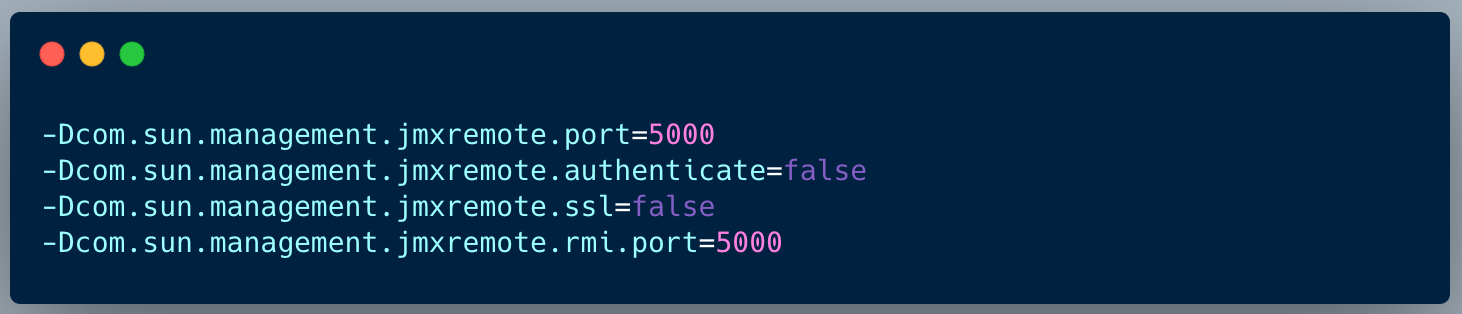
Application changes
We need to enable these jmx parameters in run file of java application.
Conclusion
Using collectd has helped us getting custom metrics enabling us to scale our applications and infra in more efficient way. We look forward to leveraging additional capabilities of collectd in future, to solve for many more scenarios to boost our scalability significantly.
References
https://docs.aws.amazon.com/AmazonCloudWatch/latest/monitoring/Create-alarm-on-metric-math-expression.html
https://aws.amazon.com/blogs/devops/new-how-to-better-monitor-your-custom-application-metrics-using-amazon-cloudwatch-agent/
Join us
We are always looking out for top engineering talent across all roles for our tech team. If challenging problems that drive big impact enthral you, do reach out to us at careers.india@halodoc.com
About Halodoc
Halodoc is the number 1 all around Healthcare application in Indonesia. Our mission is to simplify and bring quality healthcare across Indonesia, from Sabang to Merauke. We connect 20,000+ doctors with patients in need through our Tele-consultation service. We partner with 3500+ pharmacies in 100+ cities to bring medicine to your doorstep. We've also partnered with Indonesia's largest lab provider to provide lab home services, and to top it off we have recently launched a premium appointment service that partners with 500+ hospitals that allow patients to book a doctor appointment inside our application. We are extremely fortunate to be trusted by our investors, such as the Bill & Melinda Gates Foundation, Singtel, UOB Ventures, Allianz, GoJek and many more. We recently closed our Series B round and In total have raised USD$100million for our mission. Our team works tirelessly to make sure that we create the best healthcare solution personalised for all of our patient's needs, and are continuously on a path to simplify healthcare for Indonesia.