
Memgraph, detection of memory issues on iOS
At Halodoc, we constantly strive to achieve quality products across platforms and domains. Mobile apps can be made to look sleek without much effort but making super-high-quality & memory-efficient apps is not easy.
At Halodoc, we constantly work towards various ways to improve this and one such aspect is memory leaks in apps. Users hate the app crashes, or even when they slow down or freeze for a few seconds resulting in users ending up uninstalling the apps which impacts the DAU / MAU of the apps.
Memory on mobile devices is a shared resource. Apps that manage it improperly run out of memory, crash, and suffer from drastically degraded performance. When managed properly, it helps in Users to have a smoother experience. Not addressing the memory leaks proactively could lead to the accumulation of technical debts which affects the performance and quality of the app. Hence identifying and fixing the memory issues plays a vital role in the app performance & experience.
What's Memory graph debugger?
The memory graph debugger helps with answering the following question: Why does an object exist in memory?
The Xcode memory graph debugger helps to find and fix the retain cycles and leaked memory. When activated, it pauses app execution, and displays objects currently on the heap, along with their relationships and what references are keeping them alive.
Tools to identify the Memory issues
- Xcode
- Instruments
- VM Tracker
Xcode
Let's proceed with step by step procedure to get started with
Step 1: Enabling the Memory Management in Xcode Run diagnostics
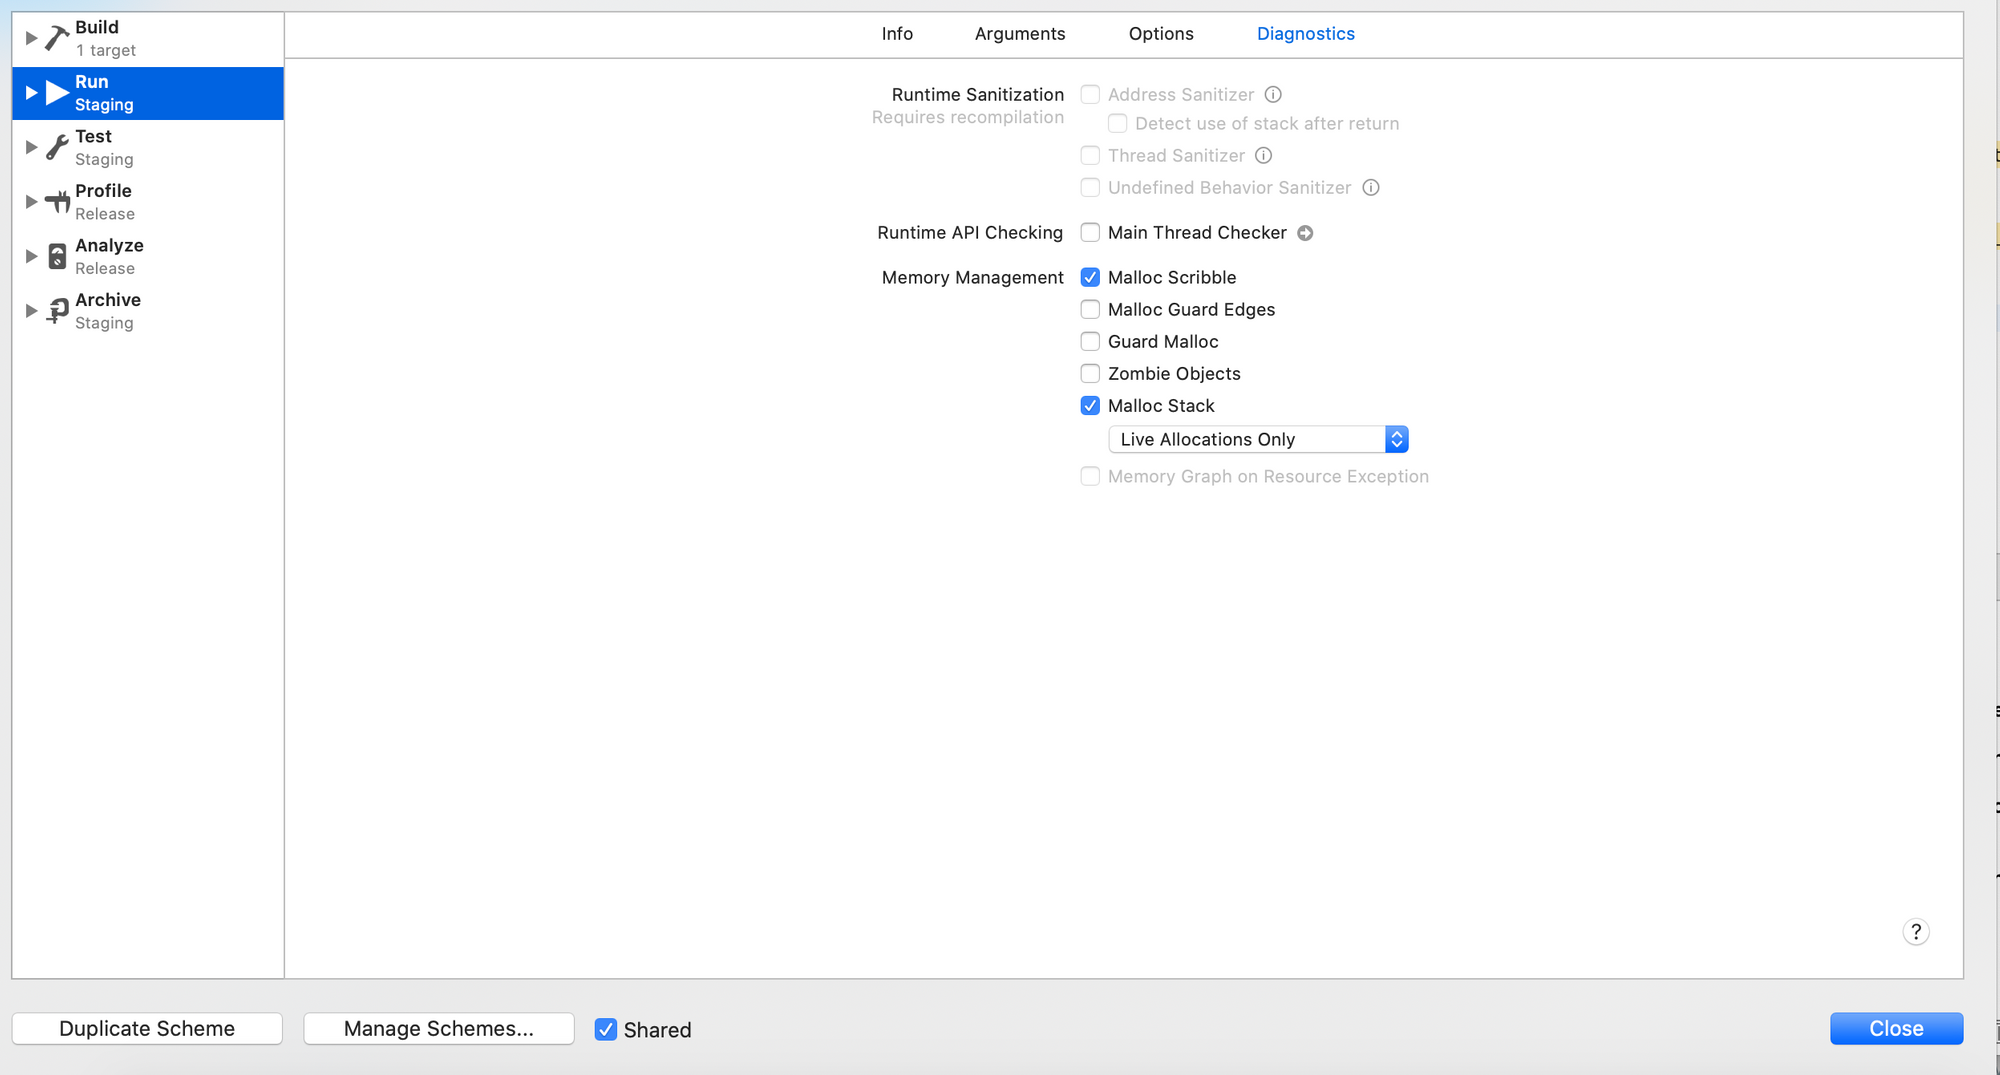
Note that we only enable logging of ‘Live Allocations’.
Step 2: Performing user actions on critical business flows
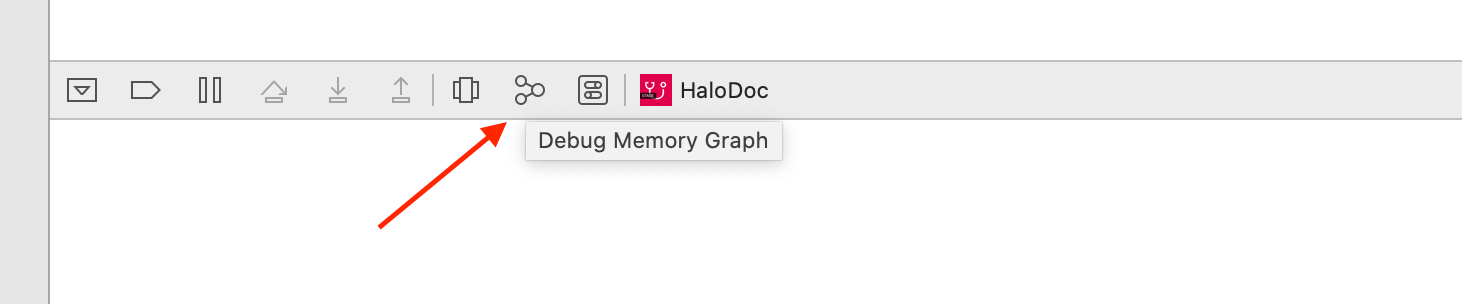
Once the business flows are captured through manual actions, tap on Memory Debug Graph
Step 3: Generation of the memory graph in Xcode
After tapping on the Memory Debug Graph, the Xcode takes sometime to generate the memory graph by pausing the app execution.
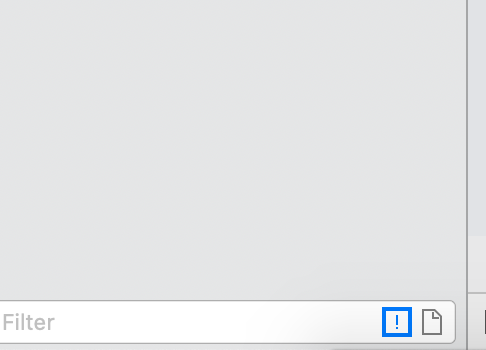
Choose a filter option to to filter out Show only leaked blocks
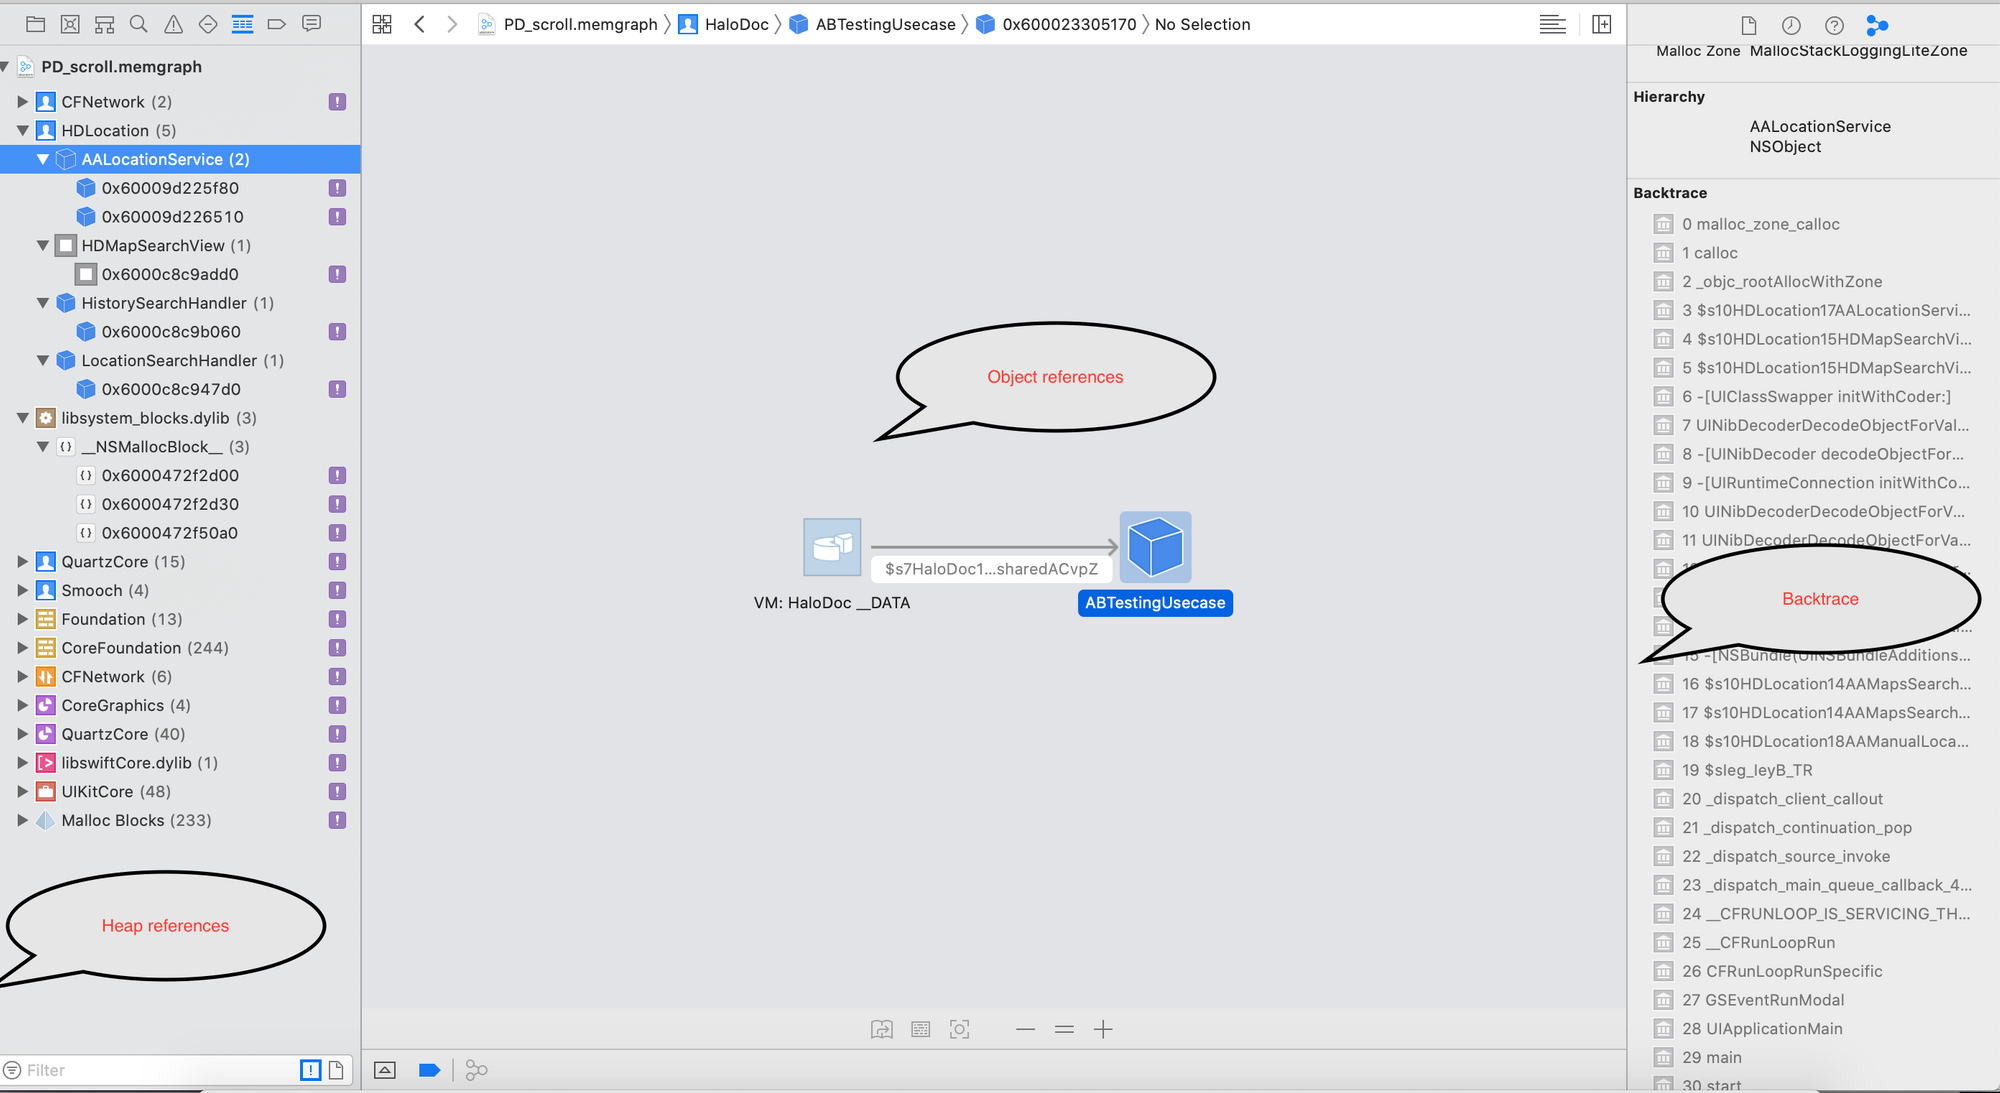
Once the memory graph is generated, there are 2 ways to debug the graph.
First way is with the Xcode. Xcode navigator provides data on the 3 aspects. Left Navigator provides details on the Heap references wherein the objects left without garbage collected & the retain cycles, where one object holds the reference of the other object.
Second is the Object reference, which is at the middle of the Xcode, which provides the graphical representation of the flow of memory leak.
Third is the right navigator which helps in backtrace info of the Pod / Library leaks. This also provides info about the Class Hierarchy & Object details.
Command Line Tools — VMMap
Second way is with VM Tracker. To proceed with this, first we need to export the generated Memory leak. Go to the File , Choose the option Export Memory Graph and choose destination to Save this file.
The first step when using VMMap is to get a summary of your virtual memory map.
Navigate to the path where the memory graph file is saved and in the terminal paste the command VMMap -summary <memgraph file>
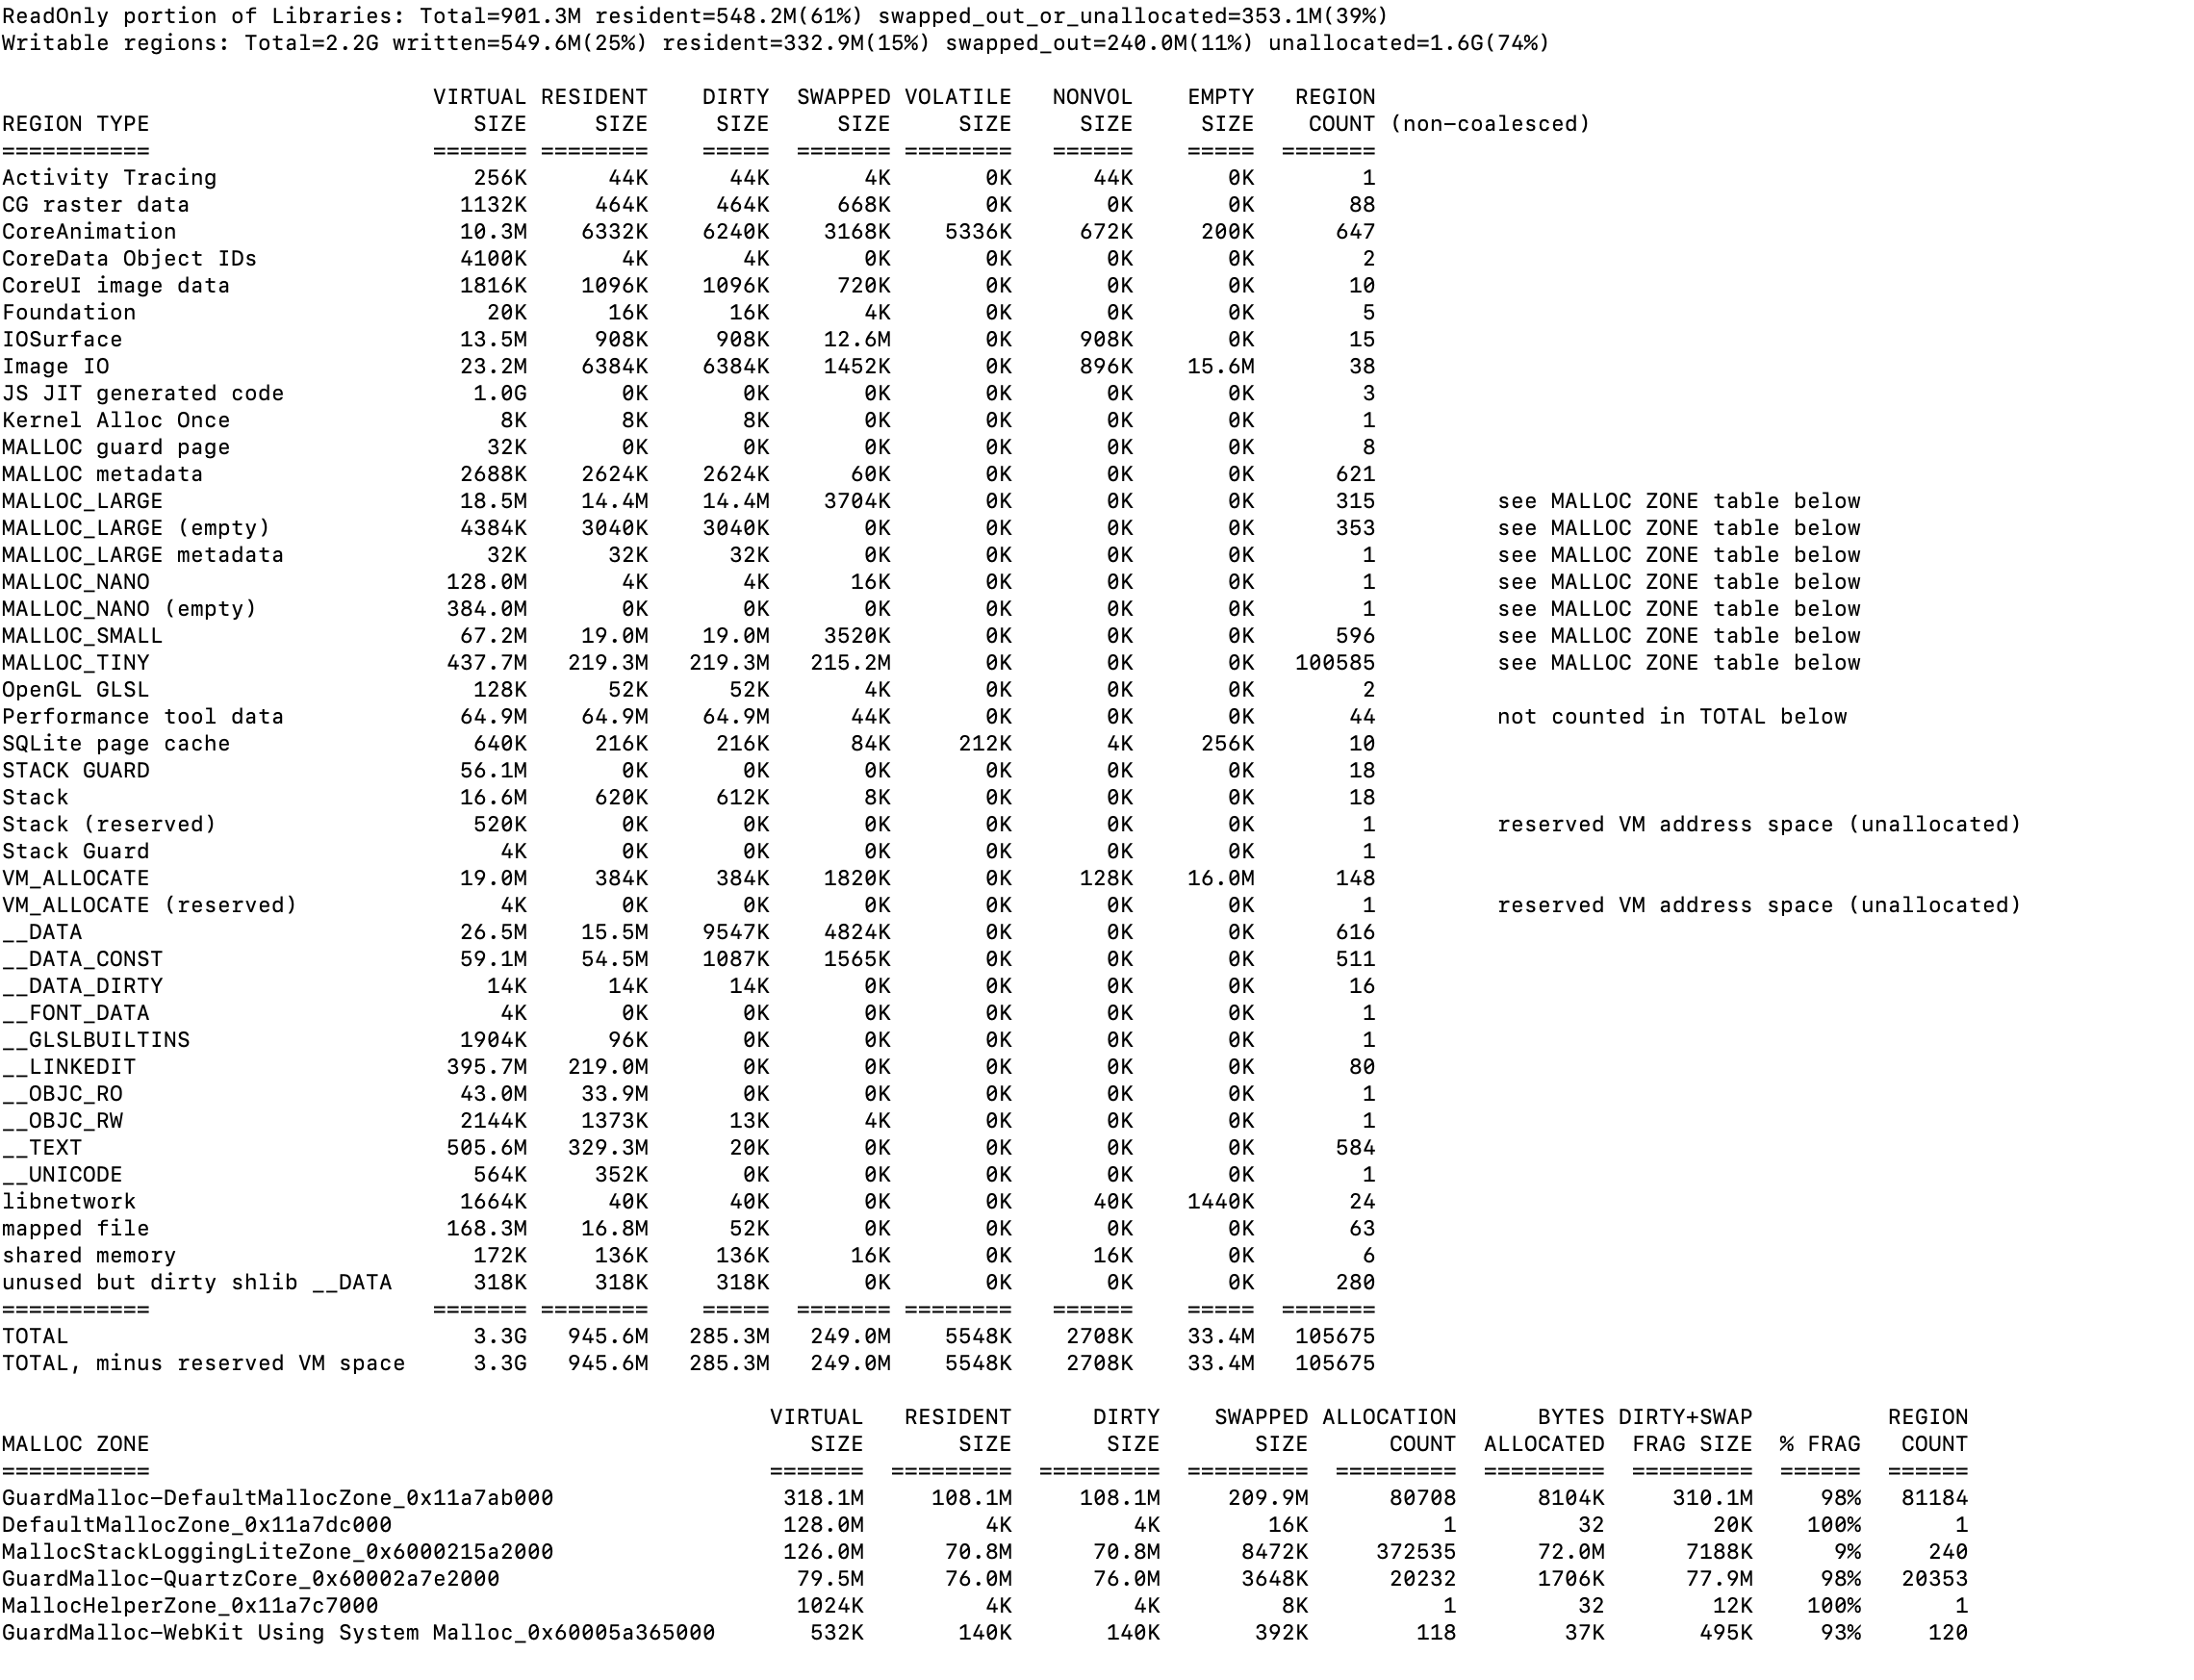
__TEXT — It contains executable code and constants
__DATA — Well, data :)
__OBJC — If your app contains Objective C code, this region contains Objective C Runtime library code
Shared Memory — System Libraries that are shared with other applications, such as Cocoa and OpenGL
Mapped file — This region contains file contents that are frequently accessed and are mapped to the virtual memory in order to enable faster access
Stack — Contains the stack memory, including parameters for every function call.
Using VMMap, to understand what type of memory causes us this problem. vmmap -summary file_name.memgraph
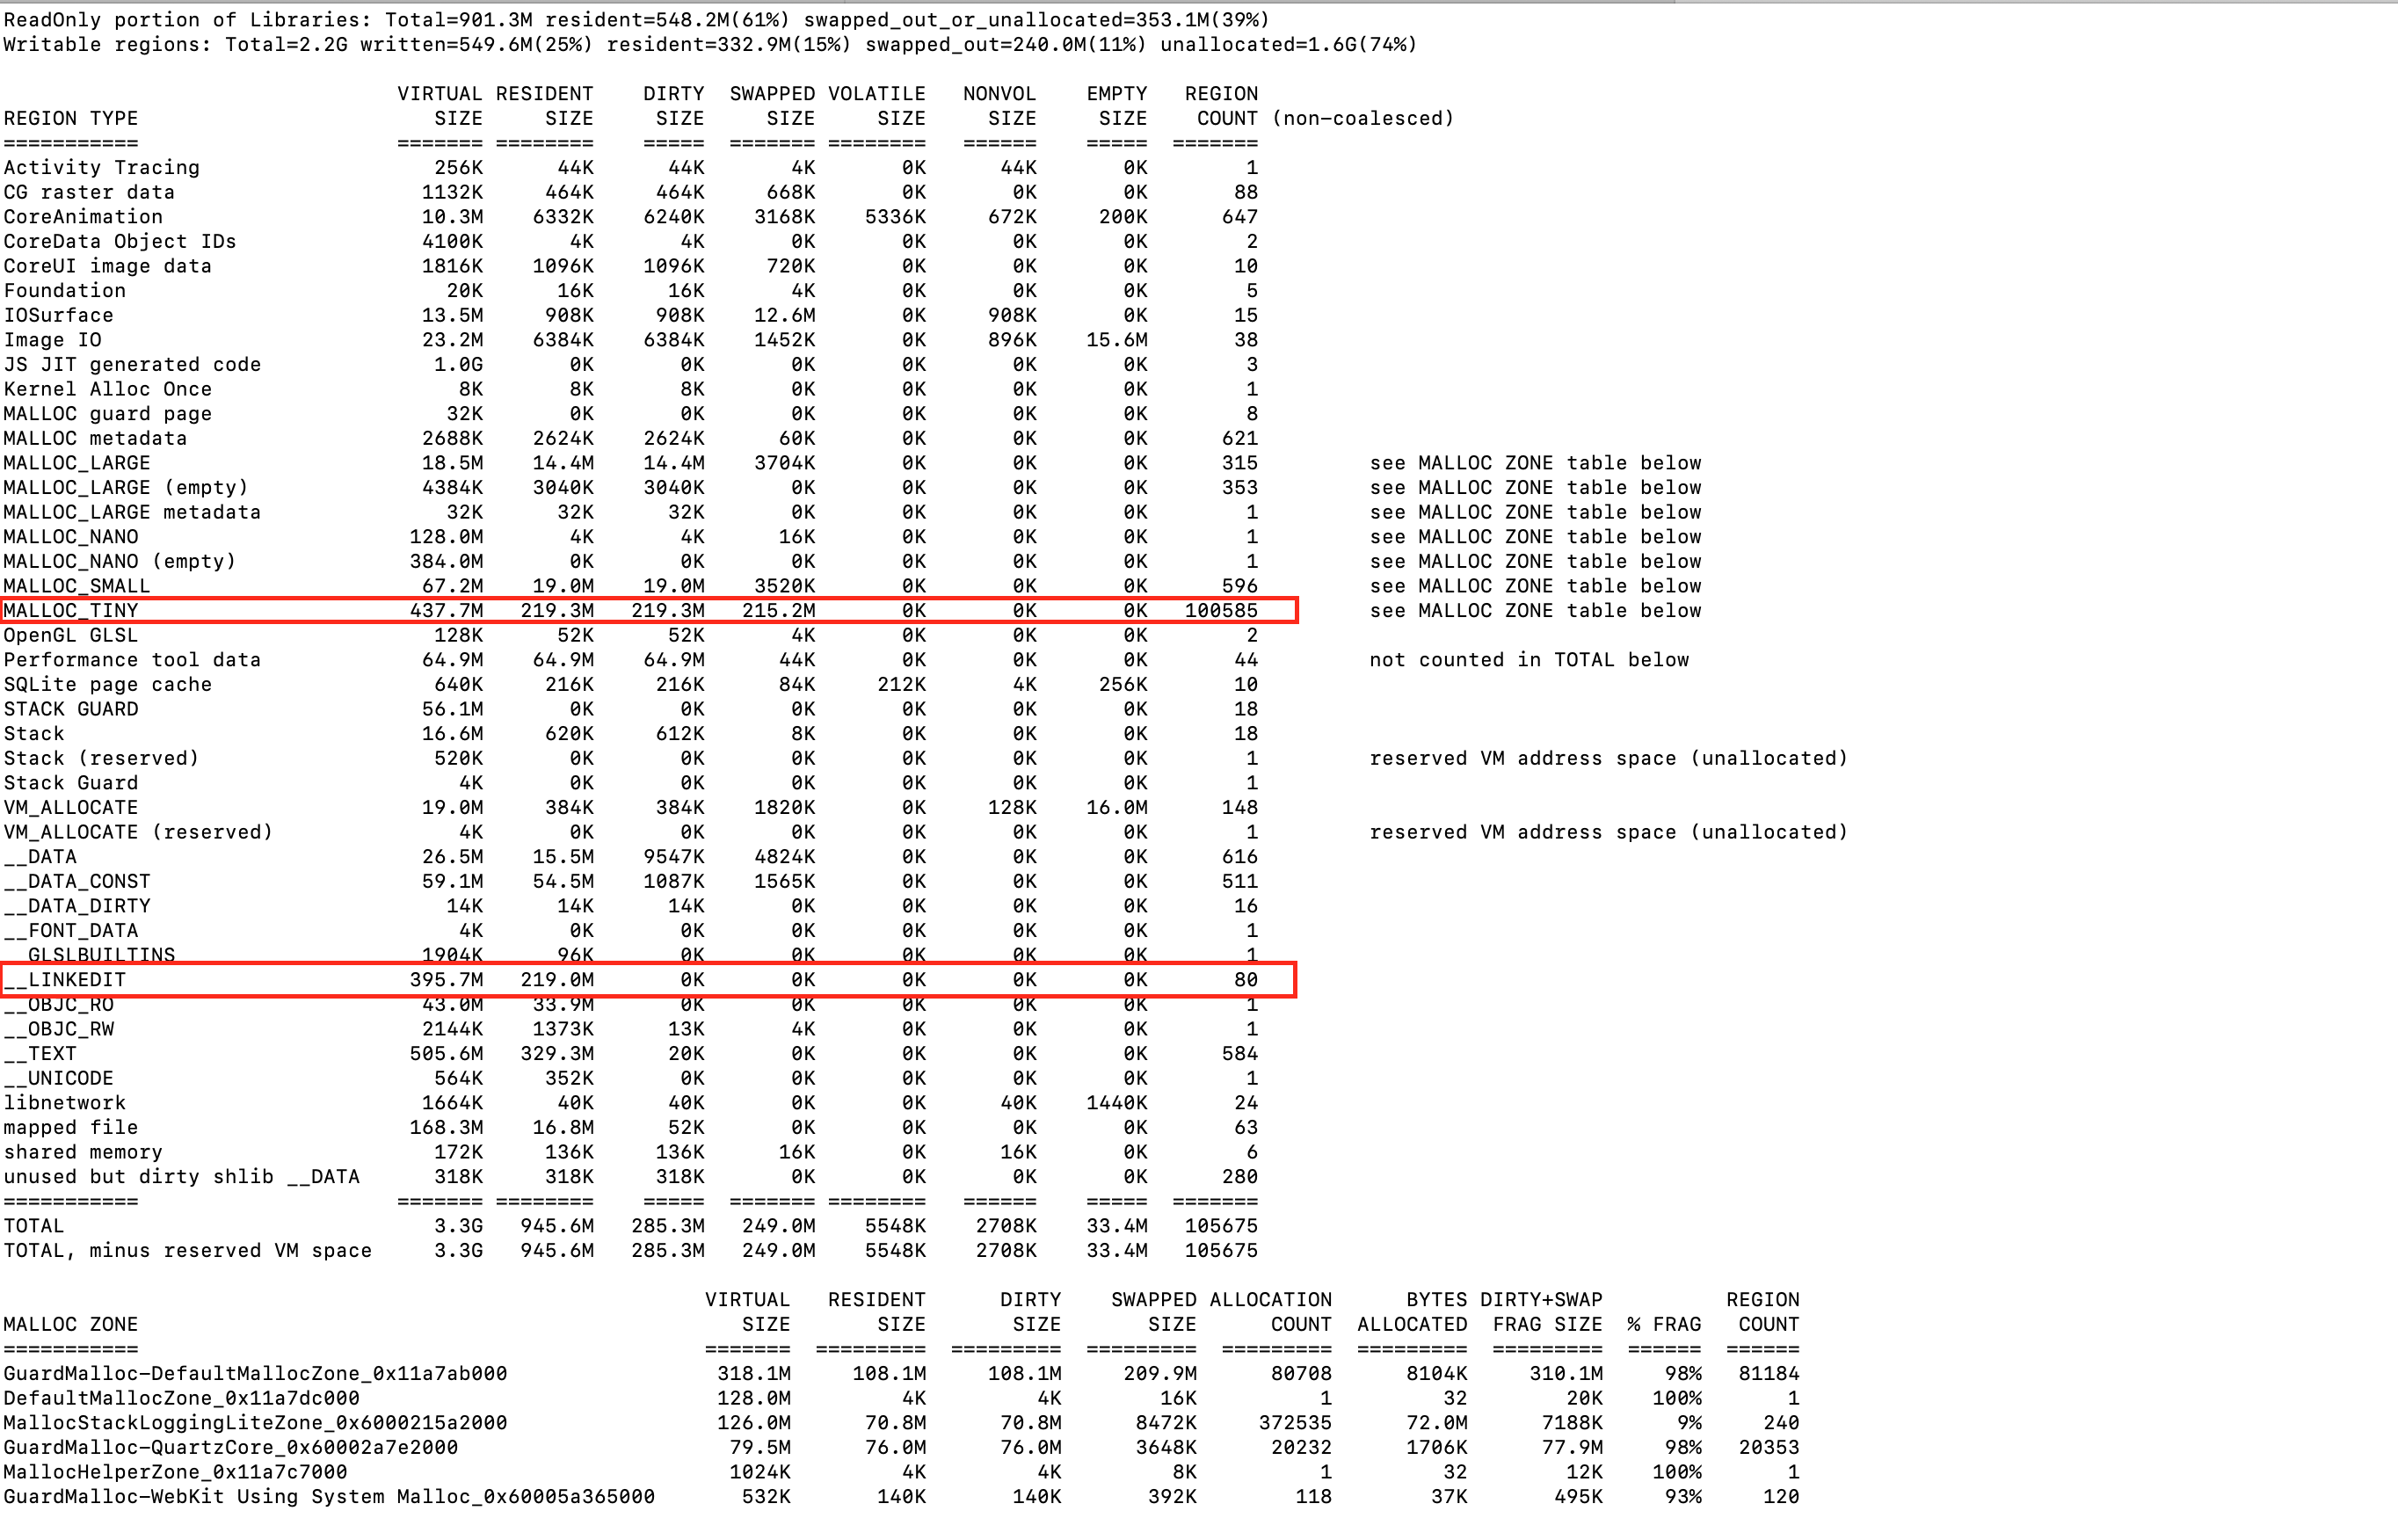
We see that MALLOC_TINY & __LINKEDIT are consuming 438MB. Let's use the verbose flag to see further details about the object
vmmap --verbose file_name.memgraph | grep "MALLOC_TINY"
Also, from the Xcode navigator, it is clear that the HDLocation with object address 0x60009d225f80 & 0x60009d226510 have leaks. So with the fullStacks method, let's see the backstrace of the objects.
malloc_history file_name.memgraph -fullStacks 0x60009d225f80 & malloc_history file_name.memgraph -fullStacks 0x60009d226510
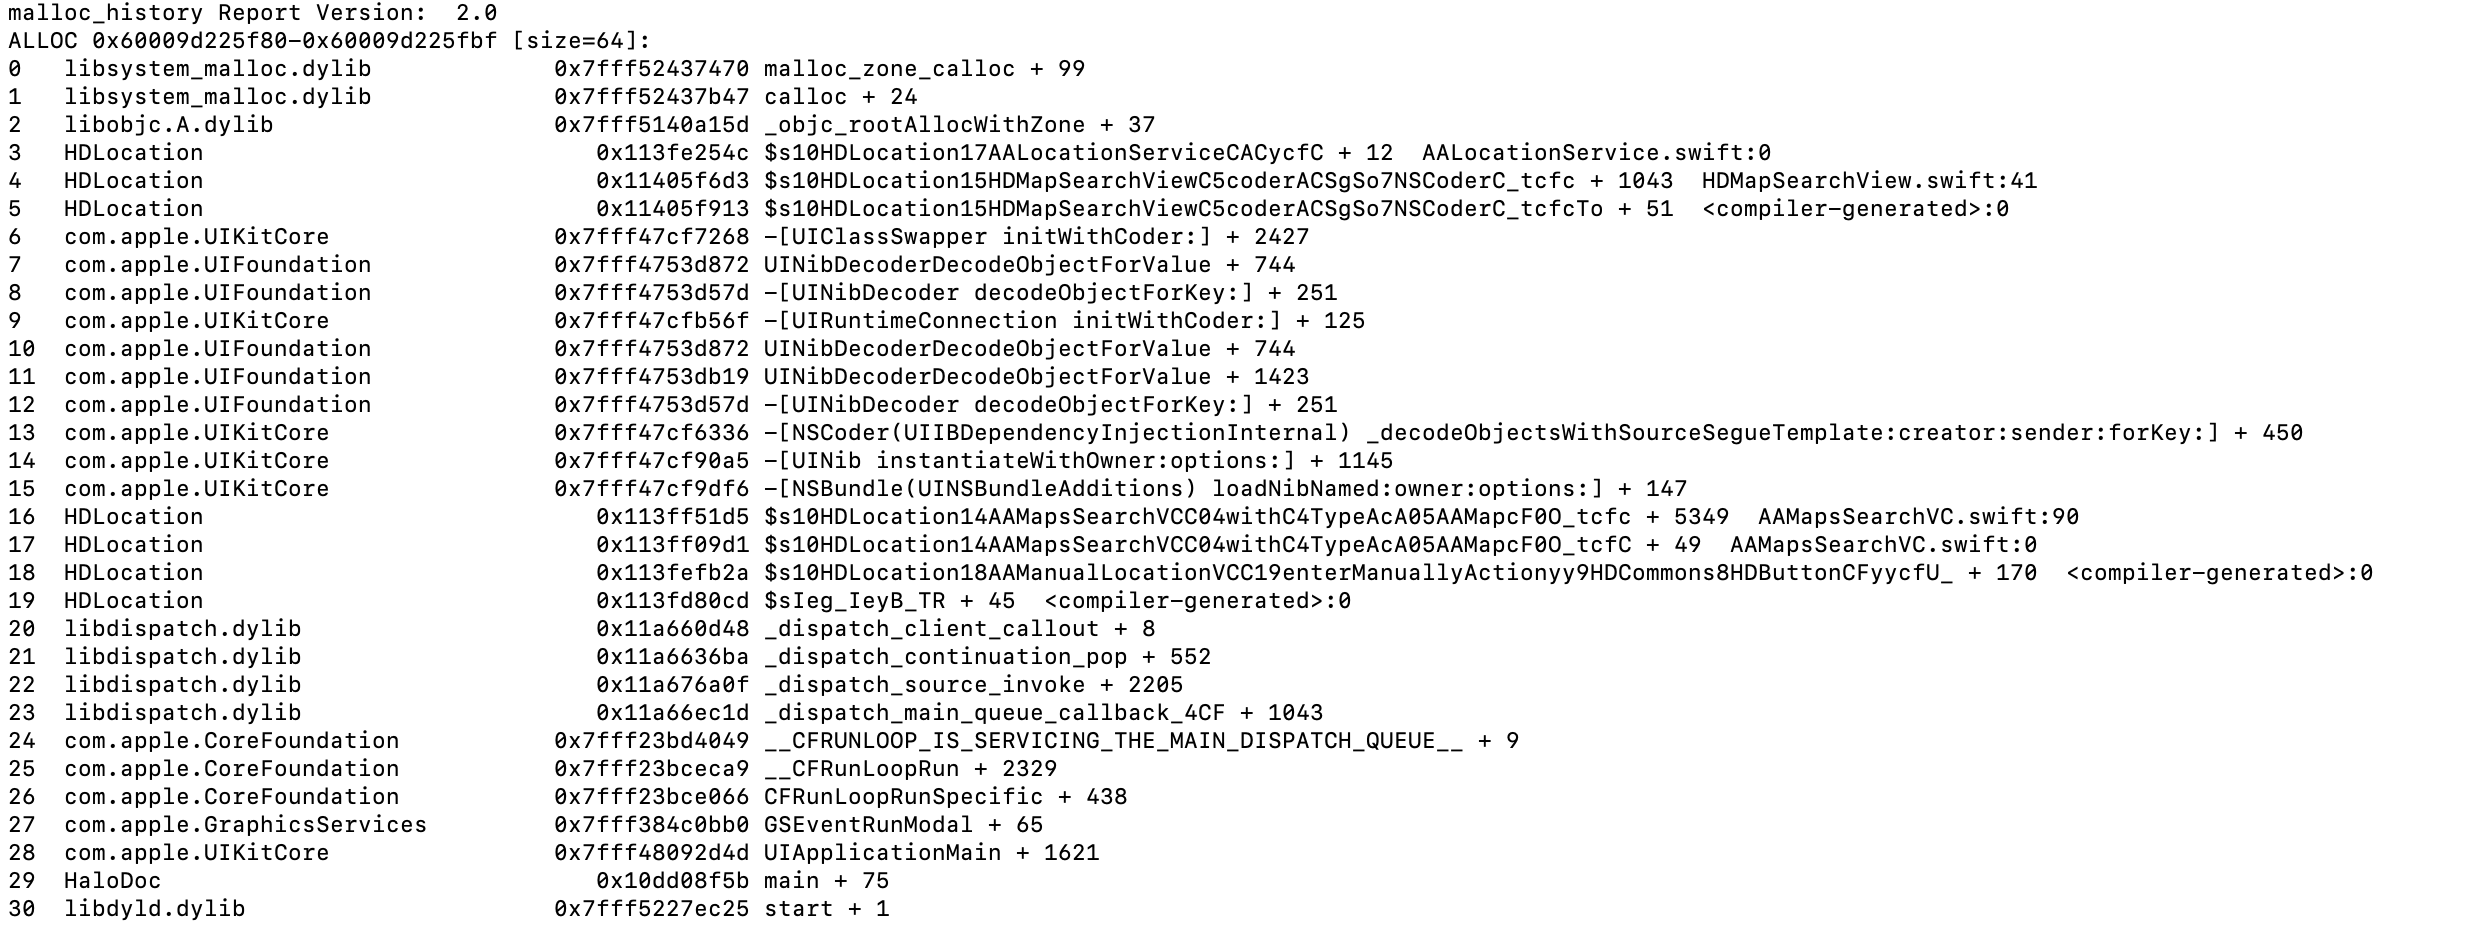
With this we can conclude that the vmmap & the Xcode navigator provides same information.
What's next after identifying the leaks?
At Halodoc, we raise the identified issue as a bug in Jira and attach the exported Memory graph with the steps / use case covered. Attaching the Memory graph is sufficient for debugging since this carries information about the Class / Pods / External Libraries with leaks. Once the Memory leaks are fixed, we can follow the same steps to verify the leaks. With this there’s also a significant observable smoothness in the app performance.
In addition to this, we can have a memory leak finder tool which helps the team in identifying the leaks at the development and testing phase within the sprint itself. One such tool we evaluated at Halodoc is the MLeaksFinder. This is an open source tool which is easy to integrate with the source code.
MLeaksFinder:
- Open source tool
- Easy to integrate with the source code
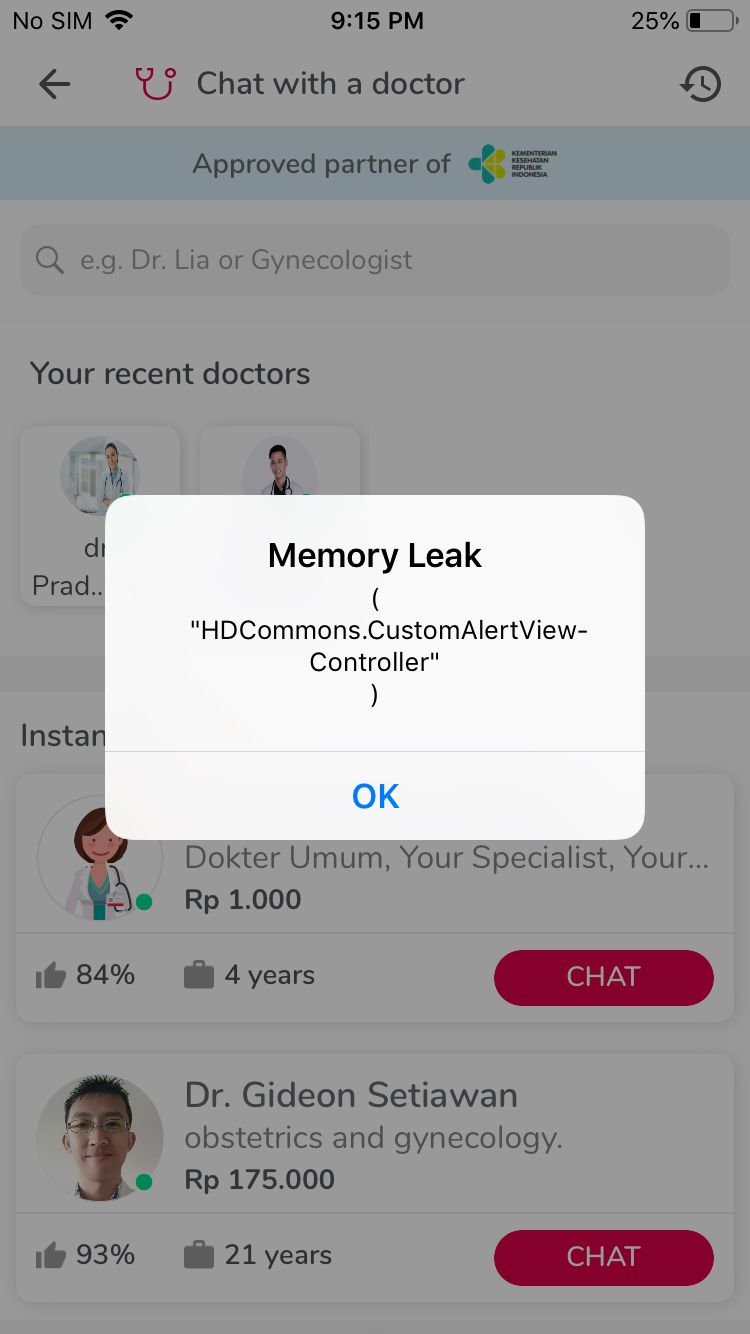
- It shows an alert whenever it detects a leak with a class name.
- No need to add any single line of code
Once the tool is integrated, QA can perform the regular business flows and if there are any memory leaks observed, the memoryLeak alert is shown.
Conclusion
By identifying and fixing the memory leaks in the app, we observed that the app performance has improved which increases the app quality. In this article we’ve covered how to use the memory graph debugging to find your memory leaks. It’s a great tool that will help you find those elusive leaks and make your apps more robust.
About Halodoc
Halodoc is the number 1 all around Healthcare application in Indonesia. Our mission is to simplify and bring quality healthcare across Indonesia, from Sabang to Merauke.
We connect 20,000+ doctors with patients in need through our Tele-consultation service. We partner with 1500+ pharmacies in 50 cities to bring medicine to your doorstep. We've also partnered with Indonesia's largest lab provider to provide lab home services, and to top it off we have recently launched a premium appointment service that partners with 500+ hospitals that allows patients to book a doctor appointment inside our application.
We are extremely fortunate to be trusted by our investors, such as the Bill & Melinda Gates foundation, Singtel, UOB Ventures, Allianz, Gojek and many more. We recently closed our Series B round and In total have raised USD$100million for our mission.
Our team work tirelessly to make sure that we create the best healthcare solution personalised for all of our patient's needs, and are continuously on a path to simplify healthcare for Indonesia. We are always looking out to hire for all roles for our tech team. If challenging problems that drive big impact enthral you, do reach out to us at careers.india@halodoc.com