NewRelic custom integration for MySQL RDS
Introduction
In the fast-paced world of healthcare technology, particularly at Halodoc, database performance is paramount. Slow queries can significantly degrade application responsiveness, leading to frustrated users, in our domain, potentially impacting critical services. Traditionally, monitoring these elusive performance bottlenecks often involved sifting through verbose CloudWatch logs—a process that can be both time-consuming and costly.
By centralizing our slow query data in New Relic, Halodoc aimed to gain unprecedented visibility into our database performance, enabling our teams to quickly identify and address performance bottlenecks—ultimately leading to a more robust and responsive system for our users.
To support this, we made a strategic decision to move away from AWS CloudWatch for slow query monitoring and adopt New Relic. This migration was driven by the need for significant cost reduction (approximately 95% savings over cloudwatch logs), structured and easily parsed logs, and simplified observability tailored to teams and applications.
Why Move Away from CloudWatch?
While AWS CloudWatch is a robust monitoring service, it has several limitations when it comes to slow query monitoring:
- Cost Considerations: CloudWatch’s pay-per-use model leads to high costs due to log ingestion, storage, limited retention, and frequent dashboard queries, especially in high-volume database environments.
- Limited Query Analysis: CloudWatch offers only basic alerting and visualization, lacks AI-driven insights, and provides minimal support for in-depth query performance analysis or optimization.
- Operational Challenges: CloudWatch requires complex setup for log parsing, lacks seamless correlation between slow queries and application metrics, and results in fragmented monitoring across systems.
Features of New Relic Infrastructure Agent
New Relic offers several advantages for database monitoring:
- Cost Optimization: Provides predictable, fixed pricing at approximately $0.35/GB based on ingestion volume, along with efficient data compression that reduces storage costs. It also offers a unified platform for monitoring infrastructure, applications, and databases. For a medium-scale enterprise with 80–100 MySQL RDS instances, the total ingested log volume typically amounts to around 1.3 GB per month, making it a highly cost-effective solution.
- Enhanced Visualization: Enables rich, customizable dashboards with a drag-and-drop interface, supports team-based access control for tailored views, and integrates advanced alerting with multi-channel notifications.
- Integration Capabilities: Enables direct correlation between slow queries and application performance, provides a holistic view across infrastructure and applications, and supports seamless integration with popular DevOps tools.
Implementation Details
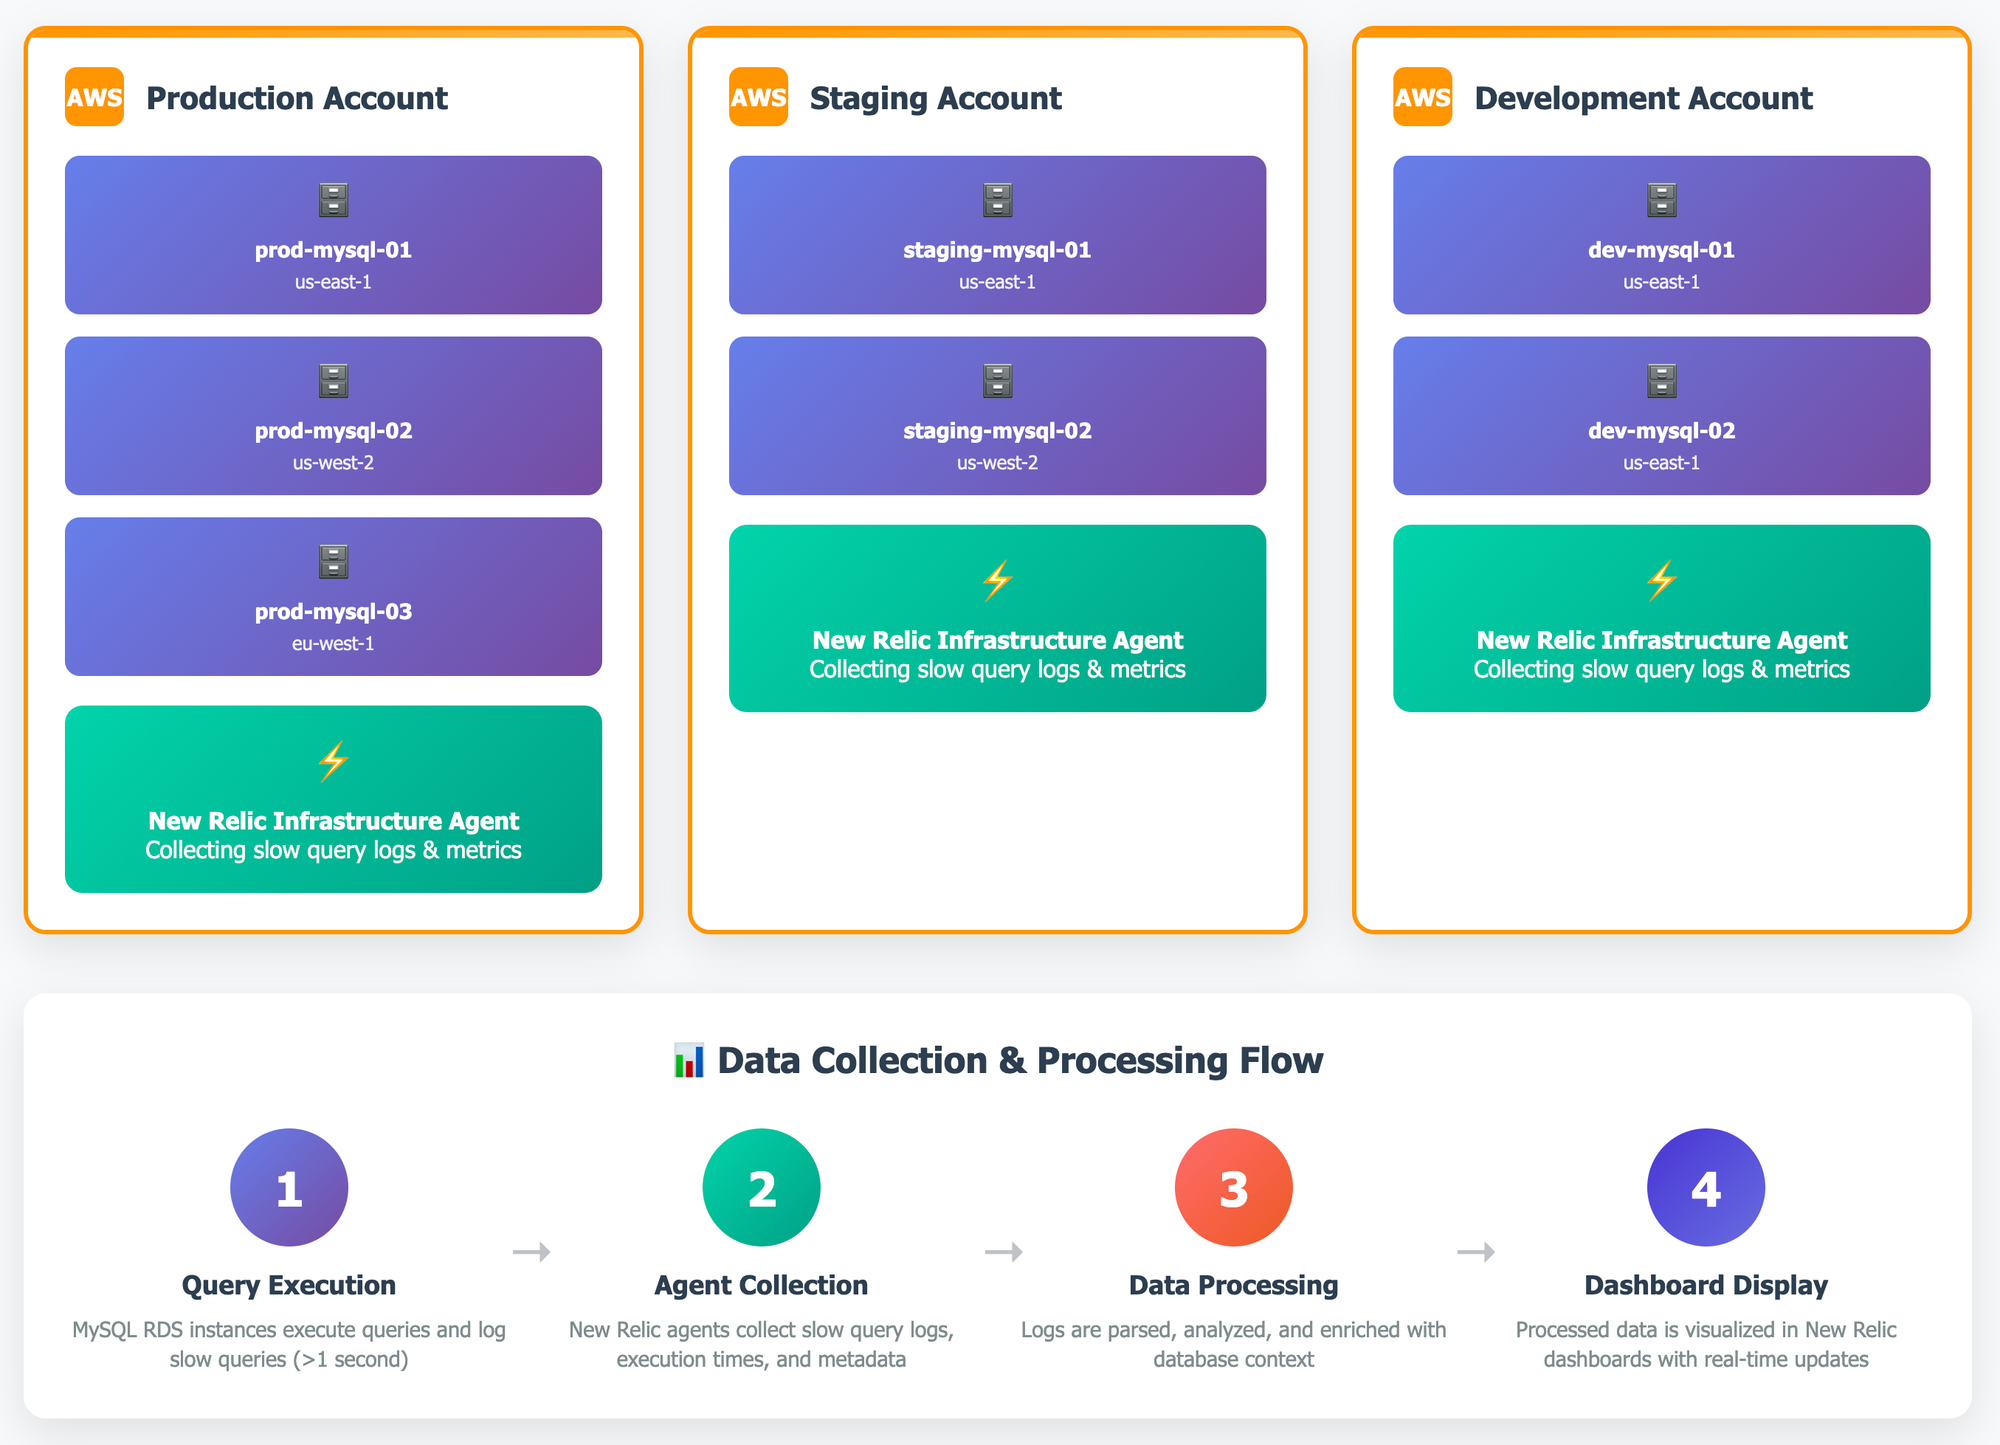
The entire implementation was broken down into 3 stages so that we can get optimal results.
- Pre-Implementation Stage: This stage involves steps to ensured access to RDS, New Relic, and EKS, and preparing all the required credentials. We also included monitoring scope, team-specific dashboards designs, and plan out the the schedule necessary for implementing the RDS configuration changes.
- Implementation Stage: In this stage, we enabled slow query logging on each of the RDS instances and deployed the New Relic agent using Helm with a secure, custom-configured
values.yaml. We also set up encrypted secrets and synthetic monitoring for enhanced visibility. - Post-Implementation Stage: In this stage, we have validated data ingestion, alert accuracy, and dashboard functionality. We are also optimizing performance by fine-tuning collection settings and configuring dashboards for long-term observability.
Pre-Implementation Stage
This stage involves the following steps:
- Access Requirements: Ensure AWS RDS administrative access, a New Relic account with the appropriate licensing, and access to the EKS cluster for agent installation.
- Planning Considerations: Identify all RDS instances that need monitoring, define team-specific log groupings, determine dashboard requirements for each team, and schedule maintenance windows for necessary RDS parameter changes.
- Prerequisites: Ensure MySQL RDS instances are running and accessible, verify network connectivity between the EKS cluster and RDS, and have the New Relic license key available.
Implementation Stage
We will start by enabling slow query logging on RDS by modifying key parameters and rebooting the instance. Deploy the New Relic Infrastructure agent using Helm for repeatable, version-controlled setup, supported by a secure and encrypted credentials strategy. Add the New Relic Helm repository, create a tailored values.yaml for your RDS instances, and deploy the bundle. Advanced configuration allows scalable integration using secrets, custom attributes, and forwarding-only mode. Implement synthetic monitoring to enhance historical slow query visibility.
Configure MySQL Slow Query Logging
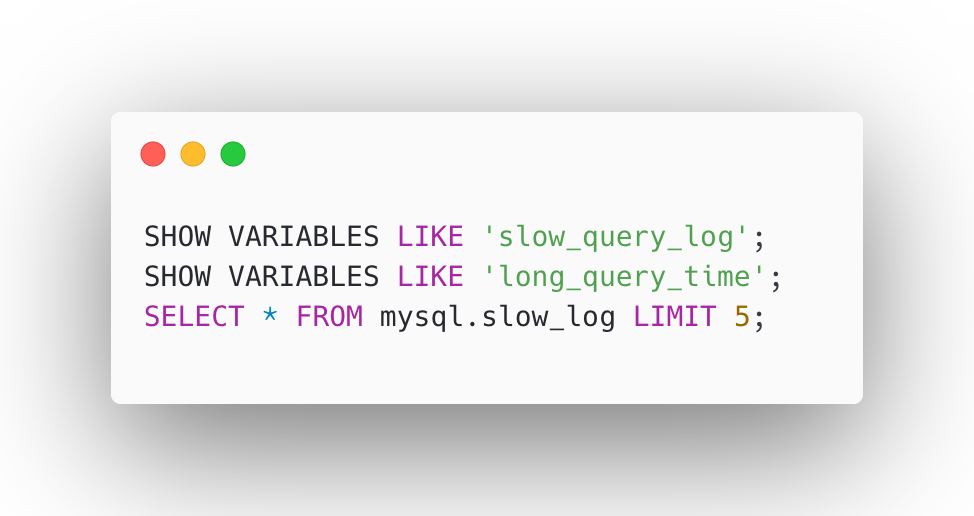
To configure slow queries in RDS, we have to modify the RDS parameter group by setting slow_query_log = 1, long_query_time = 1, and log_output = TABLE to enable slow query logging. After making these changes, navigate to the AWS RDS Console, select your MySQL instance, and apply the modified parameter group. A reboot of the RDS instance is required for the changes to take effect.
These commands will confirm that slow query logging is enabled, the correct threshold is set, and that slow queries are being recorded in the mysql.slow_log table.
Once the instance has restarted, verify the configuration using the following SQL commands:
Install New Relic Infrastructure Agent
For Kubernetes environments, deploying New Relic with Helm charts offers a streamlined, repeatable, and configurable installation process. Helm simplifies the deployment of complex applications by managing all resources through version-controlled templates, making it easy to customize settings like license keys, namespaces, and MySQL slow query integrations via a values.yaml file. This approach ensures consistency across environments and enables faster rollouts and upgrades.
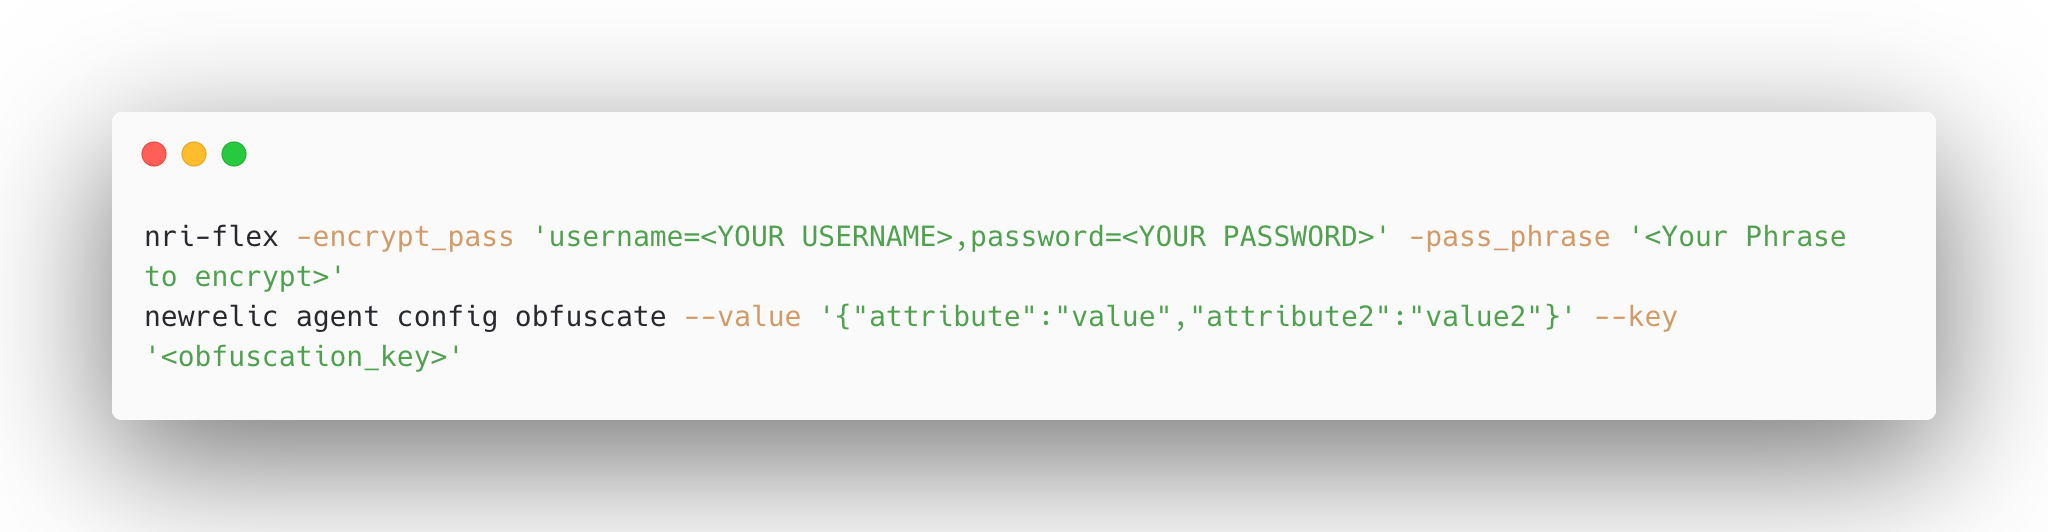
- Encrypting DB username and password
We do not store the database username and password in plain text within values.yaml. Instead, the password is encrypted using New Relic-supported encryption and then obfuscated before being stored as a Kubernetes Secret. This approach ensures the credentials remain highly secure. We have used below method to encrypt the password -
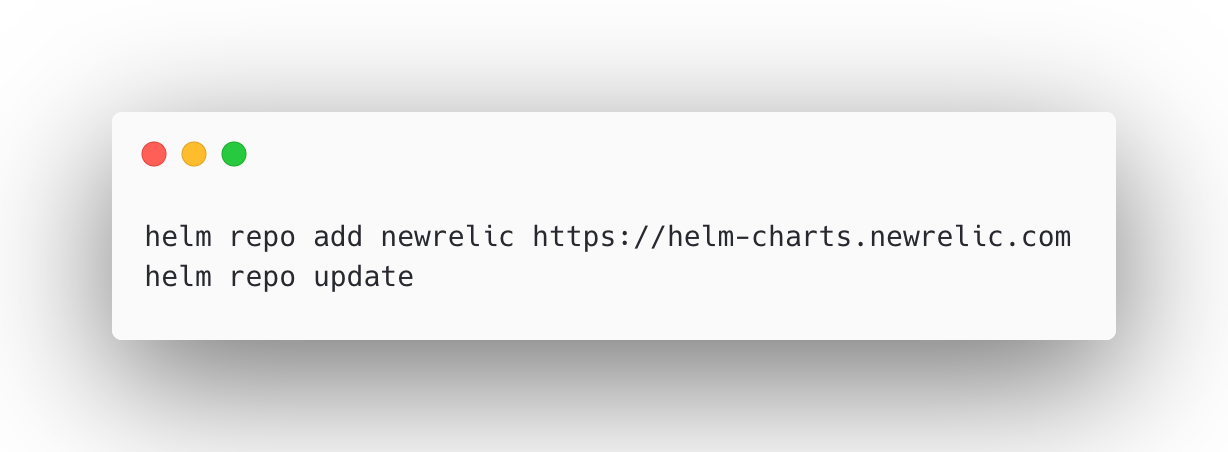
- Add New Relic Helm Repository
To install New Relic components via Helm, first add the official New Relic Helm chart repository and update your local chart index to ensure access to the latest versions.
- Create Values File
Define a customvalues.yamlfile to configure the New Relic Infrastructure agent and Flex integration for MySQL slow query monitoring. This file includes EKS namespace settings, license key and secret references, resource limits, and detailed MySQL query configurations for multiple RDS endpoints.
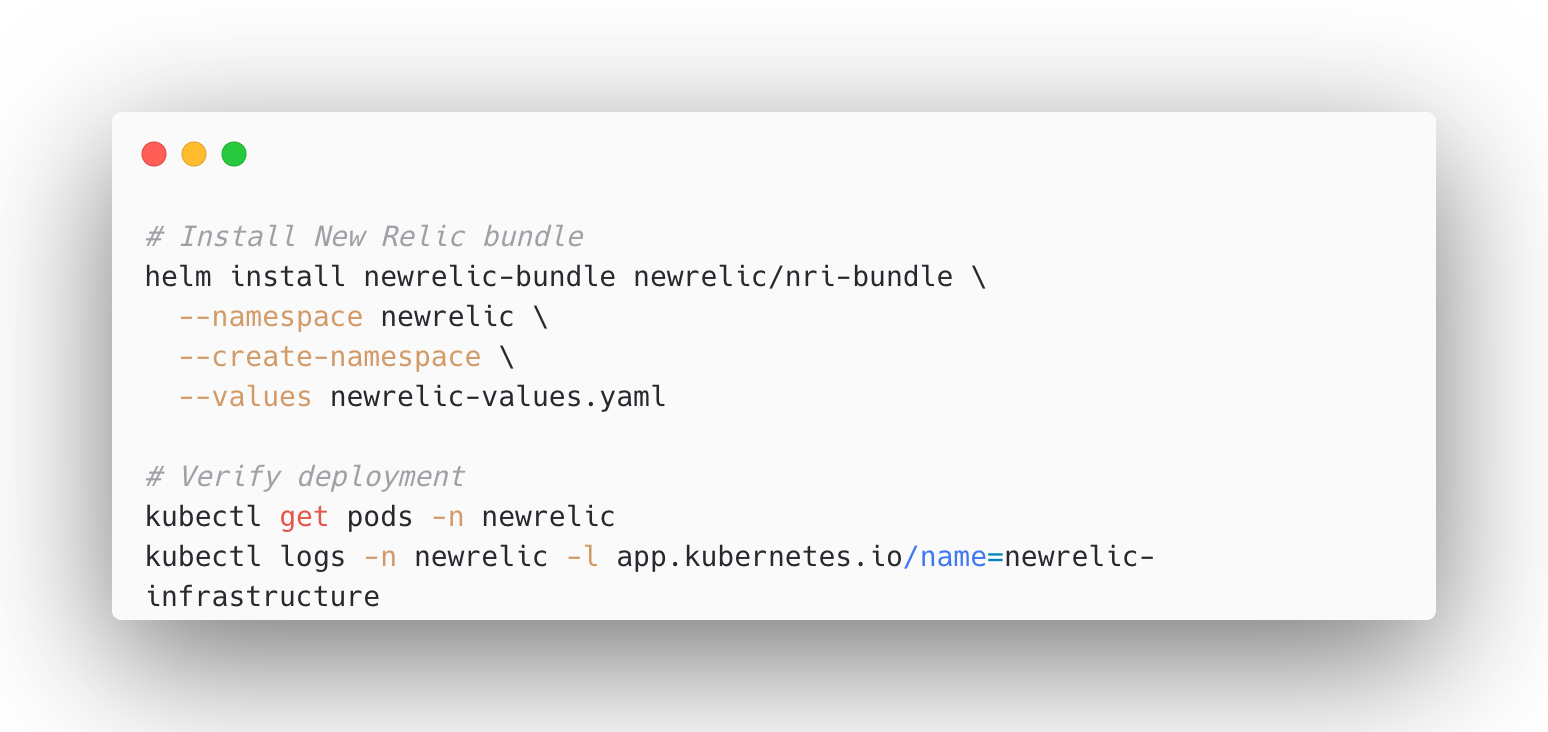
- Deploy Using Helm
Use Helm to install the New Relic Infrastructure bundle with your customvalues.yamlfor MySQL slow query monitoring. Post-deployment, verify that the pods are running and logs indicate successful agent initialization.
- Deployment for Advanced Configuration
This Kubernetes Deployment sets up the New Relic Infrastructure agent in an advanced configuration mode within an EKS cluster. It uses secure environment variables, secret-based credentials, and a mounted config map to enable fine-grained control, forwarding-only telemetry, and scalable integration management.
- Create synthetic monitoring
To enable consistent visibility into slow queries across each service on a weekly basis, we’ve implemented synthetic monitoring that retrieves data from the primary slow query log group every week. This setup helps us overcome the limitations of NRQL when dealing with historical or grouped data. The collected data is then pushed into a separate, structured log group, allowing for better aggregation and analysis. As a result, we now have a more refined and focused view of our P0 (high-priority) queries, improving our ability to troubleshoot and optimize database performance.
Post-Implementation Stage
This stage involves the following steps to verify data ingestion, validate alerts and dashboards, and optimize monitoring through tuned settings and customized visualizations for effective slow query analysis.
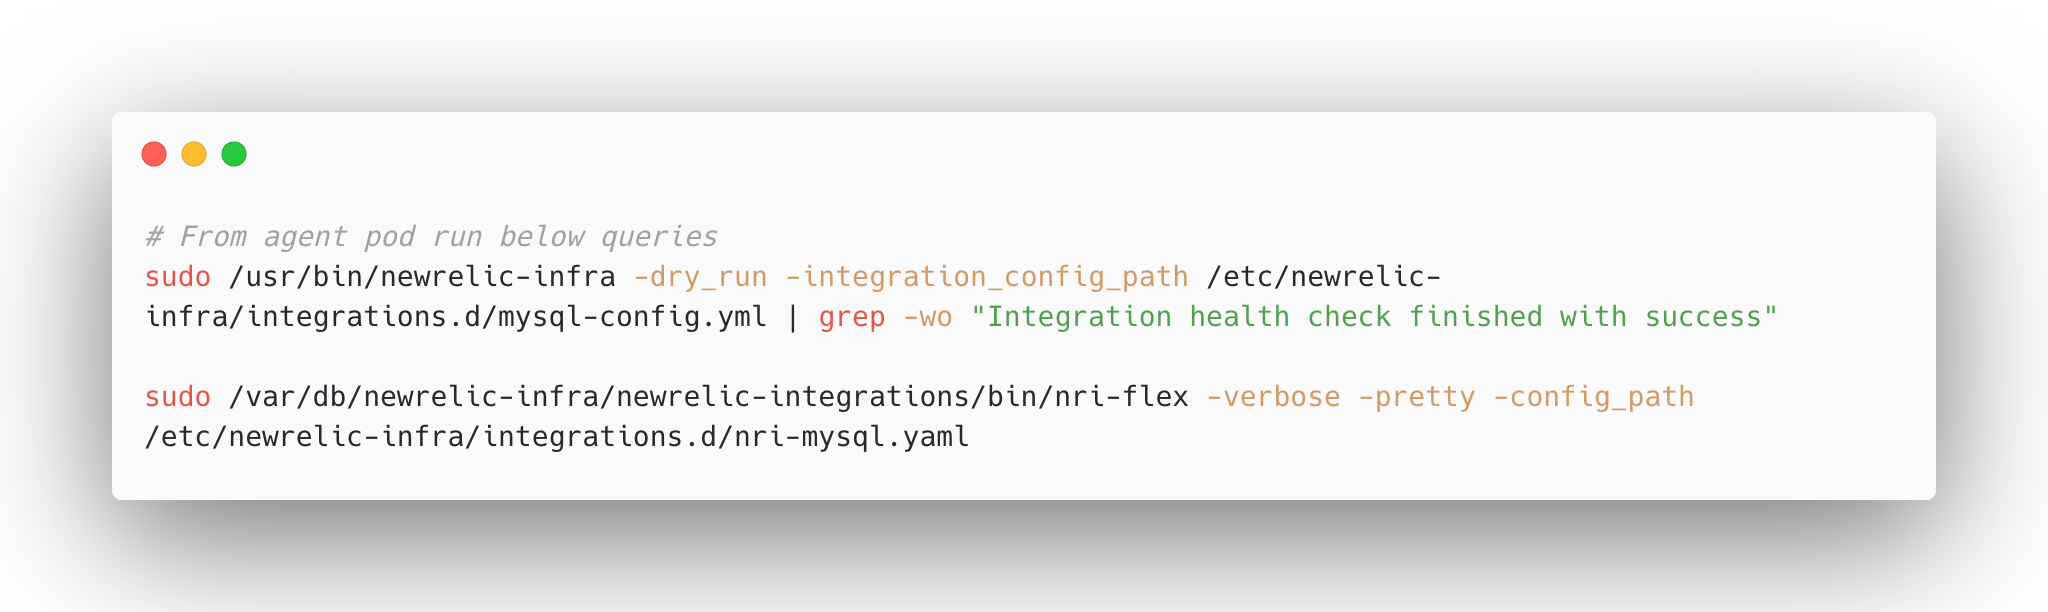
- Verification and Testing
Verify data collection by checking that slow query logs are being captured in New Relic, ensuring data is consistently ingested from RDS and accurately reflects query performance. Next, test the alert configurations by creating controlled scenarios that generate slow queries to ensure alerts are triggered appropriately. Then, validate the dashboard functionality by confirming that all widgets display the expected data accurately and update in real-time, reflecting ongoing query performance metrics.
Enhance performance, by adjusting the data collection intervals to suit your system’s query volume and performance requirements. Then, optimize query filters to focus on the most critical slow queries, helping reduce noise and improve clarity. Lastly, configure appropriate data retention policies to balance the need for historical analysis with storage cost efficiency.
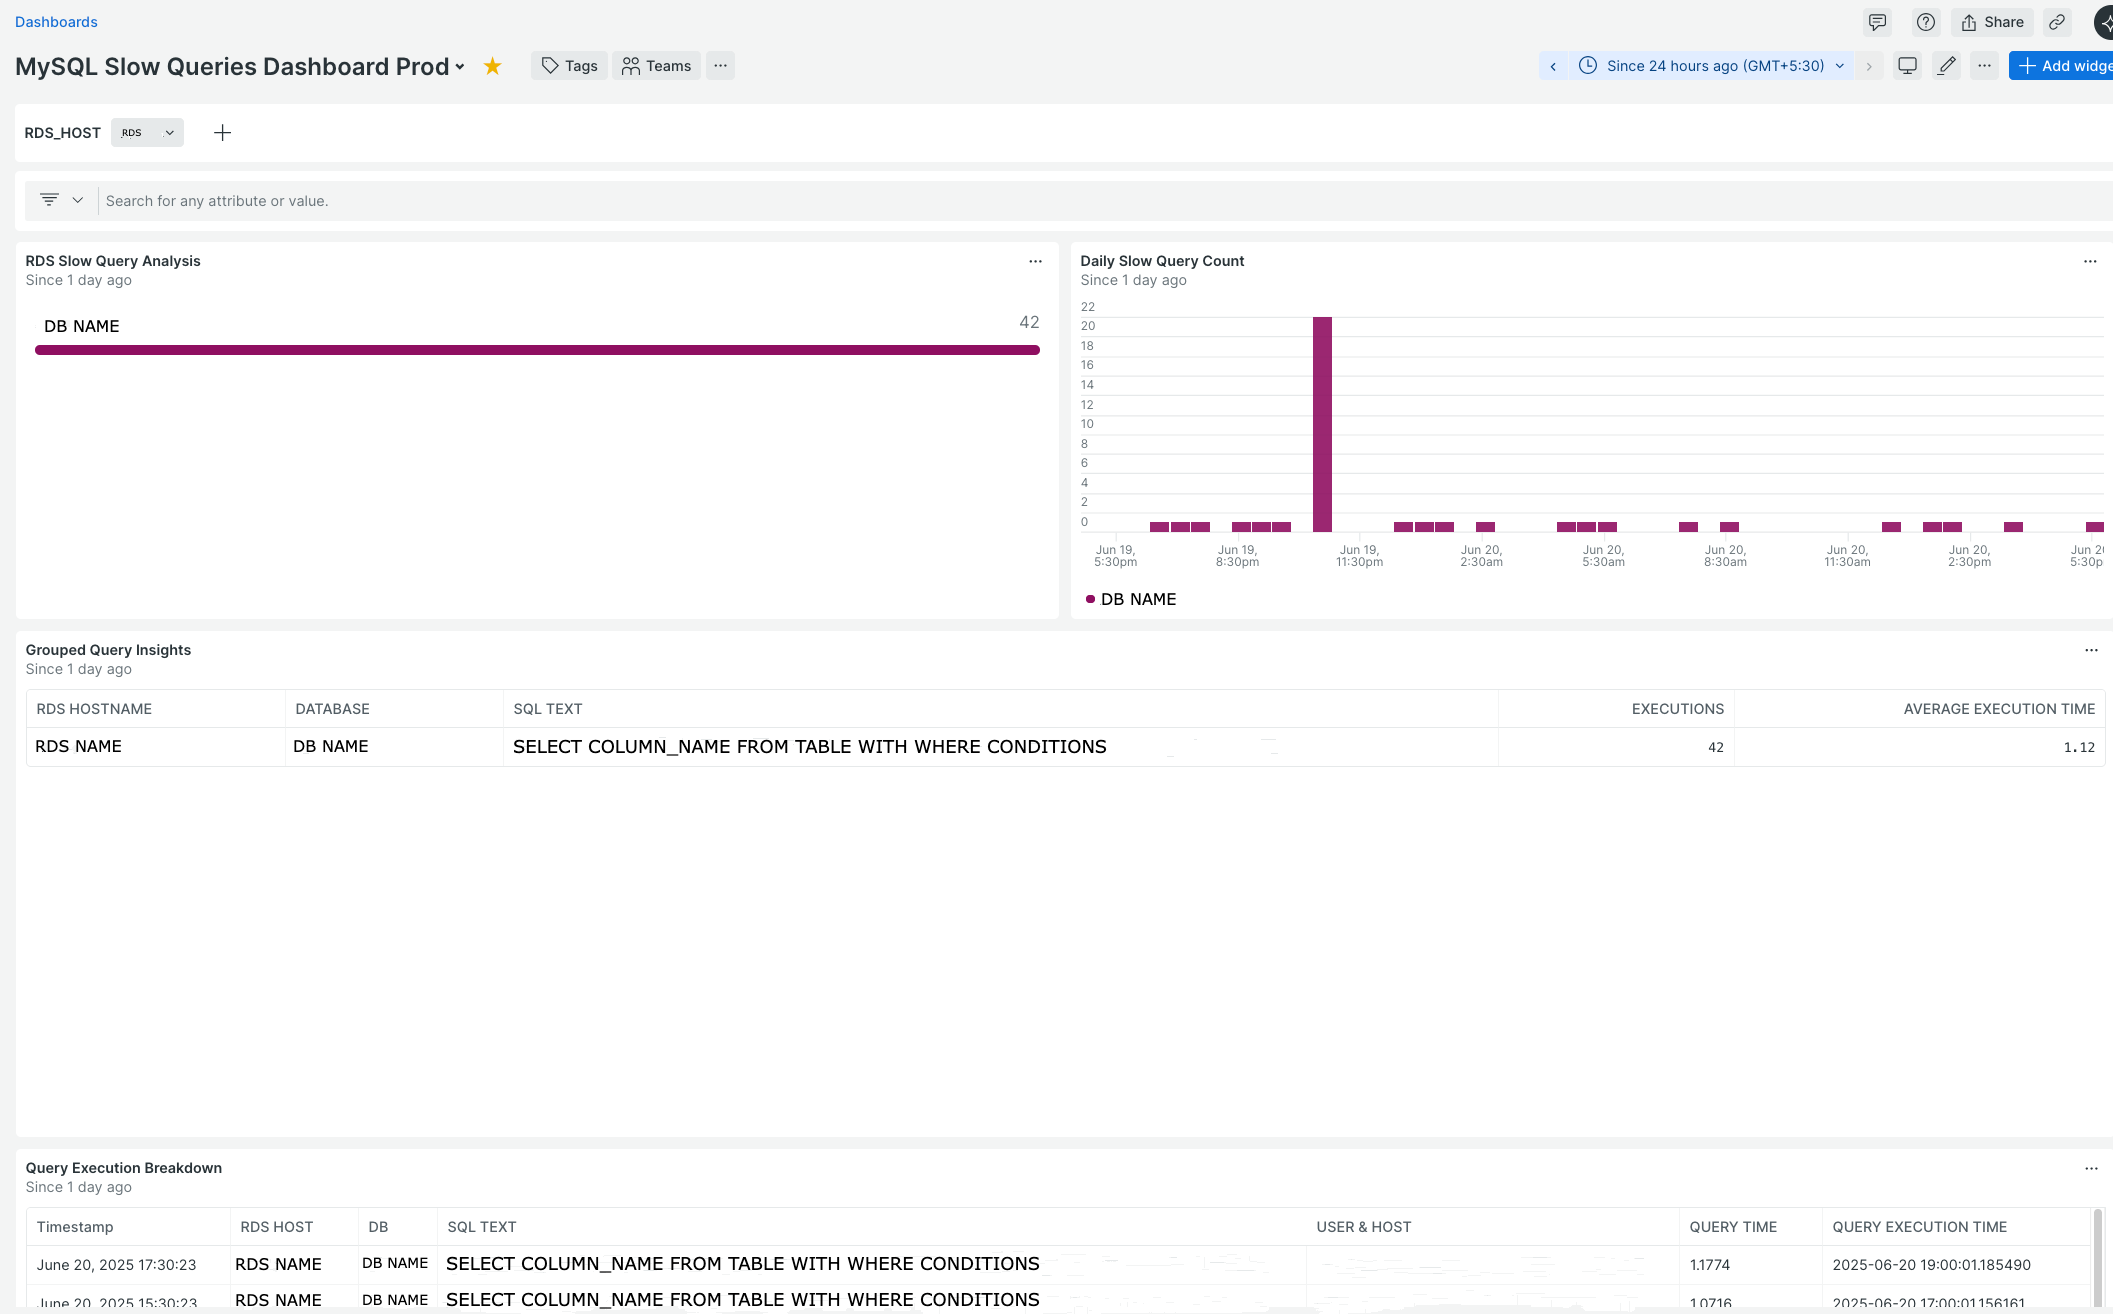
- Dashboard Configuration
The following New Relic dashboard JSON provides comprehensive visualization of your MySQL slow query data:
Best Practices and Recommendations
Adopt the following best practices during your implementation in order to ensure Security, Performance & Monitoring.
- Security Considerations
For security considerations, use dedicated monitoring user with the minimal permissions required to collect slow query data, avoiding the use of admin-level credentials. Ensure that New Relic agents have access only to the necessary database endpoints by enforcing strict network security rules. Additionally, enable SSL/TLS for all database connections to protect data in transit. - Performance Optimization
Implement intelligent query sampling to minimize overhead on high-traffic systems by focusing only on queries that exceed defined thresholds for duration or resource usage. Additionally, monitor the impact of the monitoring agent on system resources and adjust data collection intervals accordingly to ensure minimal performance disruption while maintaining visibility. - Maintenance and Monitoring:
Set up alerts to monitor agent connectivity and detect any data collection issues, and regularly review agent logs for errors or warnings to ensure continuous monitoring reliability. Additionally, maintain dashboards by periodically reviewing and updating queries for relevance, and archiving or removing outdated visualizations to keep insights focused and accurate.
Conclusion
Migrating from CloudWatch to New Relic for MySQL slow query monitoring provides significant advantages in terms of cost optimization, advanced analytics, and AI-powered insights. The implementation process, while requiring careful planning and configuration, results in a more powerful and flexible monitoring solution.
The key benefits realized from this migration include:
- Cost Reduction: More predictable pricing model that delivers better value for high-volume logging, enabling approximately 95% cost reduction compared to CloudWatch logs.
- Enhanced Visibility: Rich dashboards and visualizations offer enhanced visibility and deeper insights into database performance. It also provides developers with the single interface to identify slow performing queries and correlate it with specific and bad performing APIs.
- Scalability: Provides scalable support for expanding infrastructure and growing data volumes, ensuring consistent performance monitoring and visibility as system complexity and workload increase.
About Halodoc
Halodoc is the number one all-around healthcare application in Indonesia. Our mission is to simplify and deliver quality healthcare across Indonesia, from Sabang to Merauke.
Since 2016, Halodoc has been improving health literacy in Indonesia by providing user-friendly healthcare communication, education, and information (KIE). In parallel, our ecosystem has expanded to offer a range of services that facilitate convenient access to healthcare, starting with Homecare by Halodoc as a preventive care feature that allows users to conduct health tests privately and securely from the comfort of their homes; My Insurance, which allows users to access the benefits of cashless outpatient services in a more seamless way; Chat with Doctor, which allows users to consult with over 20,000 licensed physicians via chat, video or voice call; and Health Store features that allow users to purchase medicines, supplements and various health products from our network of over 4,900 trusted partner pharmacies. To deliver holistic health solutions in a fully digital way, Halodoc offers Digital Clinic services including Haloskin, a trusted dermatology care platform guided by experienced dermatologists.
We are proud to be trusted by global and regional investors, including the Bill & Melinda Gates Foundation, Singtel, UOB Ventures, Allianz, GoJek, Astra, Temasek, and many more. With over USD 100 million raised to date, including our recent Series D, our team is committed to building the best personalized healthcare solutions — and we remain steadfast in our journey to simplify healthcare for all Indonesians.