Optimizing Analytics: Visualizing Metabase and Looker Usage Patterns
At Halodoc, data is at the heart of how we simplify healthcare and drive informed decision-making. Our organization relies on Business Intelligence (BI) tools like Looker and Metabase to access insights that support everything from strategic planning to daily operations. Daily, these tools generate 10's of thousands of queries to our Amazon Redshift data warehouse, highlighting the scale and importance of reliable data access.
With such high demand, maintaining query performance and data quality is critical. Users expect fast and accurate data because delays or errors can compromise important decisions. That’s why we’ve built a monitoring system that not only tracks query execution but also considers the full context of how data is consumed through dashboards and reports.
In this blog, we will walk through how we monitor query performance from end to end, covering ingestion, transformation, and final delivery through BI tools. We will show how Redshift system logs are combined with metadata from Looker and Metabase, enabling us to analyze performance in the context of actual user behavior. This observability helps us continuously optimize both our platform and our users’ experience with data.
A High-Level Summary of Our Data Processing Flow
At Halodoc, we ingest data from various sources, including internal systems and third-party platforms, using API integrations and AWS DMS for database replication. This data lands in our S3-based data lake, where Apache Hudi handles initial processing such as schema transformation, data typing, and partitioning to prepare it for analytics.
The processed data is then refined further with Apache Spark and loaded into Amazon Redshift, where it’s structured for reporting and analysis. Our BI team builds curated tables from this data, which are then visualized through Looker and Metabase to support business decisions. For a deeper look into our platform design, you can refer to our blog on data platform architecture and presentation layers.
As data engineers, we treat data as a product and user experience matters. Monitoring the data pipeline isn’t enough. We also need visibility into how data is accessed through BI tools. While Redshift’s system tables offer useful performance metrics, they lack context around dashboard usage and user behavior. That’s why we built a deeper monitoring layer that bridges Redshift metrics with backend data from Looker and Metabase to providing a complete picture of performance and user engagement.
Why Redshift System Tables Alone Aren’t Enough for BI Monitoring
Every query executed on Amazon Redshift is automatically logged and can be accessed through its built-in system monitoring tables. These tables provide valuable insights into query performance and system activity. Some of the most commonly used system tables include:
stl_query: Captures comprehensive details about all queries executed on Redshift. This includes who ran the query (whether a BI tool or an analyst), the start and end times, the exact query text, and even which cluster the query was executed on.svv_table_info: Provides metadata and storage statistics for all user-defined tables in Redshift. This includes information such as the number of rows, estimated size, unsorted rows, skew, and compression ratio—helpful for diagnosing storage and performance issues.svcs_query_summary: Offers summarized performance data for each query, including the number of rows returned and the total data scanned. This helps in identifying expensive or inefficient queries at a glance.
Redshift also offers many other system views to help monitor and analyze database activity. A complete reference can be found in the official AWS documentation.
However, when it comes to monitoring BI tools specifically, relying solely on Redshift’s system tables falls short. These views provide great technical insights, but lack the contextual visibility needed to understand user behavior within the BI Tools. For example:
- They don’t reveal which specific dashboard or BI visualization triggered a query.
- They can’t identify which question or report (e.g., in Metabase) initiated the database call.
- They don’t provide visibility into who triggered the query from within the BI tool, especially in environments with shared service accounts.
This limited visibility makes it difficult to fully understand how BI tools are being used and how query performance impacts user experience. To bridge this gap, additional monitoring at the BI tools is essential.
BI Tool Monitoring System
At Halodoc, we use both Looker and Metabase to support a wide range of analytical and reporting needs. To effectively monitor their usage and performance, we go beyond Redshift’s system tables by tapping into the backend databases of each BI tool. These databases hold valuable metadata about user activity, dashboard interactions, and query execution details—insights that are not available from Redshift alone.
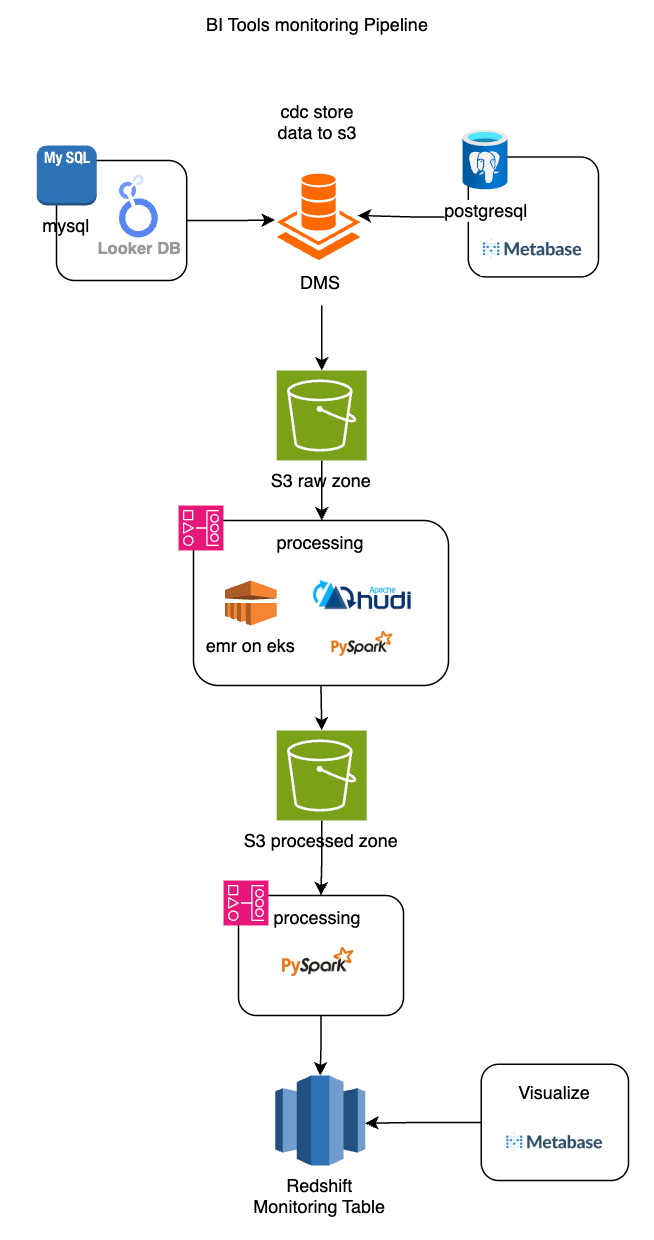
To integrate this monitoring into our platform, we built a pipeline that mirrors our core data architecture. Using AWS DMS, we replicate data from Looker’s MySQL and Metabase’s PostgreSQL databases into our Amazon S3-based data lake. From there, Apache Spark transforms and refines the data, ensuring it's standardized, partitioned, and analytics-ready. The processed data is then loaded into Amazon Redshift, where it powers internal monitoring tables.
These monitoring tables are visualized via Metabase dashboards, giving our teams clear visibility into BI tool activity. This setup allows us to track usage trends, identify performance issues, and ensure that data access remains smooth and reliable for all users.
Below are the key tables we extract and process as part of our BI monitoring pipeline:
Looker Database Tables:
To monitor usage and performance in Looker, we rely on a few key backend tables that provide rich metadata:
history: Captures all activity in Looker related to running dashboards or queries. This table includes information about which dashboards, queries, or looks were executed. It also contains theslug, which Looker sends as a query comment when executing a request—allowing us to trace queries back to their originating dashboard or look.query: Contains query IDs and information about which LookML view or model the query was developed in. This helps us trace performance back to the specific data model layer.dashboard: Provides metadata and structural details about each dashboard.user: Stores user-level information to identify who triggered a dashboard, look, or query.
Example Query Using Looker history Table
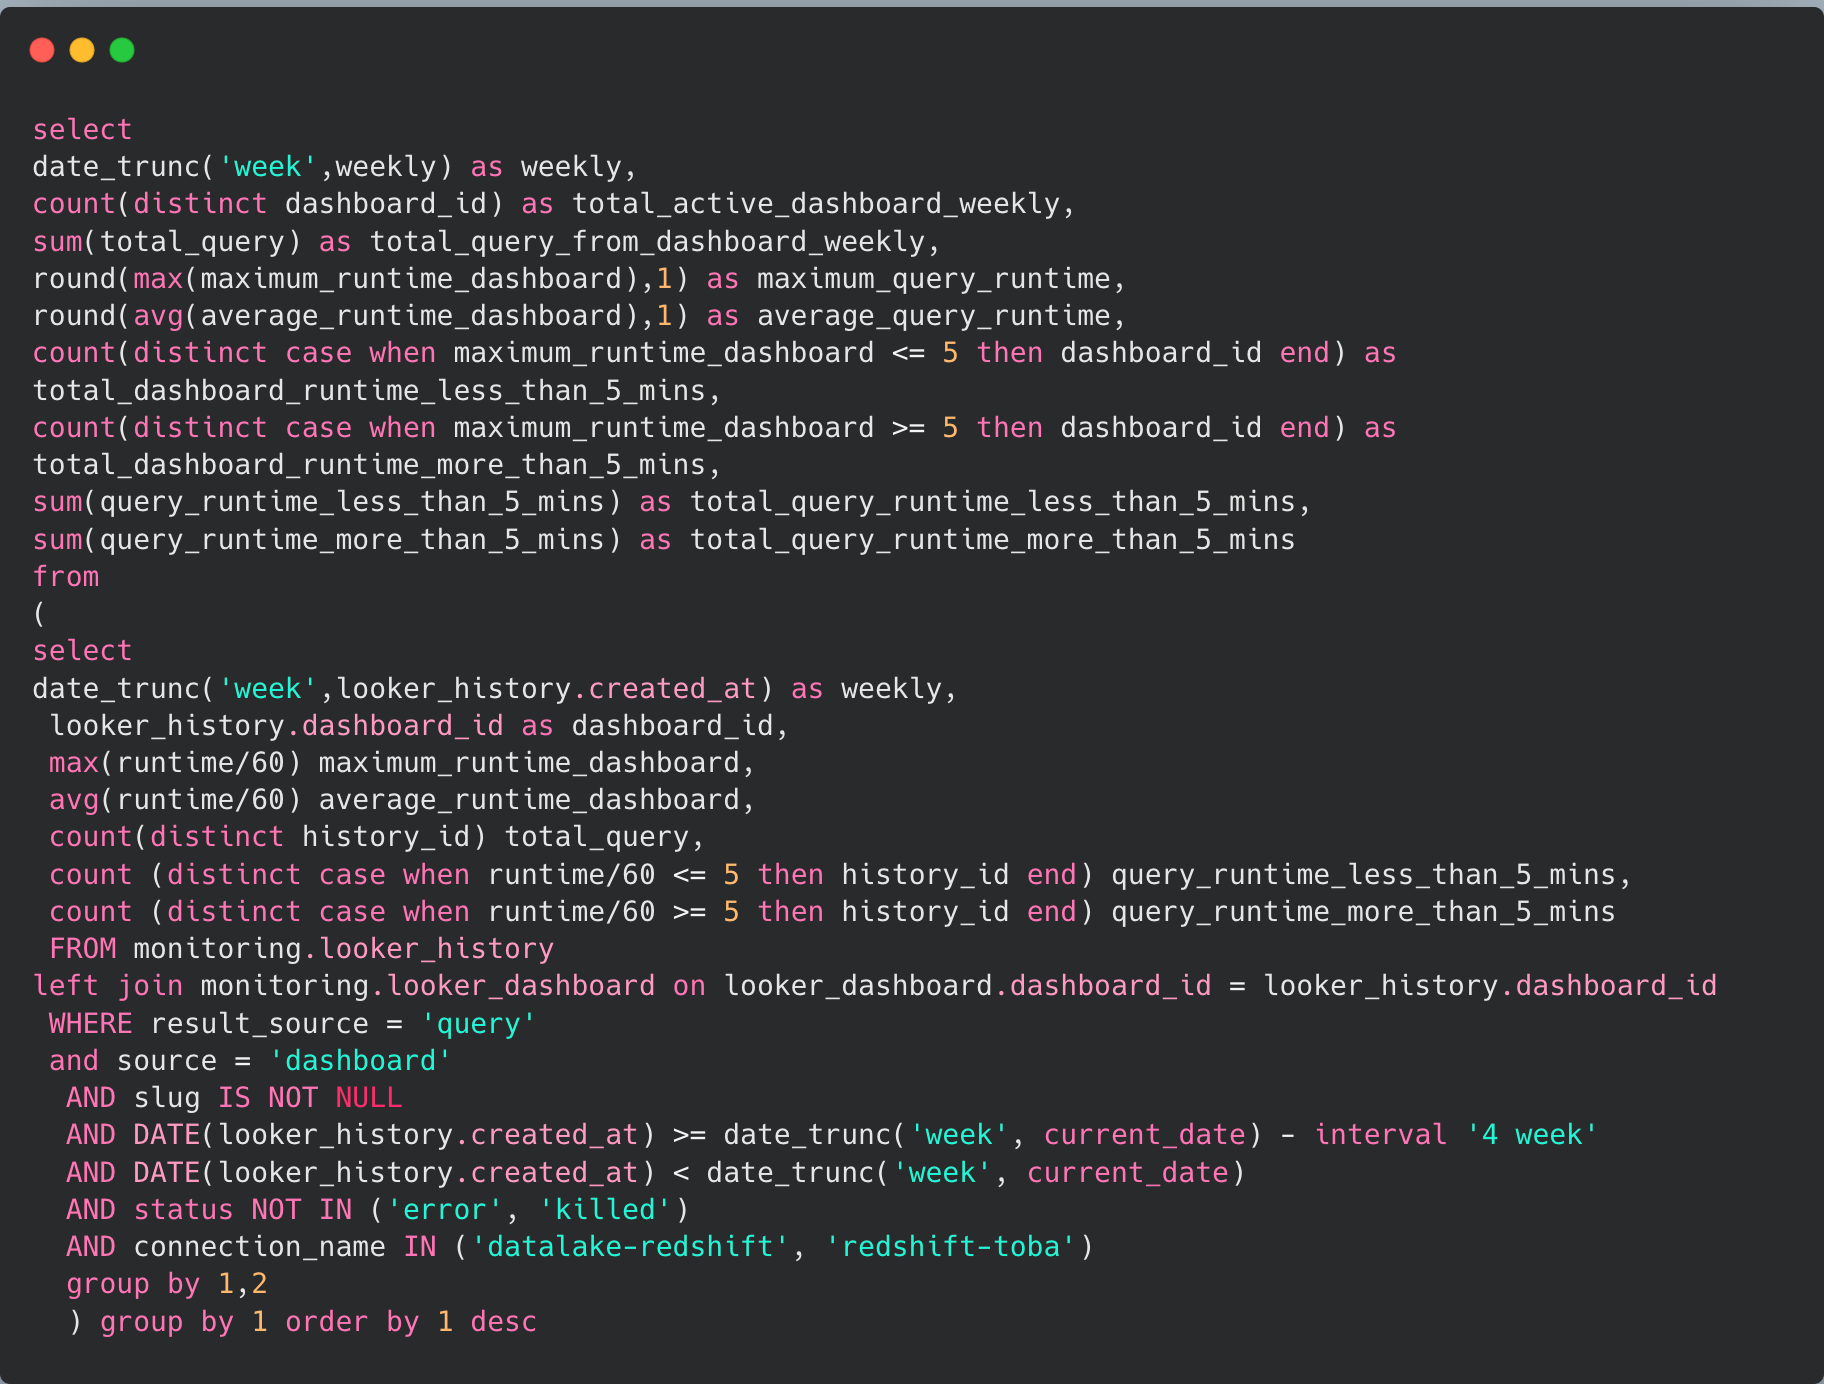
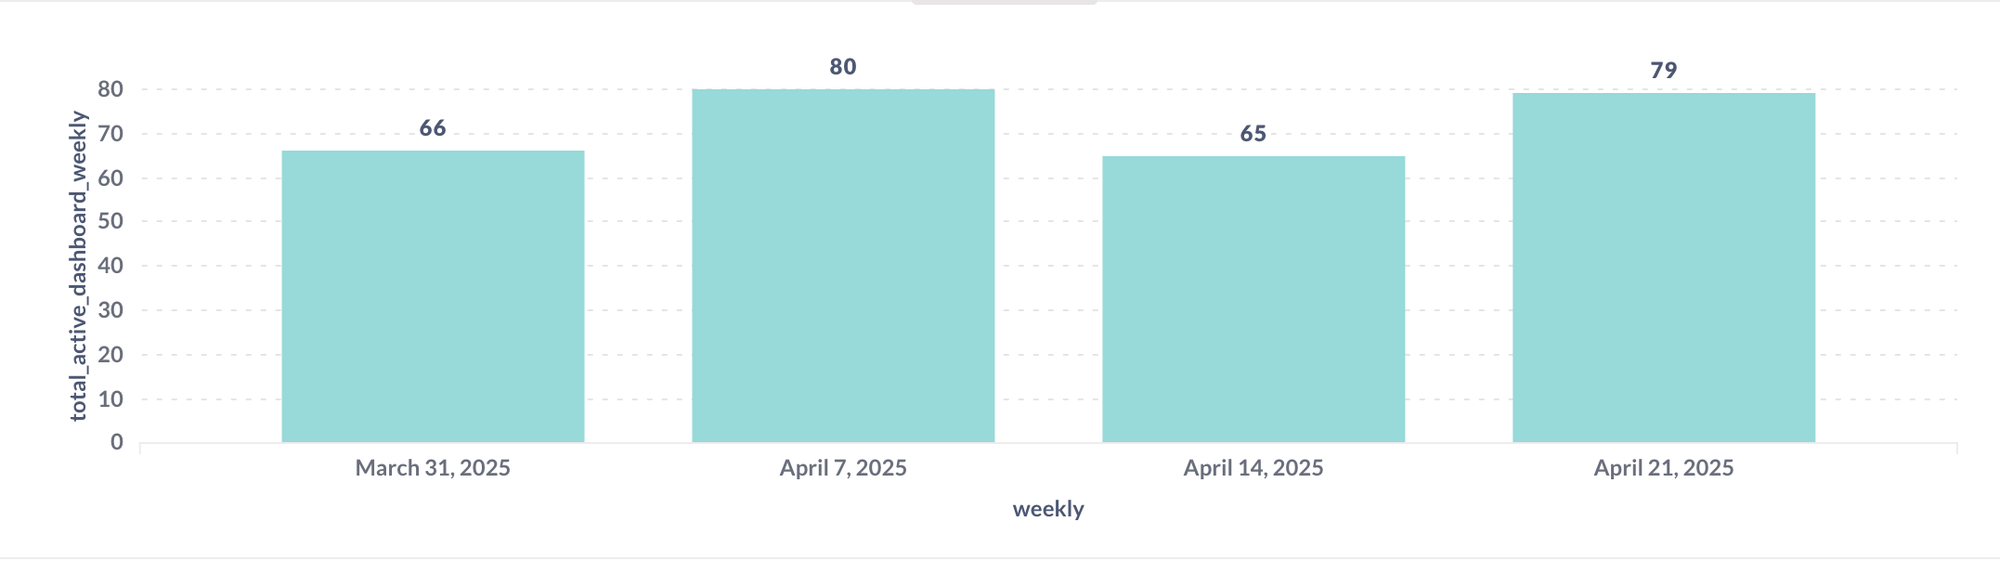
Result from this query helps us answer important questions such as:
- How many dashboards are actively used weekly?
- What’s the performance trend in terms of query runtimes?
Metabase Database Tables
For Metabase, we extract monitoring insights primarily from the following backend tables:
query_execution: Logs each question or query run within Metabase, capturing detailed metrics such as execution time, start time, result size, and execution context. This table is central for understanding query performance and user interaction.report_dashboard: Stores structural and metadata information about dashboards, which helps track usage patterns and overall dashboard health.
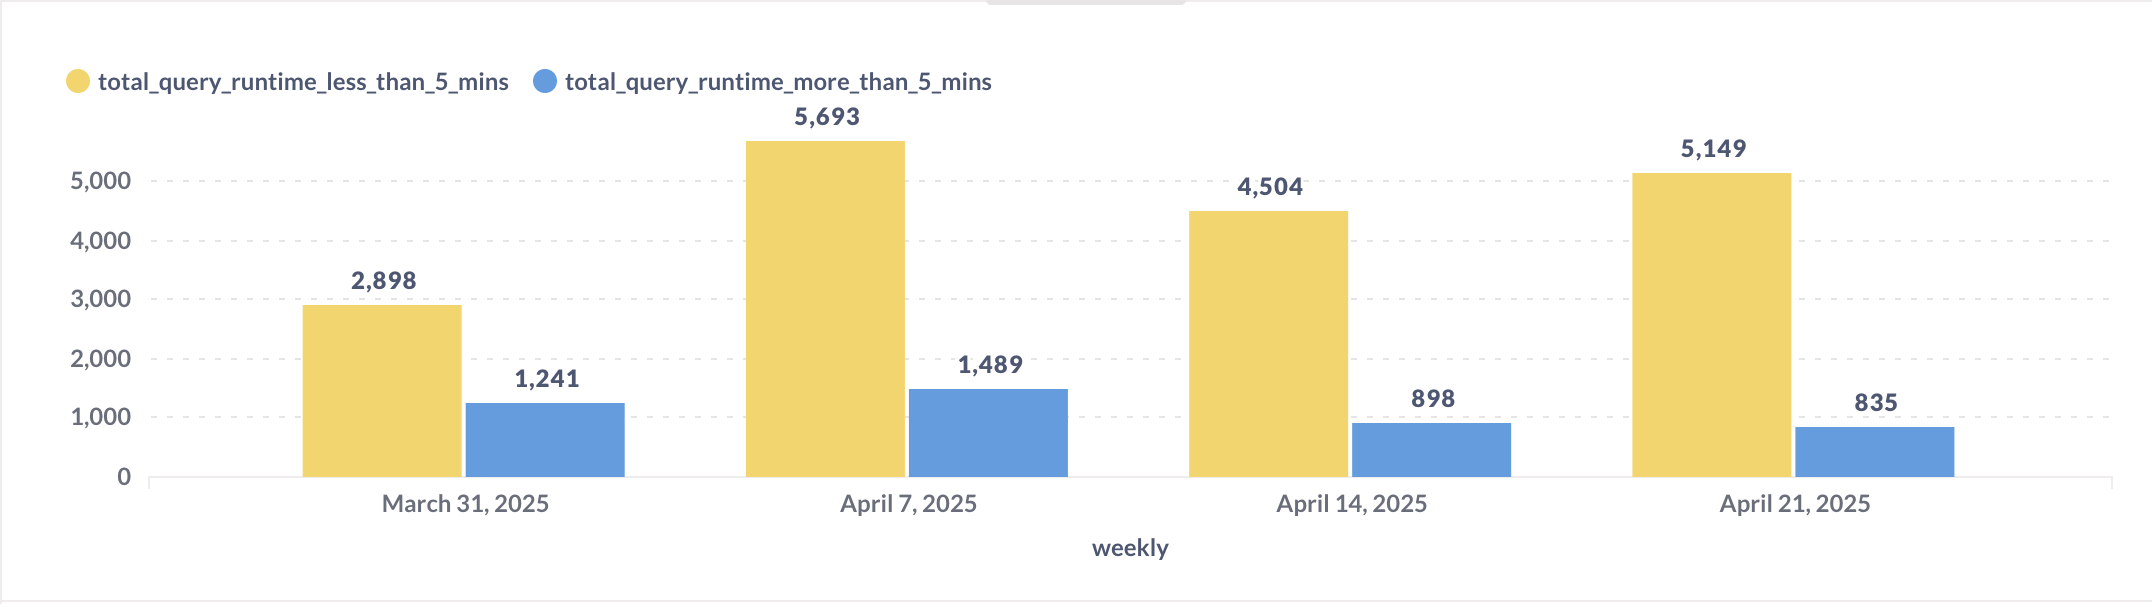
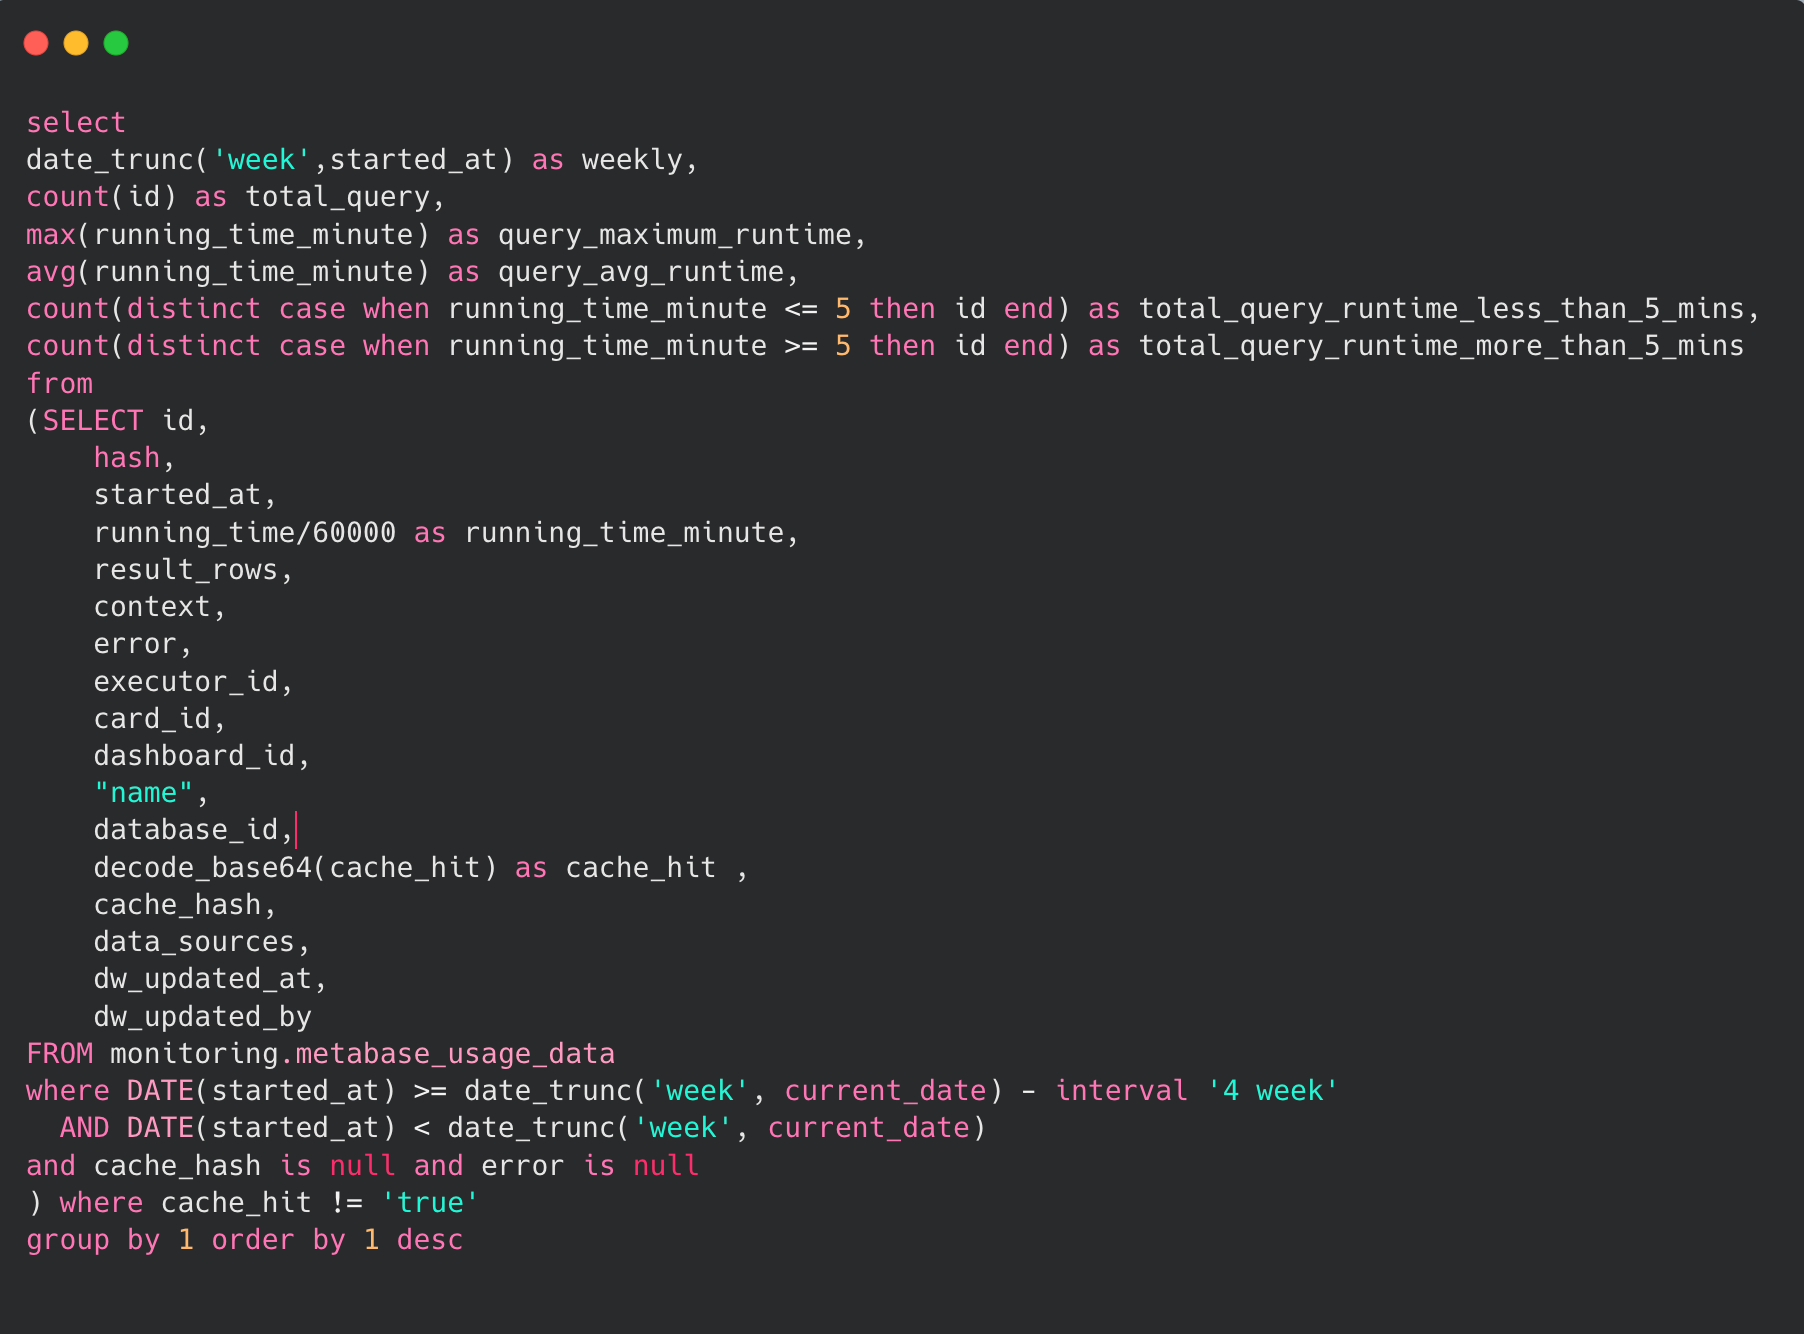
Example Query Using Metabase query_execution Table
Result from this query example enables us to:
- Track total queries executed each week.
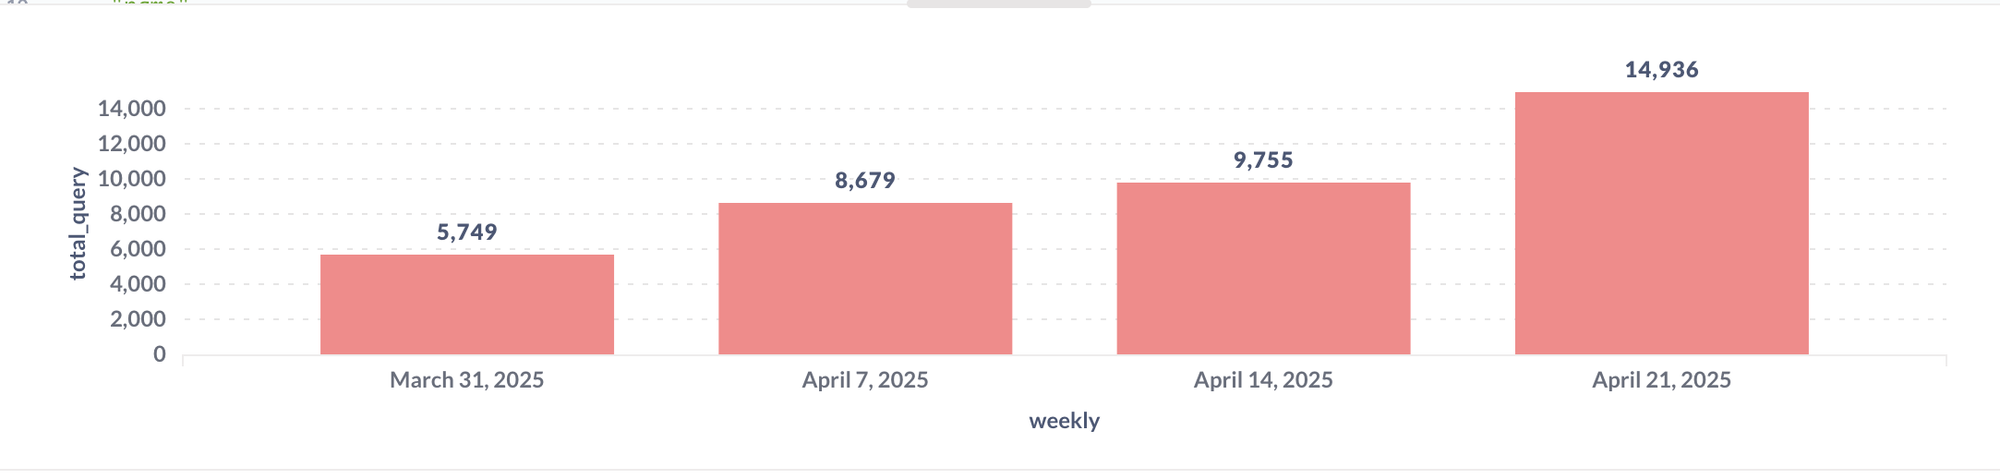
- Identify performance trends across Metabase usage.
By leveraging this metadata, we ensure that Metabase continues to provide fast, reliable insights to our internal stakeholders.
Combining Looker/Metabase Metadata with Redshift System Logs
To get full visibility into BI tool usage, we link Looker and Metabase metadata with Redshift system logs.
The query sent from Looker to Redshift includes a history_slug in the SQL comment. This slug appears in the querytxt column of Redshift’s stl_query system table.

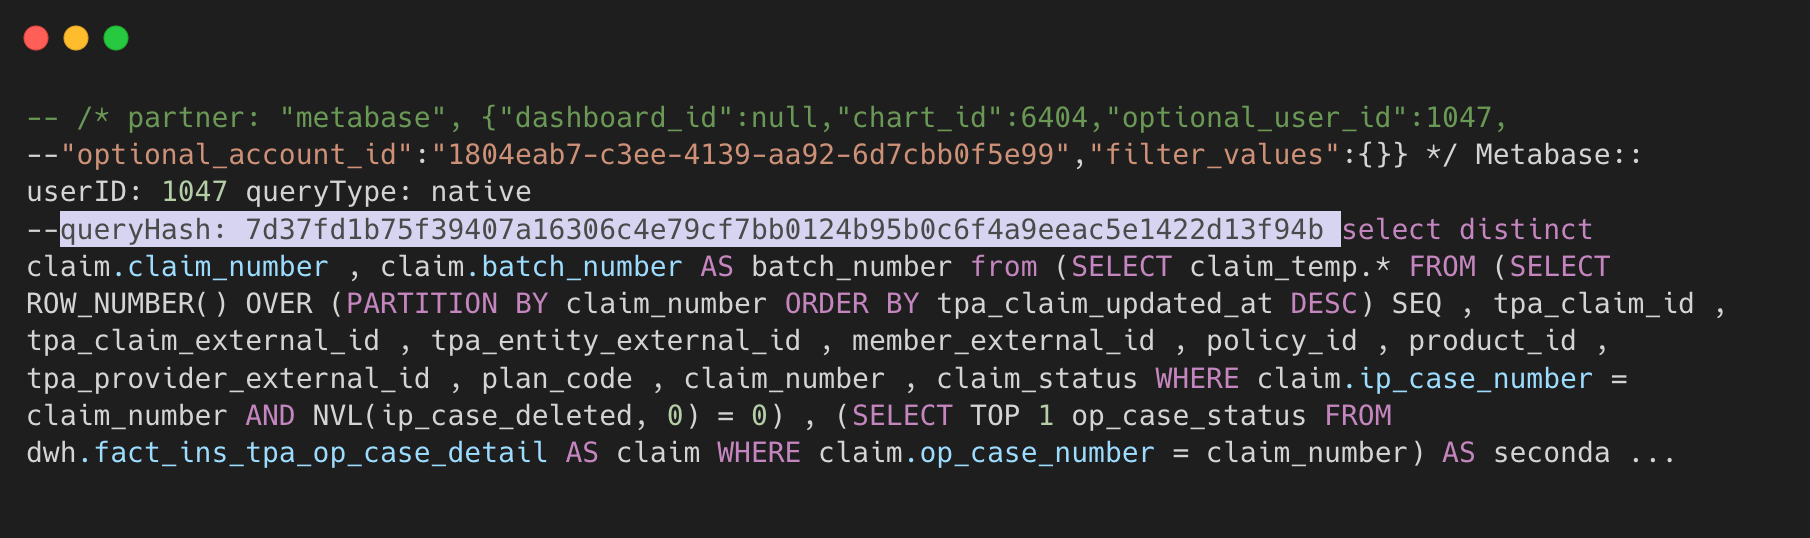
The query sent from Metabase to Redshift includes a queryHash in the SQL comment. This hash appears in the querytxt column of Redshift’s stl_query system table.
By leveraging history_slug from Looker and query_hash from Metabase, we can use these values as join keys to link Redshift queries with their respective records in the looker.history and metabase.query_execution tables.
Combining these datasets enables deeper insights, such as identifying which tables are being queried by each dashboard, bridging backend system logs with user-level BI activity.
Results
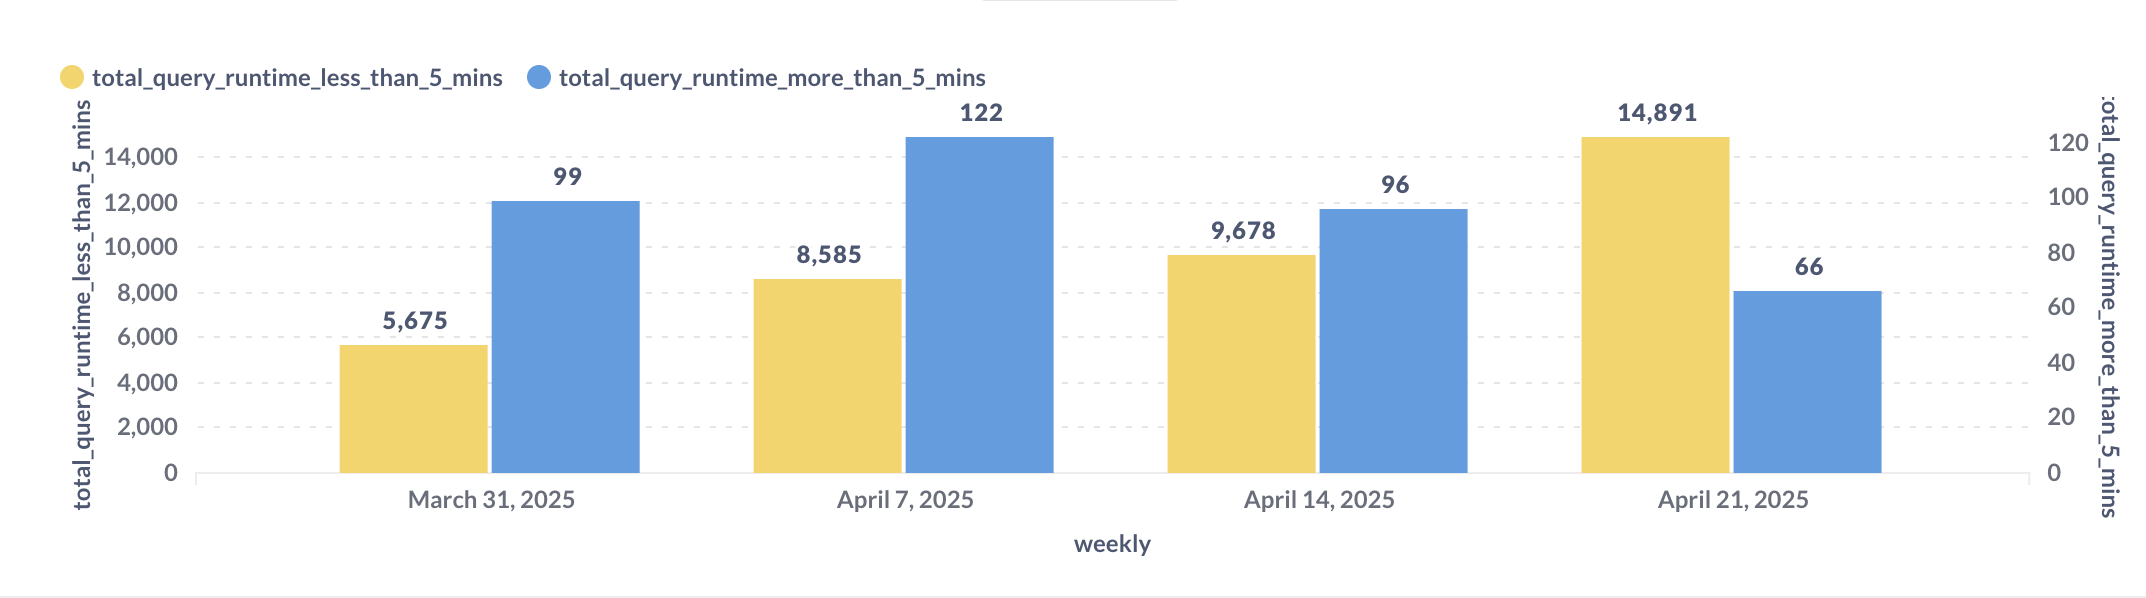
- We are able to track dashboard query performance trends, specifically identifying how many queries run in under 5 minutes (considered good) versus those that exceed 5 minutes (considered poor performance).
- We can also generate a list of dashboards with queries taking longer than 5 minutes, helping the BI team identify which dashboards require performance improvements.
- Additionally, we combine data from Redshift's system monitoring tables with data from BI tools. By integrating these sources, we can determine which tables are used in each dashboard along with their respective performance statistics from Redshift.
This enables us to optimize not only the queries generated by BI tools but also the underlying table structures (DDL), guided by actual usage metrics and performance insights from the system tables.
Benefit of monitoring BI tools
- Identify and Optimize Query
This monitoring setup helps us detect slow queries, heavy dashboards, and frequently queried tables, enabling the data team to target optimizations where they matter most. - Visibility Across the Entire Flow
By combining BI tool metadata with Redshift system logs, we achieve end-to-end visibility, from the dashboard or question initiated by the user, down to how the query was processed in the data warehouse. This visibility allows us to better understand user behavior and system performance in a connected way. - Improved User Experience
Monitoring query performance from the user's perspective ensures that dashboards and reports remain fast and reliable, directly improving the experience for business stakeholders relying on data to make decisions.
Summary
By combining metadata from Looker and Metabase with Redshift system logs, we gain complete visibility into the entire system, from identifying who ran the query and which dashboard triggered it, to analyzing its performance in the data warehouse. This monitoring setup helps detect slow queries, heavy dashboards, and frequently queried tables, enabling the BI team to prioritize optimizations where they matter most. Understanding query performance from the user's perspective ensures that BI tools remain fast and reliable for all stakeholders.
References


Join us
Scalability, reliability and maintainability are the three pillars that govern what we build at Halodoc Tech. We are actively looking for engineers at all levels and if solving hard problems with challenging requirements is your forte, please reach out to us with your resumé at careers.india@halodoc.com.
About Halodoc
Halodoc is the number one all-around healthcare application in Indonesia. Our mission is to simplify and deliver quality healthcare across Indonesia, from Sabang to Merauke.
Since 2016, Halodoc has been improving health literacy in Indonesia by providing user-friendly healthcare communication, education, and information (KIE). In parallel, our ecosystem has expanded to offer a range of services that facilitate convenient access to healthcare, starting with Homecare by Halodoc as a preventive care feature that allows users to conduct health tests privately and securely from the comfort of their homes; My Insurance, which allows users to access the benefits of cashless outpatient services in a more seamless way; Chat with Doctor, which allows users to consult with over 20,000 licensed physicians via chat, video or voice call; and Health Store features that allow users to purchase medicines, supplements and various health products from our network of over 4,900 trusted partner pharmacies. To deliver holistic health solutions in a fully digital way, Halodoc offers Digital Clinic services including Haloskin, a trusted dermatology care platform guided by experienced dermatologists.
We are proud to be trusted by global and regional investors, including the Bill & Melinda Gates Foundation, Singtel, UOB Ventures, Allianz, GoJek, Astra, Temasek, and many more. With over USD 100 million raised to date, including our recent Series D, our team is committed to building the best personalized healthcare solutions — and we remain steadfast in our journey to simplify healthcare for all Indonesians.
Tags
data-enginnering redshift bi-tools