Setting up Production-grade Kubernetes logging with EFK as a Sidecar
Objective
Monitoring, alerting and log aggregation are essential for the smooth functioning of a production grade Kubernetes cluster.
This article explains why they are necessary, the requirements for a production-grade logging system and how we have implemented the same at Halodoc.
Why
Application and system logs help us understand what is happening inside a cluster. The logs are particularly useful for debugging problems and monitoring cluster activity.
Most modern applications are equipped with a logging mechanism; as such, most container engines are also designed to support some kind of logging. The easiest and most embraced logging method for containerised applications is to write to the standard output and error streams.
However, the native functionality provided by a container engine is usually not enough for a complete logging solution. For example, if a container crashes, a pod is evicted, or a node dies, we will usually still want to access our application’s logs. As such, logs should have a separate storage and lifecycle independent of nodes, pods or containers. Kubernetes also, by default, writes container process output to stdout or stderr but the logging becomes tedious if we have to capture logs other than main process like gc logs in Java based application or access.log/catalina.out logs in Tomcat based application.
Cluster-level logging requires a separate backend to store, analyse and query logs. Kubernetes provides no native storage solution for log data, but you can integrate many existing logging solutions into your Kubernetes cluster.
Logging Stack:
Typically, three components make up a logging system.
Log Aggregator: Fluentbit
This component collects logs from pods running on different nodes and routes them to a central location. A good log aggregator must be:
- Efficient: Uses relatively minor CPU and memory resources to log large data, otherwise the log aggregator overhead eats into system resources that are meant for production services
- Dynamic: Log aggregator must adapt quickly to changes in the Kubernetes deployment. It should be able to switch as pods churn through.
- Extensible: The log aggregator must be able to plug into a wide range of log collection, storage and search systems.
Considering these aspects, Fluentbit has become a popular log aggregator for Kubernetes deployments. It is lightweight, efficient and has a wide plugin ecosystem.
Log Collector/Storage/Search: ElasticSearch
- This component stores the logs from log aggregators and provides an interface to search logs efficiently.
- It should also provide storage management and archival of logs.
- Ideally, this component should be resilient to node failures, so that logging does not become unavailable in case of infrastructure failures.
Elasticsearch is a good choice here as it can ingest logs from Fluentbit, creates inverted indices on structured log data making efficient search possible, and has a multi-master architecture with the ability to shard data for high availability.
Visualisation and Alerting: Kibana
- Visualisations are key for log analysis of distributed applications.
- Query capabilities make it easier to sift through application logs, correlate and debug issues. The UI is an added bonus.
- Custom dashboards can provide a high-level overview of the health of the distributed application.
Kibana from Elasticsearch can be used as the UI for the log analysis and will be explored as an option here. Alerting is typically an actionable event in the system. It can be set up in conjunction with logging and monitoring.
Types of logs in Kubernetes:
Node Logs
- Each node in a Kubernetes cluster runs services that allow it to host Pods, receive commands, and network with other nodes.
- The format and location of these logs depend on the host operating system.
- For example, you can get logs for the kubelet service on a typical Linux server by running journalctl -u kubelet. On other systems, Kubernetes writes to log files in the /var/log directory.
Component Logs
- Component logs are captured by Kubernetes itself and can be accessed using the Kubernetes API.
- This is most commonly used with Pods.
- At the Pod level, each message that an application writes to STDOUT or STDERR is automatically collected by the container runtime and handled by the runtime’s logging driver.
- Kubernetes reads these logs and appends information such as the Pod name, hostname, and namespace.
Cluster-level logging options:
While Kubernetes does not provide a native solution for cluster-level logging, there are several common approaches one can consider. Here are some options:
- Use a node-level logging agent that runs on every node.
- Include a dedicated sidecar container for logging in an application pod.
- Push logs directly to a backend from within an application.
Using a node logging agent:
- You can implement cluster-level logging by including a node-level logging agent on each node.
- A logging agent is a dedicated tool that exposes logs or pushes logs to a backend storage. Commonly, the logging agent is a container that has access to a directory with log files from all of the application containers on that node.
- Because the logging agent must run on every node, it’s common to implement it as either a DaemonSet replica, a manifest pod, or a dedicated native process on the node.
Advantage:
- Using a node-level logging agent is the most common and encouraging approach for a Kubernetes cluster because it creates only one agent per node, and it does not require any changes to the applications running on the node.
Disadvantage:
- It becomes tedious when we want to log the heterogeneous applications via a single logging agent.

Using a Sidecar container with the logging agent
You can use a Sidecar container in one of the following ways:
- The Sidecar container streams application logs to its own
stdout. - The Sidecar container runs a logging agent, which is configured to pick up logs from an application container.

Advantage:
- By having your sidecar containers stream to their own
stdoutandstderrstreams, you can take advantage of the kubelet and the logging agent that already run on each node. - The sidecar containers read logs from a file, a socket or the journal.
- This approach allows you to separate several log streams from different parts of your application, some of which that might even lack support for writing to
stdoutorstderr. - The logic behind redirecting logs is minimal, so it’s not a significant overhead.
- Additionally, because
stdoutandstderrare handled by the kubelet, you can use built-in tools likekubectl logs.
Logging Architecture:
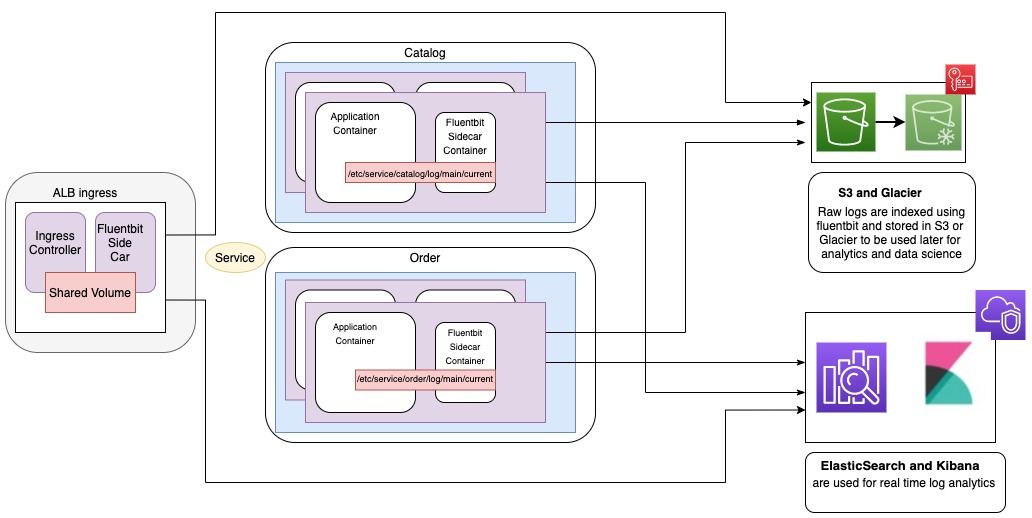
Implementation
Dockerfile
FROM fluent/fluent-bit:latest
ENV environment=$env
ENV srvname=$srvname
ENV projectversion=$projectversion

COPY fluent-bit.conf \
     parsers.conf \
     current-request.conf \
     current.conf \
     output.conf \
     /fluent-bit/etc/
fluent-bit.conf
[SERVICE]
    Flush        5
    Log_Level    info
    Daemon       off
    Daemon       Off
    Log_Level    info
    Parsers_File parsers.conf
    HTTP_Server  Off
    HTTP_Listen  0.0.0.0
    HTTP_Port    2020
@INCLUDE current.conf
@INCLUDE current-request.conf
@INCLUDE output.conf
current.conf
[INPUT]
    Name             tail
    Path             /mnt/log/current
    Multiline        On
    Parser_Firstline backend
    Parser_1         stacktrace
[FILTER]
    Name            grep
    Match           *
    Exclude         LogLevel INFO
    Exclude         LogLevel DEBUG
    Exclude         LogLevel TRACE
current-request.conf
[INPUT]
    Name             tail
    Path             /mnt/log/current-request
    Multiline        On
    Parser_Firstline backend
    Parser_1         stacktrace
[FILTER]
    Name            grep
    Match           *
    Exclude         LogLevel INFO
    Exclude         LogLevel DEBUG
    Exclude         LogLevel TRACE
output.conf
[OUTPUT]
    Name             es
    Match            *
    Host             myes.com
    Port             9200
    Logstash_Format On
    Logstash_Prefix halodoc-prod-backend
    Logstash_DateFormat %Y.%m.%d
    Type            _doc
    Generate_ID     ${srv_name}

[FILTER]
    Name   record_modifier
    Match  *
    Record hostname ${HOSTNAME}
    Record service ${srv_name}
    Record appversion ${project_version}
Helm Deployment chart
apiVersion: apps/v1
kind: Deployment
metadata:
  name: {{ include "svc.fullname" . }}
  labels:
    {{- include "svc.labels" . | nindent 4 }}
spec:
  replicas: {{ .Values.replicaCount }}
  selector:
    matchLabels:
      {{- include "svc.selectorLabels" . | nindent 6 }}
{{- with .Values.strategy }}
  strategy:
      {{- toYaml . | nindent 4 }}
{{- end }}
  template:
    metadata:
      labels:
        {{- include "svc.selectorLabels" . | nindent 8 }}
    spec:
    {{- with .Values.imagePullSecrets }}
      imagePullSecrets:
        {{- toYaml . | nindent 8 }}
    {{- end }}
      serviceAccountName: {{ include "svc.serviceAccountName" . }}
      securityContext:
        {{- toYaml .Values.podSecurityContext | nindent 8 }}
      containers:
        - name: {{ .Chart.Name }}
          securityContext:
            {{- toYaml .Values.securityContext | nindent 12 }}
          image: "{{ .Values.image.repository }}:{{ .Chart.AppVersion }}"
          imagePullPolicy: {{ .Values.image.pullPolicy }}
          env:
           - name: project_version
             value: {{ .Chart.AppVersion }}
           - name: srv_name
             value: {{ .Chart.Name }}
           - name: environment
             value: {{ .Values.namespace }}
           - name: NEW_RELIC_LICENSE_KEY
             valueFrom:
                secretKeyRef:
                  name: newrelic-key
                  key: NEW_RELIC_KEY
          ports:
            - name: healthport
              containerPort: {{ .Values.service.hcport }}
              protocol: TCP
          volumeMounts:
            - name: log-storage
              mountPath: /etc/service/svc/log/main
          livenessProbe:
            httpGet:
              path: /admin/ping
              port: healthport
            initialDelaySeconds: 60
            periodSeconds: 10
            successThreshold: 1
            timeoutSeconds: 1
          readinessProbe:
            httpGet:
              path: /admin/healthcheck
              port: healthport
            initialDelaySeconds: 80
            periodSeconds: 10
            successThreshold: 1
            timeoutSeconds: 1
          resources:
            {{- toYaml .Values.resources | nindent 12 }}
          resources:
            {{- toYaml .Values.resources | nindent 12 }}
        - name: sidecar-log-collector
          image: registry.devops.mhealth.tech/fluent_bit:v5
          imagePullPolicy: {{ .Values.image.pullPolicy }}
          env:
           - name: project_version
             value: {{ .Chart.AppVersion }}
           - name: srv_name
             value: {{ .Chart.Name }}
           - name: environment
             value: {{ .Values.namespace }}
          resources:
            limits:
              cpu: 100m
              memory: 200Mi
          volumeMounts:
            - name: log-storage
              mountPath: /mnt/log
      volumes:
        - name: log-storage
          emptyDir: {}
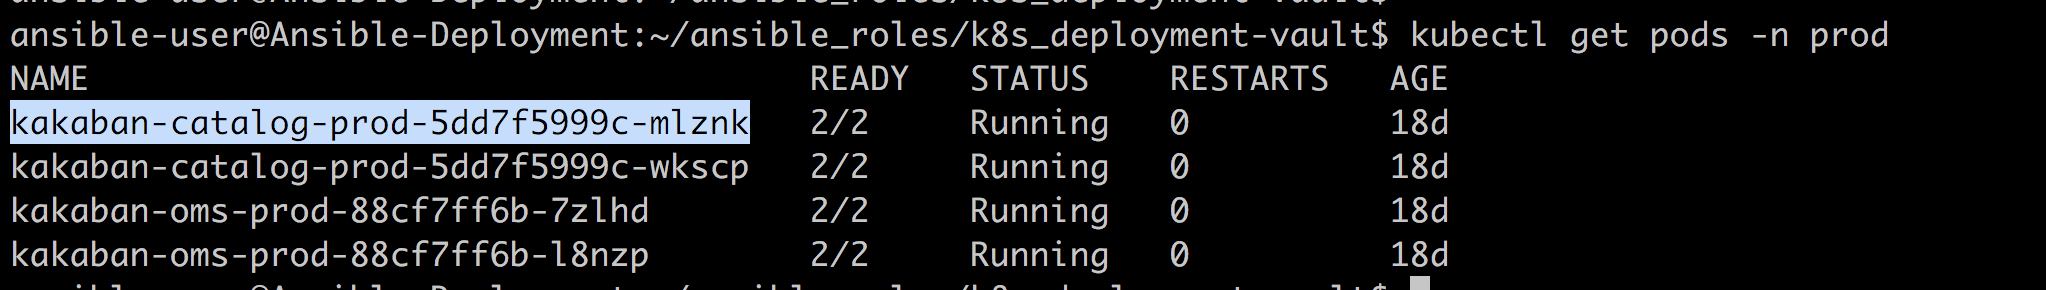
Kubernetes Pods
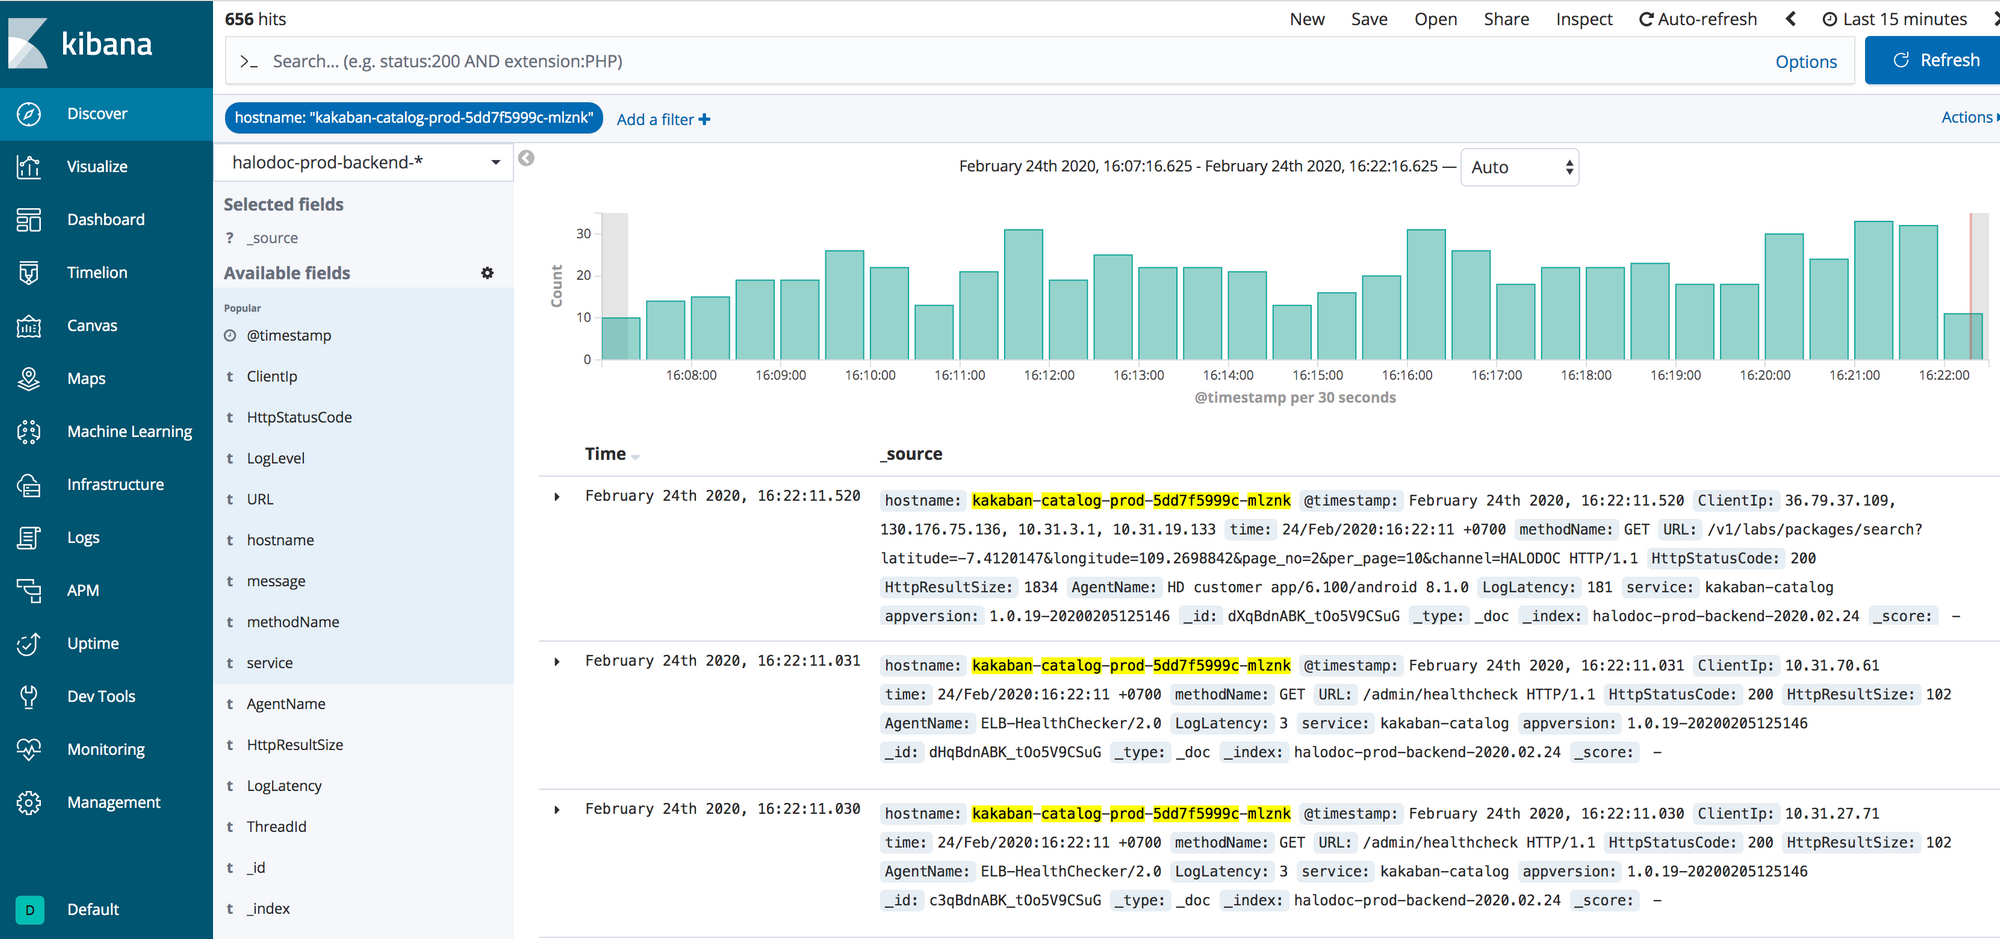
Kibana Dashboard
Join us?
We are always looking out to hire for all roles in our tech team. If challenging problems that drive big impact enthral you, do reach out to us at careers.india@halodoc.com
About Halodoc
Halodoc is the Number #1 all around Healthcare application in Indonesia. Our mission is to simplify and bring quality healthcare across Indonesia, from Sabang to Merauke.
We connect 20,000+ doctors with patients in need through our teleconsultation service, we partner with 1500+ pharmacies in 50 cities to bring medicine to your doorstep, we partner with Indonesia's largest lab provider to provide lab home services, and to top it off we have recently launched a premium appointment service that partners with 500+ hospitals that allows patients to book a doctor appointment inside our application.
We are extremely fortunate to be trusted by our investors, such as the Bill & Melinda Gates foundation, Singtel, UOB Ventures, Allianz, Gojek and many more. We recently closed our Series B round and In total have raised USD$100million for our mission.
Our team work tirelessly to make sure that we create the best healthcare solution personalized for all of our patient's needs, and are continuously on a path to simplify healthcare for Indonesia.