Android App Launch Time Improvements
In this article, we go through how we improved our app launch time to provide users with a better experience of the app every time they used it.
App startup time introduction
The time taken by an app to showcase its home screen is the app launch time. Generally, an app launch is supported by a visible screen which is called the splash screen. Ideally, an app is expected to launch within an average of 3 seconds. Every second it takes after this is an expensive operation. This would result in a notable decrease in the percentage of the app users as a slow app is always disappointing to the users.
App start-up comes in different types :
Cold start - A cold start is when the app is completely killed or some kind of system reboot has happened and the app starts from scratch. It starts the process, creates/initializes objects, creates the UI, and displays it to the user.
Warm start - A warm start is when the app is closed by the hard back or any application back button. In this type, some part of the process remains in the background when the user closes the app. Say the process still exists but object creation and layout inflations happen afresh.
Hot start - A hot start is a type when the app has been moved to the background and is brought to the foreground. This is the fastest start an app can have as the processes and objects required aren't lost. Only if some memory consumption crunch happens, some objects might have to be recreated. But the layout inflation and rendering are generally not lost.
In this article, we have concentrated on the cold start time for an app.
Our journey of solving the problem
Finding the startup time
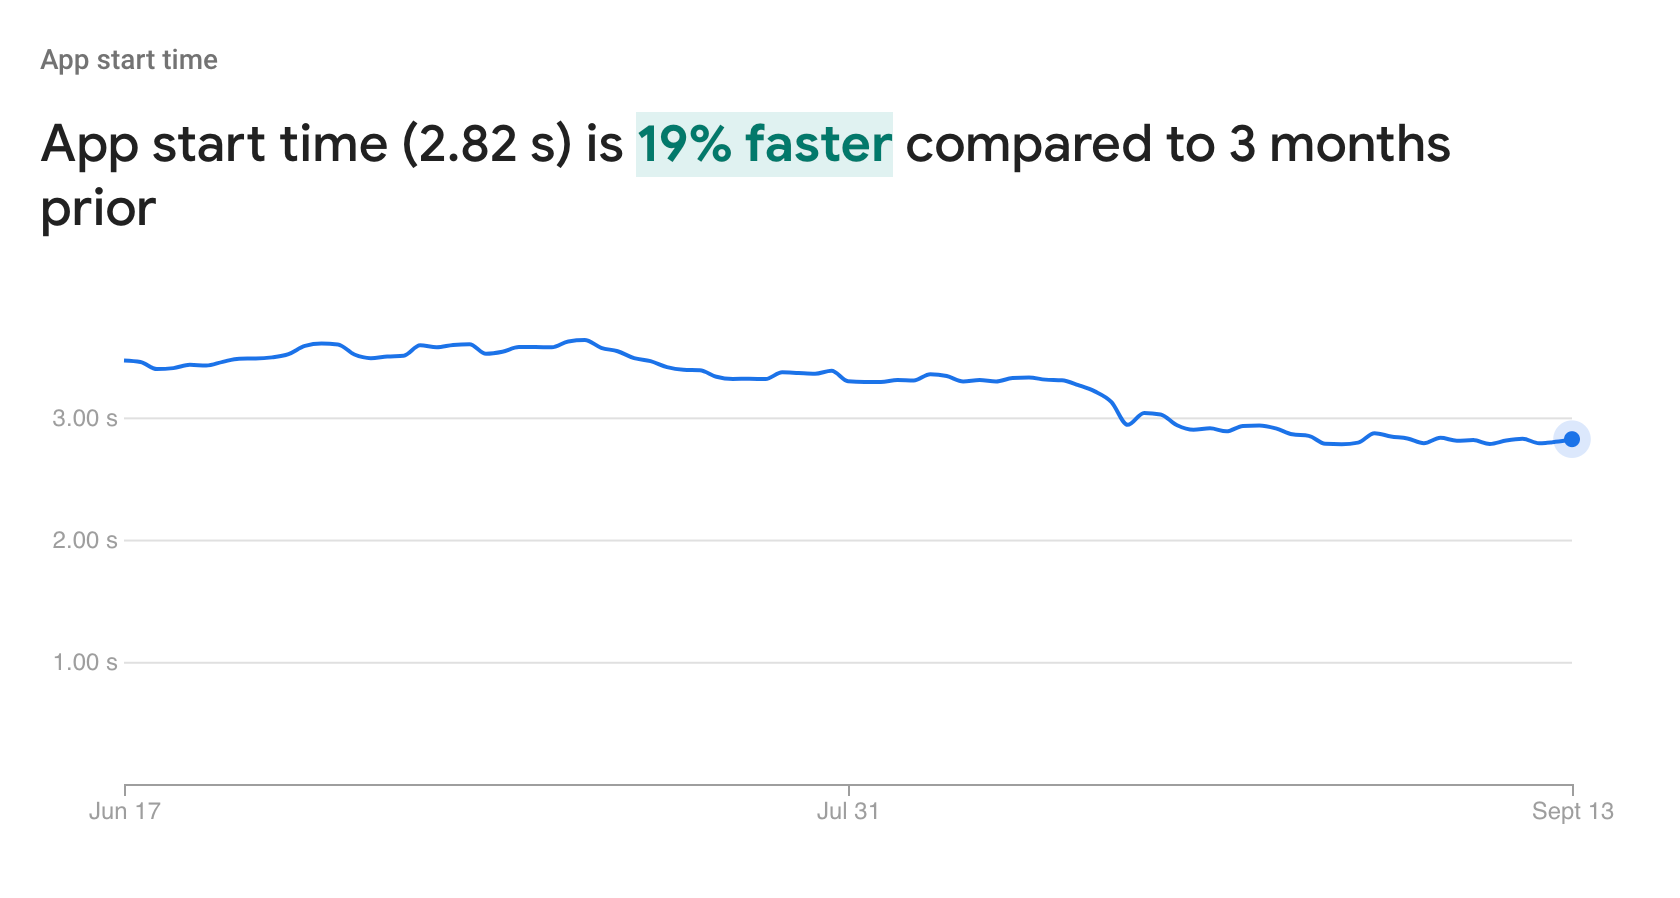
Firebase - Helps us measure the average app launch time for each of the versions we upload on the google play store. For this, we added a performance trace in the firebase console which is the _app_start trace with duration metric. Here is an example of how the graph looks.

This is a 3 months chart which is depicted for overall versions. As and when the user shift happens to the newer version and gets adapted, we will be able to see a performance increase from 19% to 85%.
Measuring through Google playstore - To check how an Android app is performing in comparison to other apps, go to Play Console > Your app > Android Vitals > App Startup Time.
In Android 4.4 and higher, the logcat includes a line containing a value called “Displayed”. This value represents the amount of time elapsed between launching the process and finishing the display of the first activity of the app. In our case, it was the Splash screen. The Splash screen alone also is displayed for some time and then the actual app home screen is shown. Hence the actual start time of the app would be the app launch time + splash screen time. In this article, we have concentrated on the cold start time for an app.
Finding the heavy initialisations
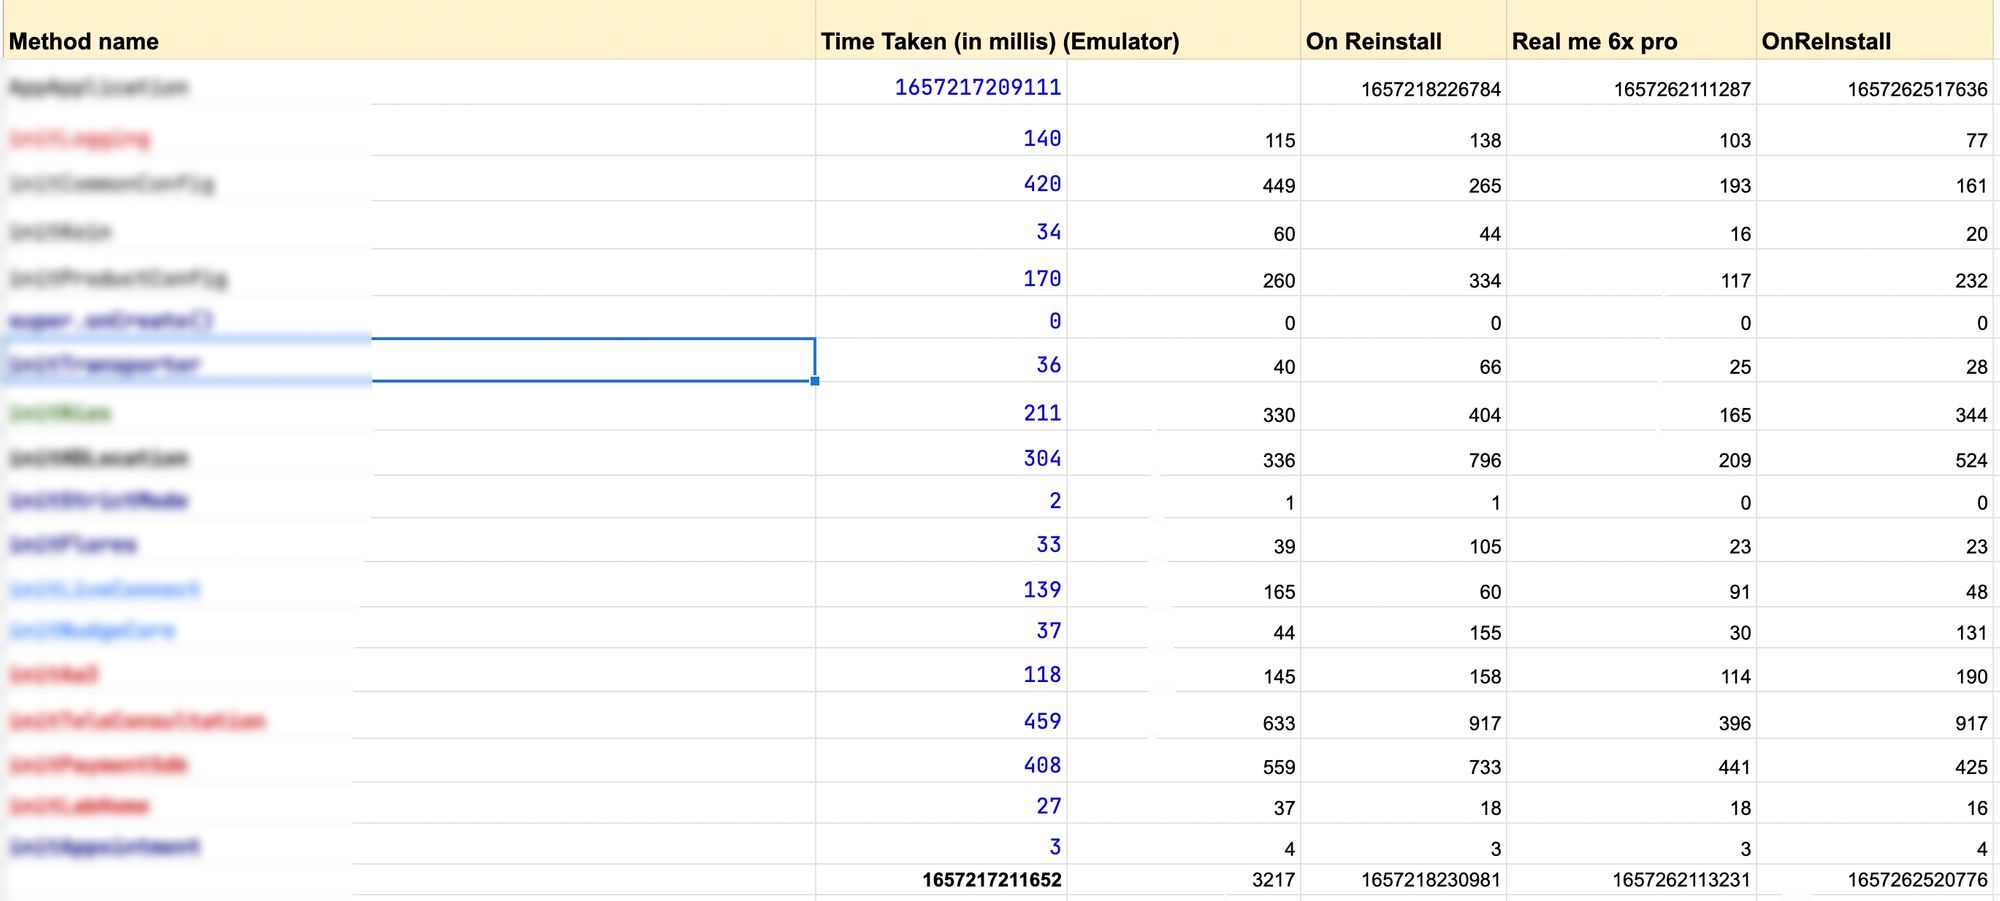
We have adopted the method tracing way of finding the amount of time each method takes to complete. All the initializations required for the app were done in the custom application class created. Hence we went through each method in the application class and added logs to check the time when the method started and when it ended. We ran the app with the logs on different phones to collect an average app start time and the division of the time between the methods.
With the help of start/end time information we got from method tracing, we made a chart of all the measures and found out the ones which took a long time to complete. All the methods were being run on the main thread which made the app suffer from launch performance. Below is an example of the summary collected.

The solution to the problem
- To first dig into all the methods and find out the cause of the time taken by the method to execute and also to check if the method can be called in a background thread.
- To check if the method is dependent on any other initializations.
- On-demand loading of libraries - Identify specific processes which can be simplified or can be initialized when in need. To check if the initialization of any of the objects or SDKs or any library can be done the first time when the feature which requires the SDK is used.
- In our app, we have a Teleconsultation module that requires a third-party chat SDK to be initialized. This was initially done in our Application class. We moved this initialization to our ChatList class where we use the chat SDK. This contributed to reducing our initial wait time for the users who are using the app for our features other than Teleconsultation. And when a user uses the chat feature for the first time in a session, the SDK is initialized and he can proceed by using the services.
- Move dependencies to background thread - To add a background thread and move in all the heavy initializations so that the launch is not blocked until these initializations are done. The code snippet for the same is given below :
open class CustomApplication : Application(), CoroutineScope {

    val isInitialize = MutableLiveData(false)

    override fun onCreate() {
        super.onCreate()
        instance = this
		....
		launch(coroutineContext) {
            initialize()
        }
	}

	private fun initialize(){
		/* Initialise all the objects/SDKs in this block */
        isInitialize.postValue(true)

	}

}
class FirstExampleActivity : AppCompatActivity() {

    override fun onCreate(savedInstanceState: Bundle?) {
        super.onCreate(savedInstanceState)
        if(application is CustomApplication){
            (application as CustomApplication).isInitialize.observe(this) {
                if(it){
                    initializeObjects()
                }
            }
        }
    }

    private fun initializeObjects() {
    	/* initialise objects which were dependent on application */
    }

}
Issues we faced and how we fixed them
In our app, we have multiple internal modules which are interdependent. As we had shuffled all the unnecessary initializations in the main thread to a background thread, we could face some issues like null pointer crashes and also errors in the app which occurred as the app continued to launch in parallel and even before a library is initialized. Hence we have to have a deeper analysis on maintaining the sequences of initializations.
We solved the problem using the reactive way of programming like LiveData and Flow in our Application class which would update the state after all the initializations are done in the background. This change is then observed in our First Activity screen and necessary processes are carried out.
After we implemented all the solutions mentioned above, we could achieve more than 85% improvement in our start time. The previous start time recorded was at 4.8s and we could successfully reduce it to 2.5s.
Conclusion
Hope the bunch of steps we have mentioned above would help improve your application load time. The journey does not just end here and goes beyond. We need to constantly monitor the app launch time performance at regular intervals and also take care of the errors and bugs that might occur due to the refactored code.
Read More:
You can read more about other Android topics in our Halodoc blogs at https://blogs.halodoc.io/
Join us
Scalability, reliability, and maintainability are the three pillars that govern what we build at Halodoc Tech. We are actively looking for engineers at all levels and if solving hard problems with challenging requirements is your forte, please reach out to us with your resumé at careers.india@halodoc.com.
About Halodoc
Halodoc is the number 1 all around Healthcare application in Indonesia. Our mission is to simplify and bring quality healthcare across Indonesia, from Sabang to Merauke. We connect 20,000+ doctors with patients in need through our Tele-consultation service. We partner with 3500+ pharmacies in 100+ cities to bring medicine to your doorstep. We've also partnered with Indonesia's largest lab provider to provide lab home services, and to top it off we have recently launched a premium appointment service that partners with 500+ hospitals that allow patients to book a doctor appointment inside our application. We are extremely fortunate to be trusted by our investors, such as the Bill & Melinda Gates Foundation, Singtel, UOB Ventures, Allianz, GoJek, Astra, Temasek, and many more. We recently closed our Series C round and In total have raised around USD$180 million for our mission. Our team works tirelessly to make sure that we create the best healthcare solution personalized for all of our patient's needs, and are continuously on a path to simplifying healthcare for Indonesia.


