iOS code coverage at Halodoc
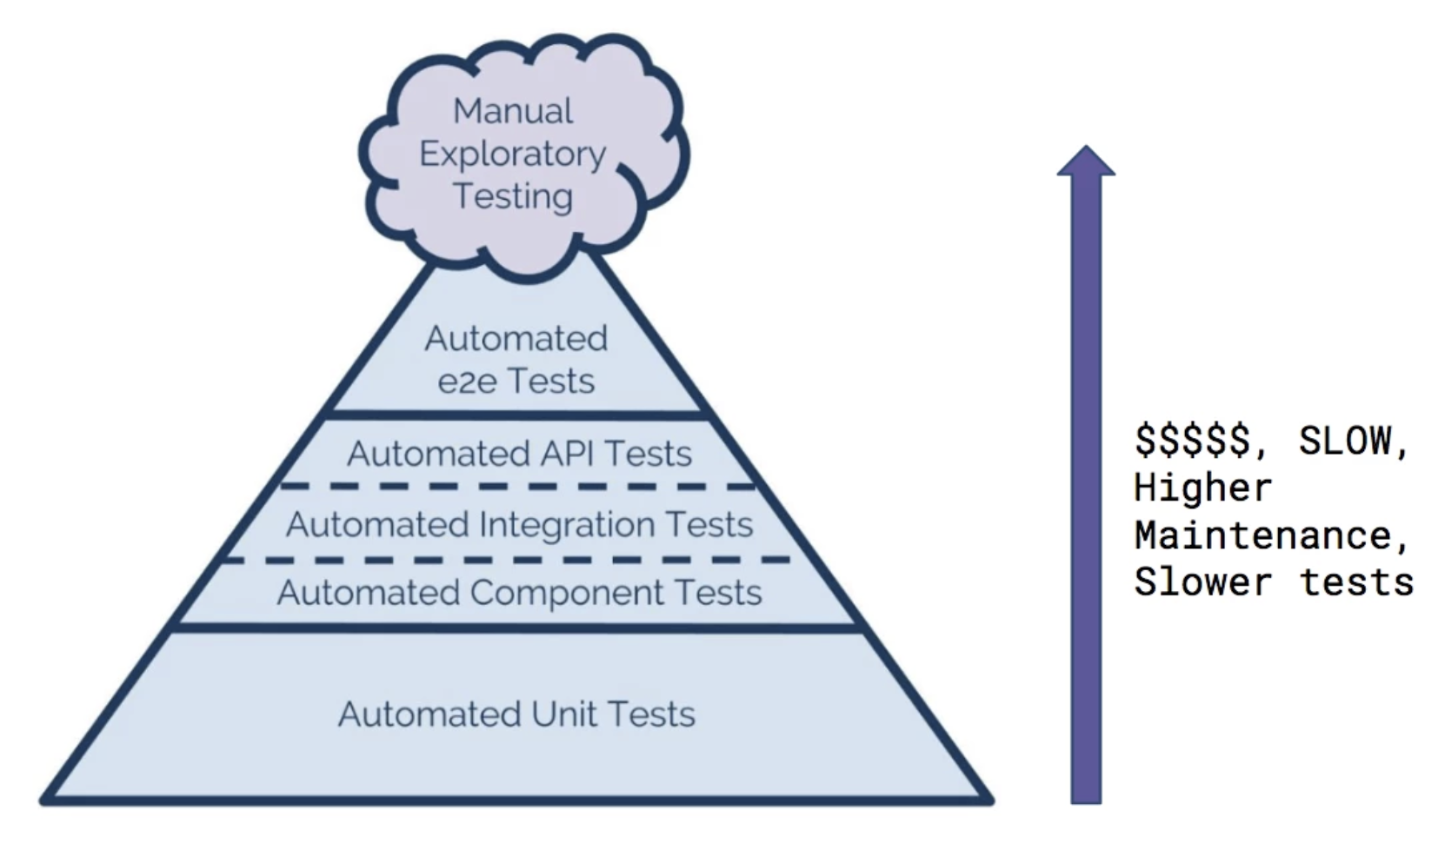
At Halodoc, solving a patient's problem takes the highest precedence. With a 2 week sprint cycle, we are constantly adding new features or improving our existing flows. But, in order to ensure that our delivery is always pristine, we have dedicated some time to invest in unit testing and code coverage so that we can lower our development cost by catching issues early on. Let's start with a simple explanation of what this looks like:
Unit testing matters, and we believe in measuring the same. XCTest is a built-in framework from Apple to unit test your code. The most important metrics when running an automated unit test is how much of the code base is being exercised. A code coverage system provides these measurements from combining the source code after collecting the information about the running executable. At Halodoc we use these metrics to determine the quality of the code during the development process.
There are many approaches to code coverage measurement. Broadly, there are three, which may be used in combination:
Source code instrumentation
An instrumented assembly is generated by the normal compile tool chain by adding the instrumentation statements to the original source code.
Intermediate code instrumentation
A new instrumented class is generated by adding the new byte-codes to the existing complied code.
Runtime information collection
As the code runs to completion, the coverage information will be collected at runtime.
Xcode uses source code instrumentation, the most accurate measurement along with low runtime overhead. It uses LLVM compiler to collect the information about the code that has been exercised by your test suite in a single run. The reports can vary based on the type of coverage information we collect.
The commonly used metrics are as follows
Function Coverage: % of functions executed at least once when the code is exercised by your test suite.
Line Coverage: % of code lines (executable instructions) which have been executed at least once when the code is exercised by your test suite. This is the best metric to measure the quantity of the code.
Region Coverage: % of code regions which have been executed at least once. A code region may span multiple lines (e.g in a large function body with no control flow). However, it is also possible for a single line to contain multiple code regions (e.g in 'return x || y && z').
Now that we have learnt the basics of code coverage, let's take a deep dive into Xcode's unit testing and its code coverage system. XCTestPlan was introduced by Apple as a part of Xcode 11, which allows developers and QA to run different suites of test cases without creating multiple schemes for each test suite. It outputs XCResult which can be shared and viewed on any mac without rerunning the test suite.
Coming to the Xcode features for unit testing, it provides code coverage right out of the box and generates the required coverage metrics. It also has a friendly UI to display and iterate over your test cases in your test suite and areas of code base which have been already exercised in the current run.
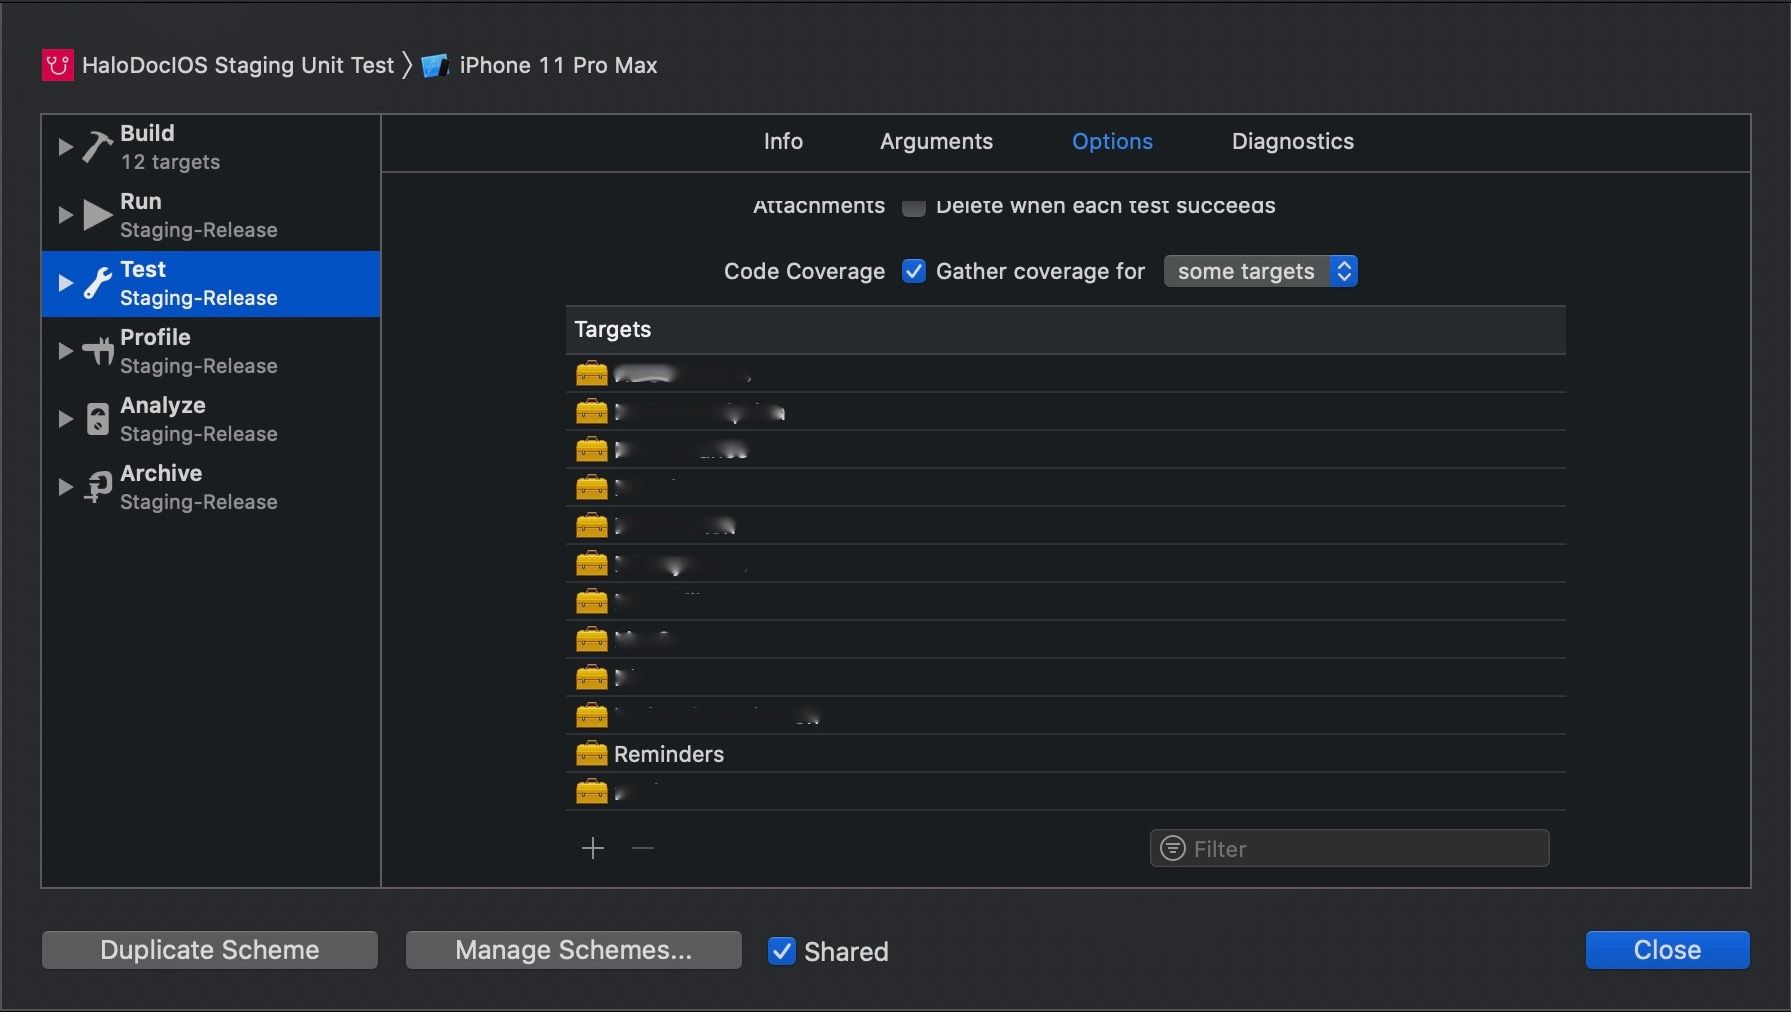
You can set up the code coverage in two ways:
- Gather the code coverage for all targets, which includes all your Pods.
- Gather the code coverage for some targets, ideally the in-house development Pods and the main app.
After running the test suites, Xcode automatically collects the code coverage metrics for all the selected targets and emits the reports as shown below.
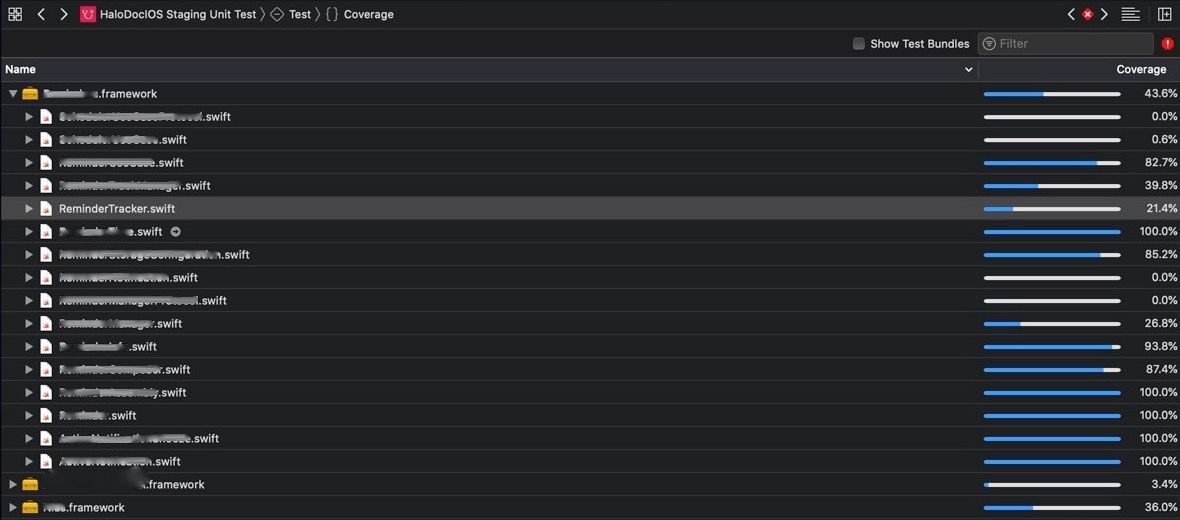
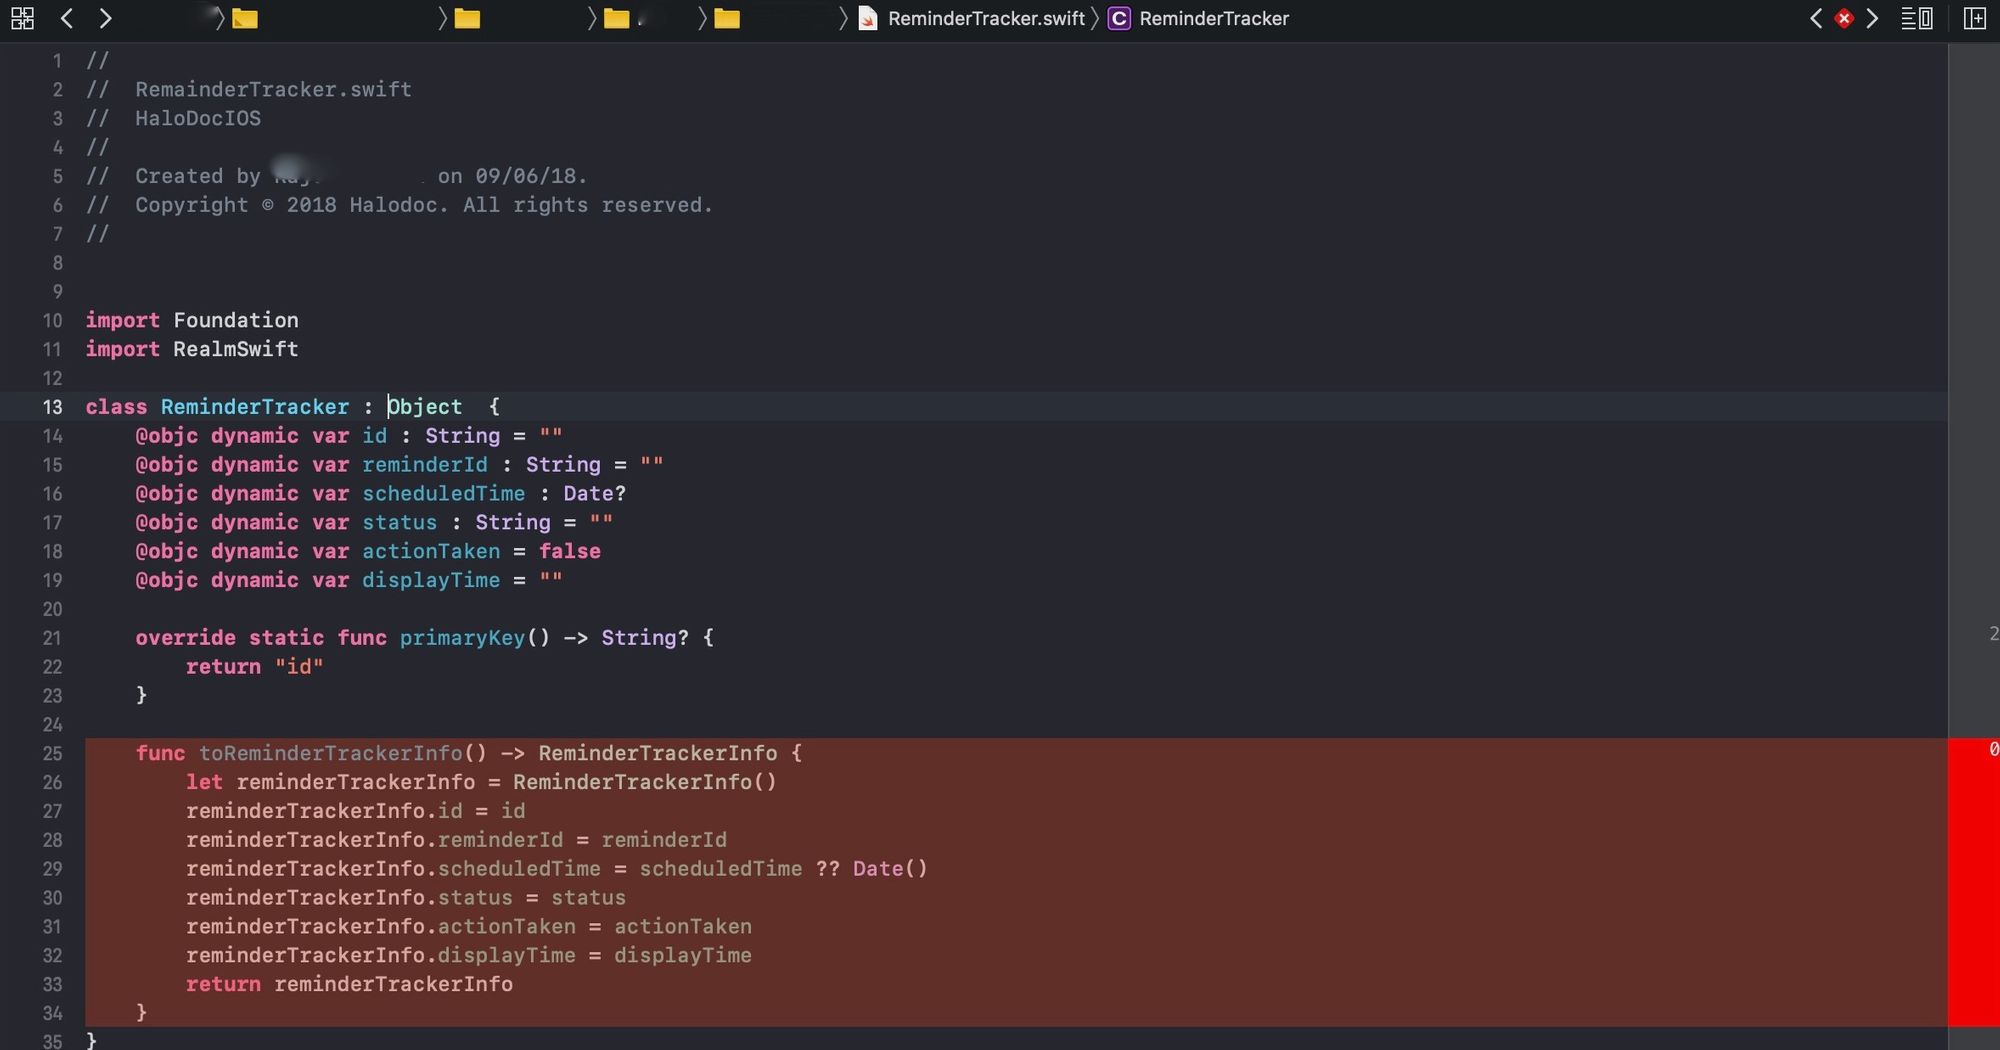
You can navigate to each file and see the code base which isn't covered by your test suite in the current run.
We recently met iOS evangelists at the Apple App Accelerator event. After a brief discussion on code coverage metrics, we came to know that Xcode emits line coverage as the code coverage metrics. This was not sufficient for us; we wanted the branch coverage a.k.a region coverage report as it provides quality over the quantity.
Since Xcode does not provide the region coverage metrics out of the box, we decided to look at how Xcode is able to emit the line coverage as the metrics. We knew that Xcode uses an LLVM compiler to compile Swift code and to generate the code coverage report. This led us to the official LLVM compiler documentation which unfortunately was inadequately documented. Upon further investigation, we found that LLVM uses source based instrumentation to emit the code coverage reports and the process is depicted below
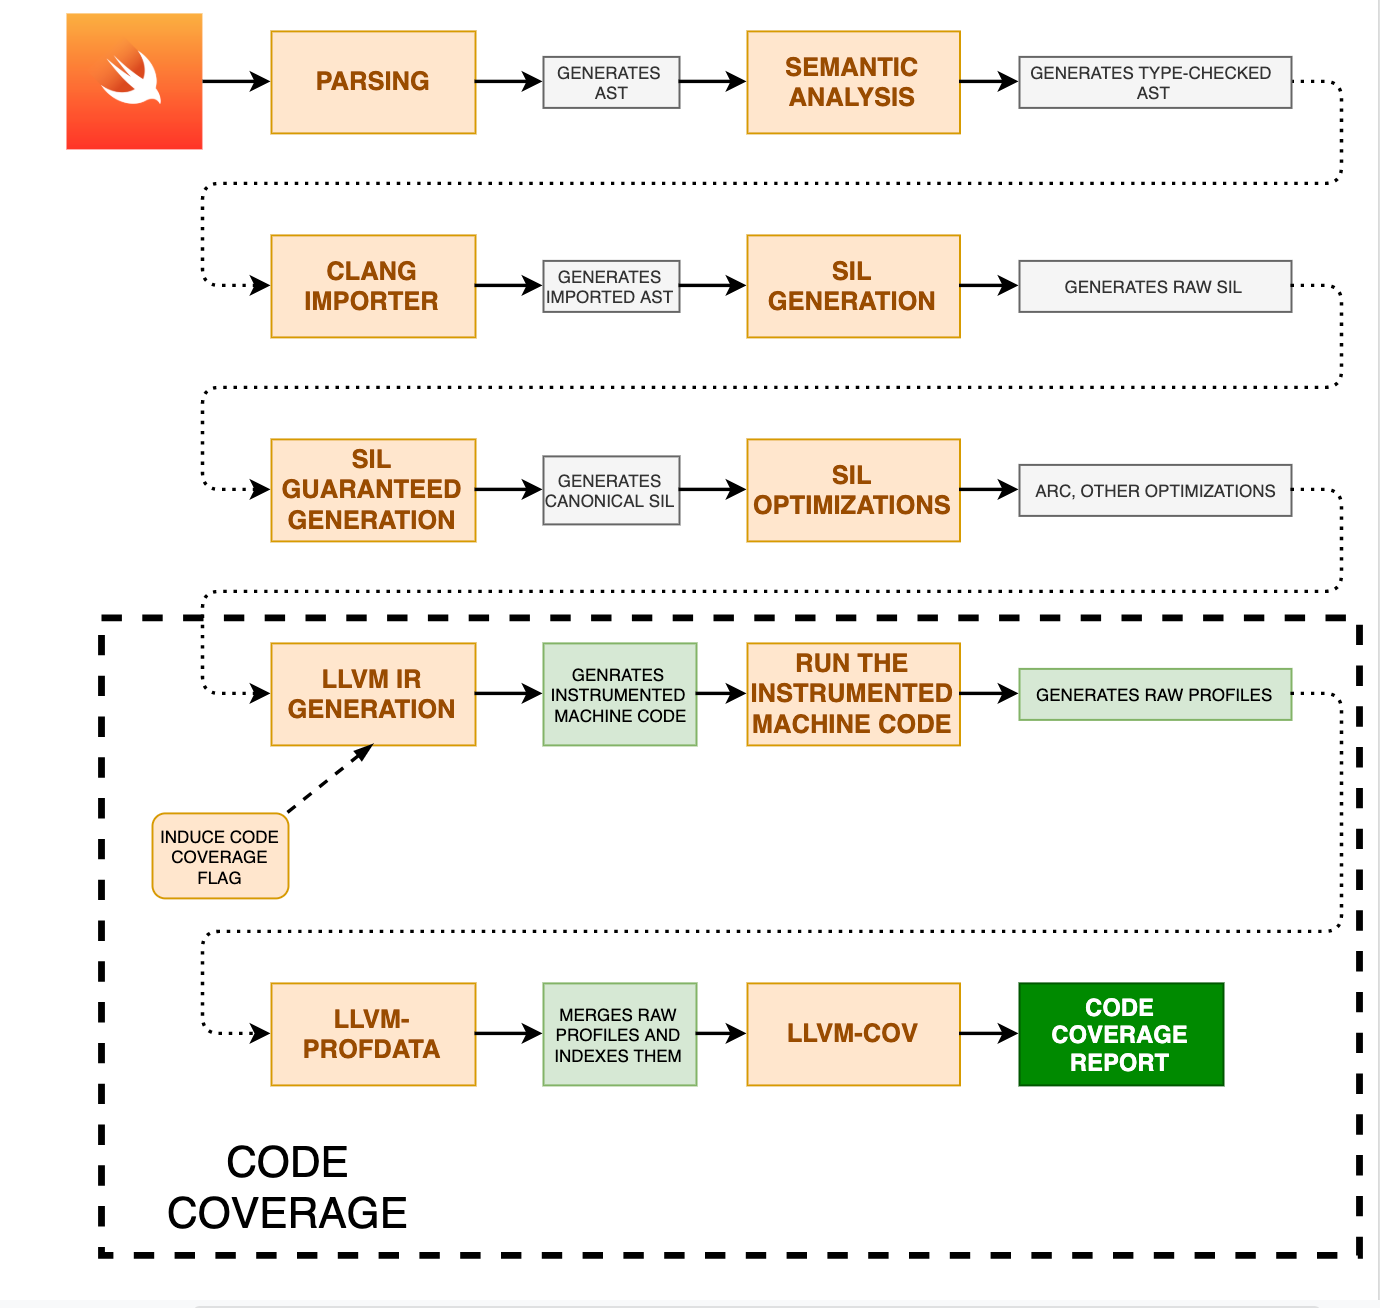
The LLVM Code Coverage Process has three steps as depicted in the above:
- During the LLVM IR GENERATION step, the code coverage flag (passed during the build step) is induced which will generate the instrumented executable binary.
- Our test suites (defined in XCTestPlan) are run on an instrumented executable binary which will generate the raw profiles (
.profraw) upon exiting. These raw profiles have to be indexed before they can be used to generate the code coverage report. LLVM-PROFDATA has commands to merge and index these raw profiles at the same time. After the test suite execution completes, the Xcode generates the profile data asCoverage.profdata. - The LLVM-COV then uses the instrumented binary along with its architecture and the generated profile data to emit the code coverage report. This report includes Function Coverage, Line Coverage and Region Coverage. However, Xcode uses only the Line Coverage to generate the
xcresultfile and to display it.
Note: You can learn more about the Swift compilation process here.
Well, where can we get these raw profiles and instrumented executable binary? All these files are stored in the DerivedData folder. After navigating to this folder, the required commands can be run to emit the region coverage report.
Wait, what?!?! Where are the LLVM commands to generate the reports?
Well, Apple poorly documents the xcrun which comes with many sub commands along with LLVM-PROFDATA and LLVM-COV. (Please use man command to know more about xcrun).
Now to export the region coverage metrics we have to follow below steps:
- Merge all the raw profiles and profile data into one single profile data file using LLVM-PROFDATA.
- Run LLVM-COV on all the instrumented executable binary along with their architectures and the above profile data file to emit the code coverage information.
As we already know that Xcode generates the Coverage.profdata file for the main application instrumented executable binary, we now have to combine rest of the raw profiles (each for our in house development pods) to get a combined profile data file using the LLVM-PROFDATA command.
xcrun llvm-profdata merge <FIRST_RAW_PROFILE> <SECOND_RAW_PROFILE> ... Coverage.profdata -output <COMBINED_PROF_DATA>LLVM-COV tool has sub commands to emit the code coverage report that are as follows:
- gcov - Compatible with gcc, it reads code coverage data files and displays the coverage information for a specified source file (deprecated from Xcode 7).
- show - Shows line by line coverage of all the instrumented executable binaries using the profile data PROFILE. It can optionally be filtered to only show the coverage for the listed files.
- report - Displays a summary of the coverage of all the instrumented executable binaries using the profile data. It can optionally be filtered to only show the coverage for the listed files.
- export - Exports coverage data of the all the instrumented executable binaries using the profile data in either JSON or lcov trace file format.
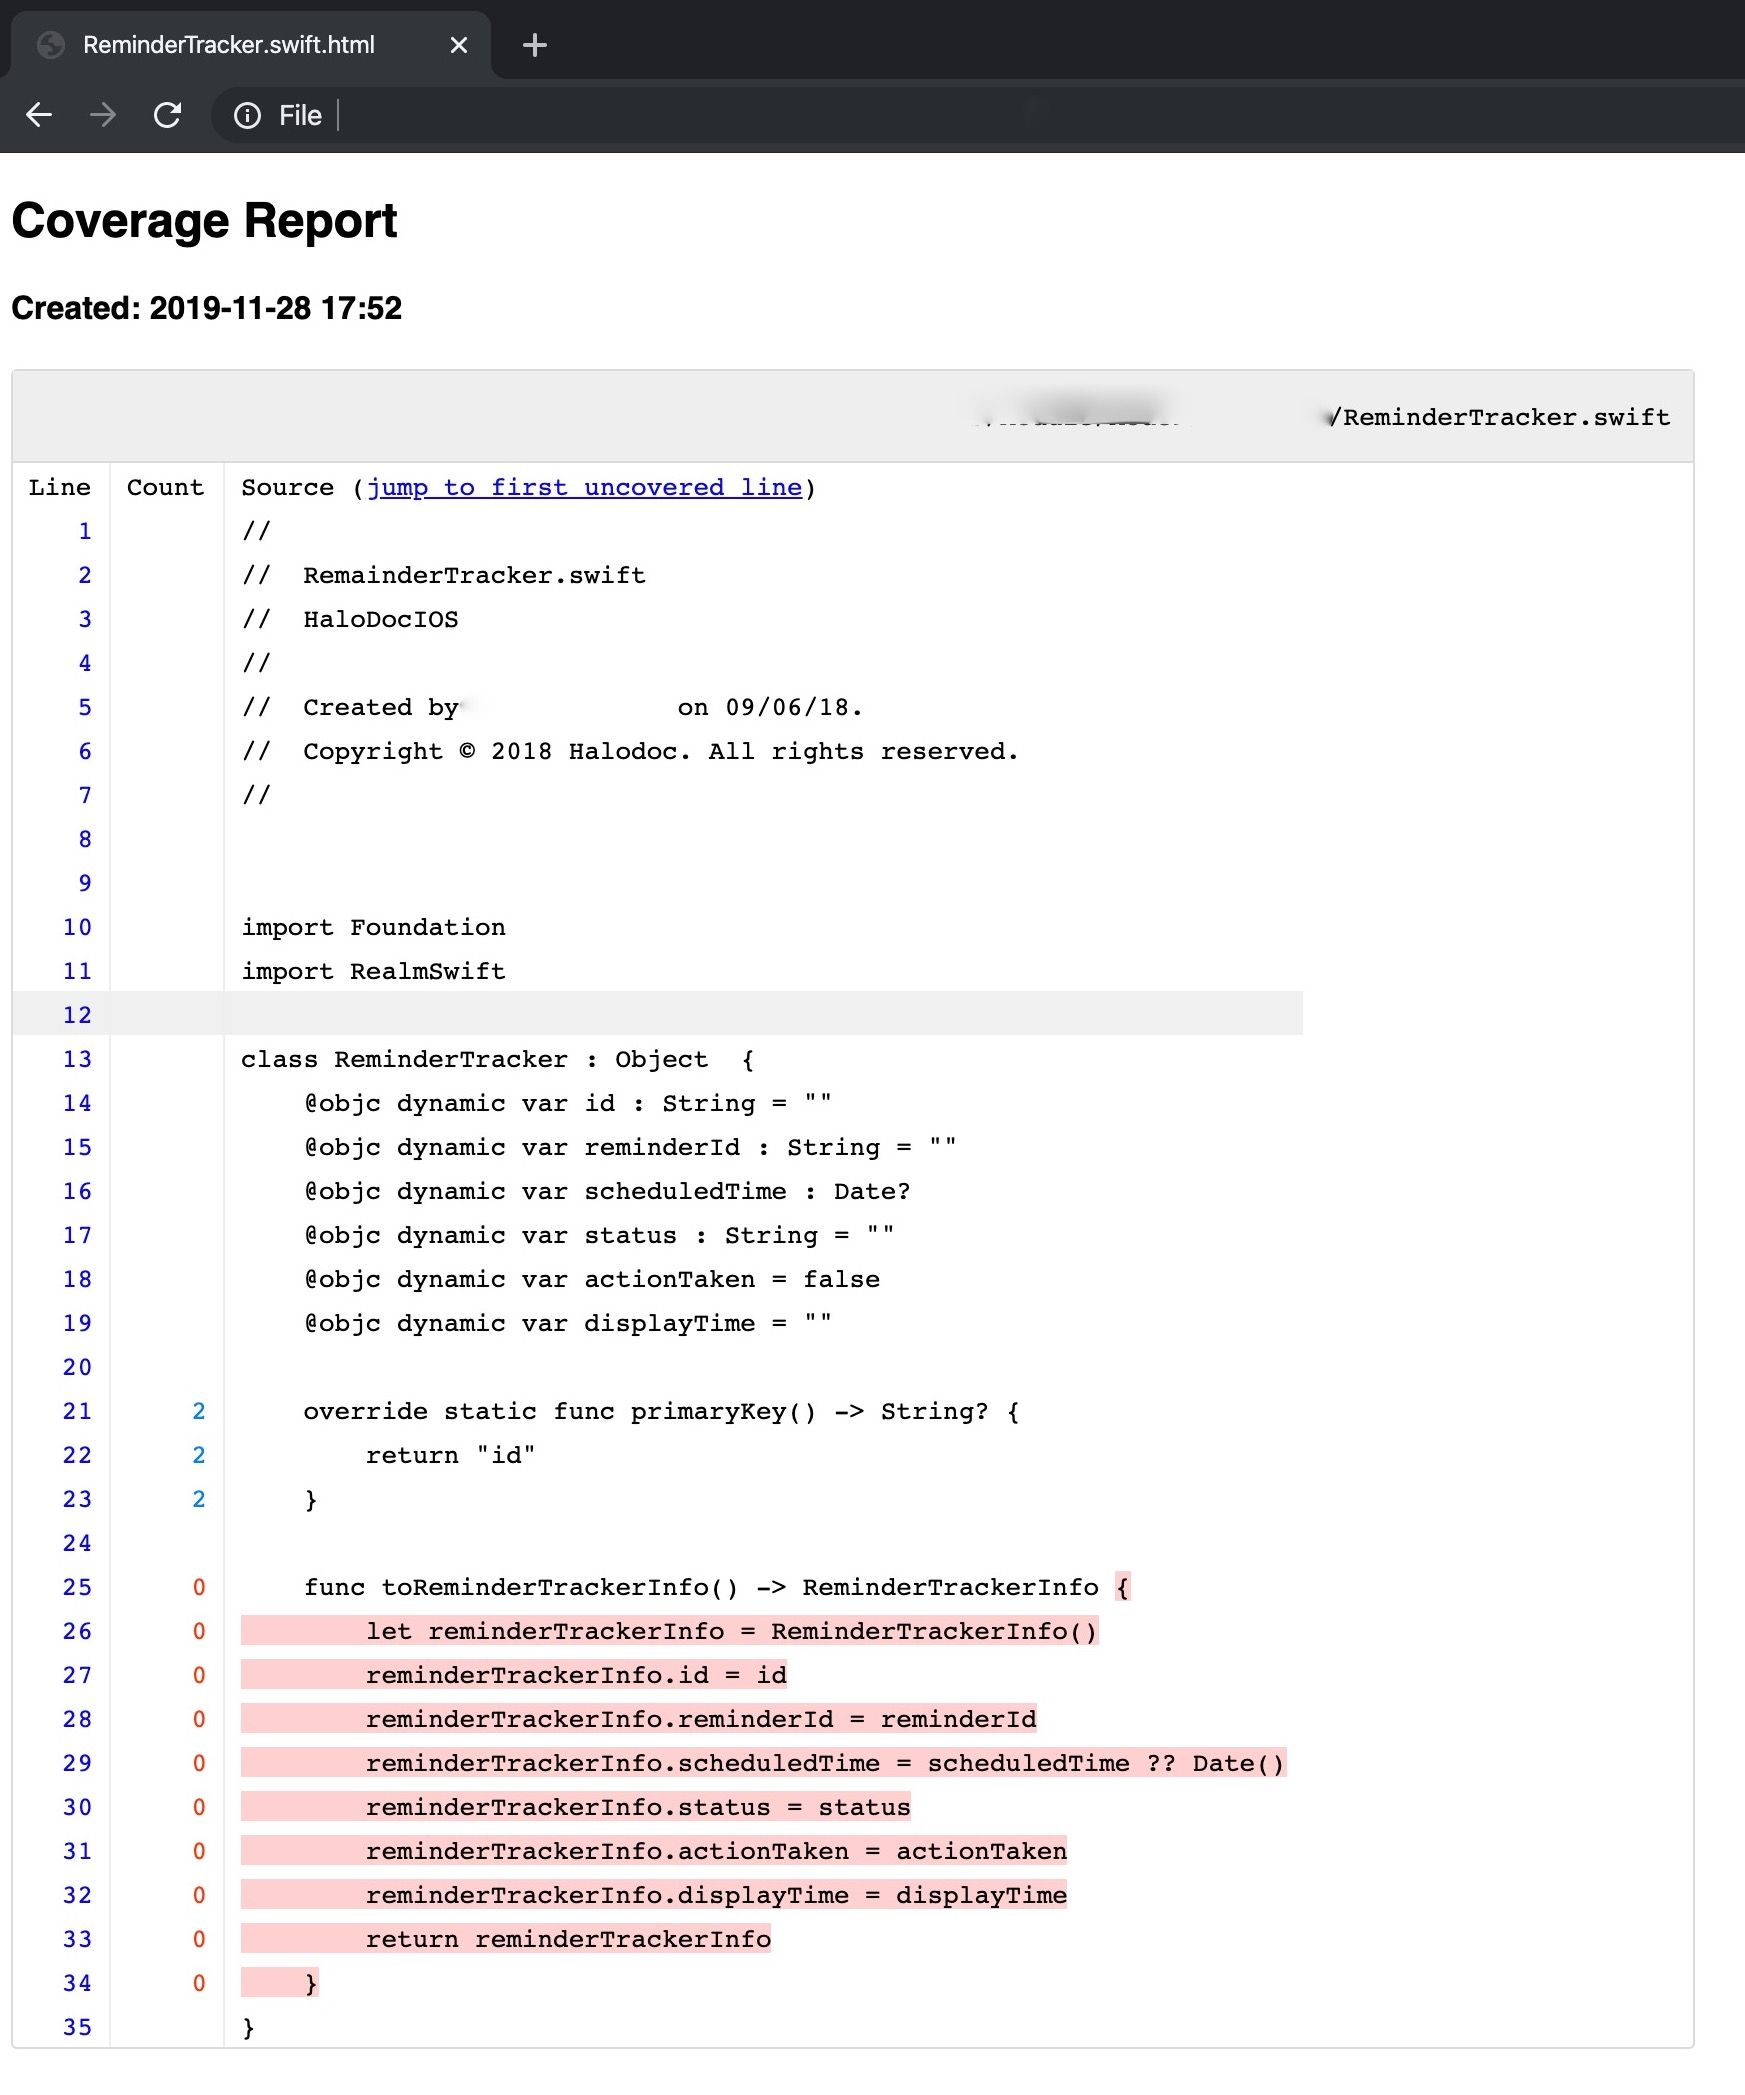
We chose the show command to get line-by-line coverage along with the html option to get a proper insight into the metrics and see which files and functions are already exercised by our test suite.
xcrun llvm-cov show -output-dir=<YOUR_OUTPUT_DIRECTORY> -format=html -instr-profile=<OUTPUT_PROF_DATA> -arch=x86_64 -object=<YOUR_INSTRUMENTED_FIRST_EXECUTABLE> -arch=x86_64 -object=<YOUR_INSTRUMENTED_SECOND_EXECUTABLE> ....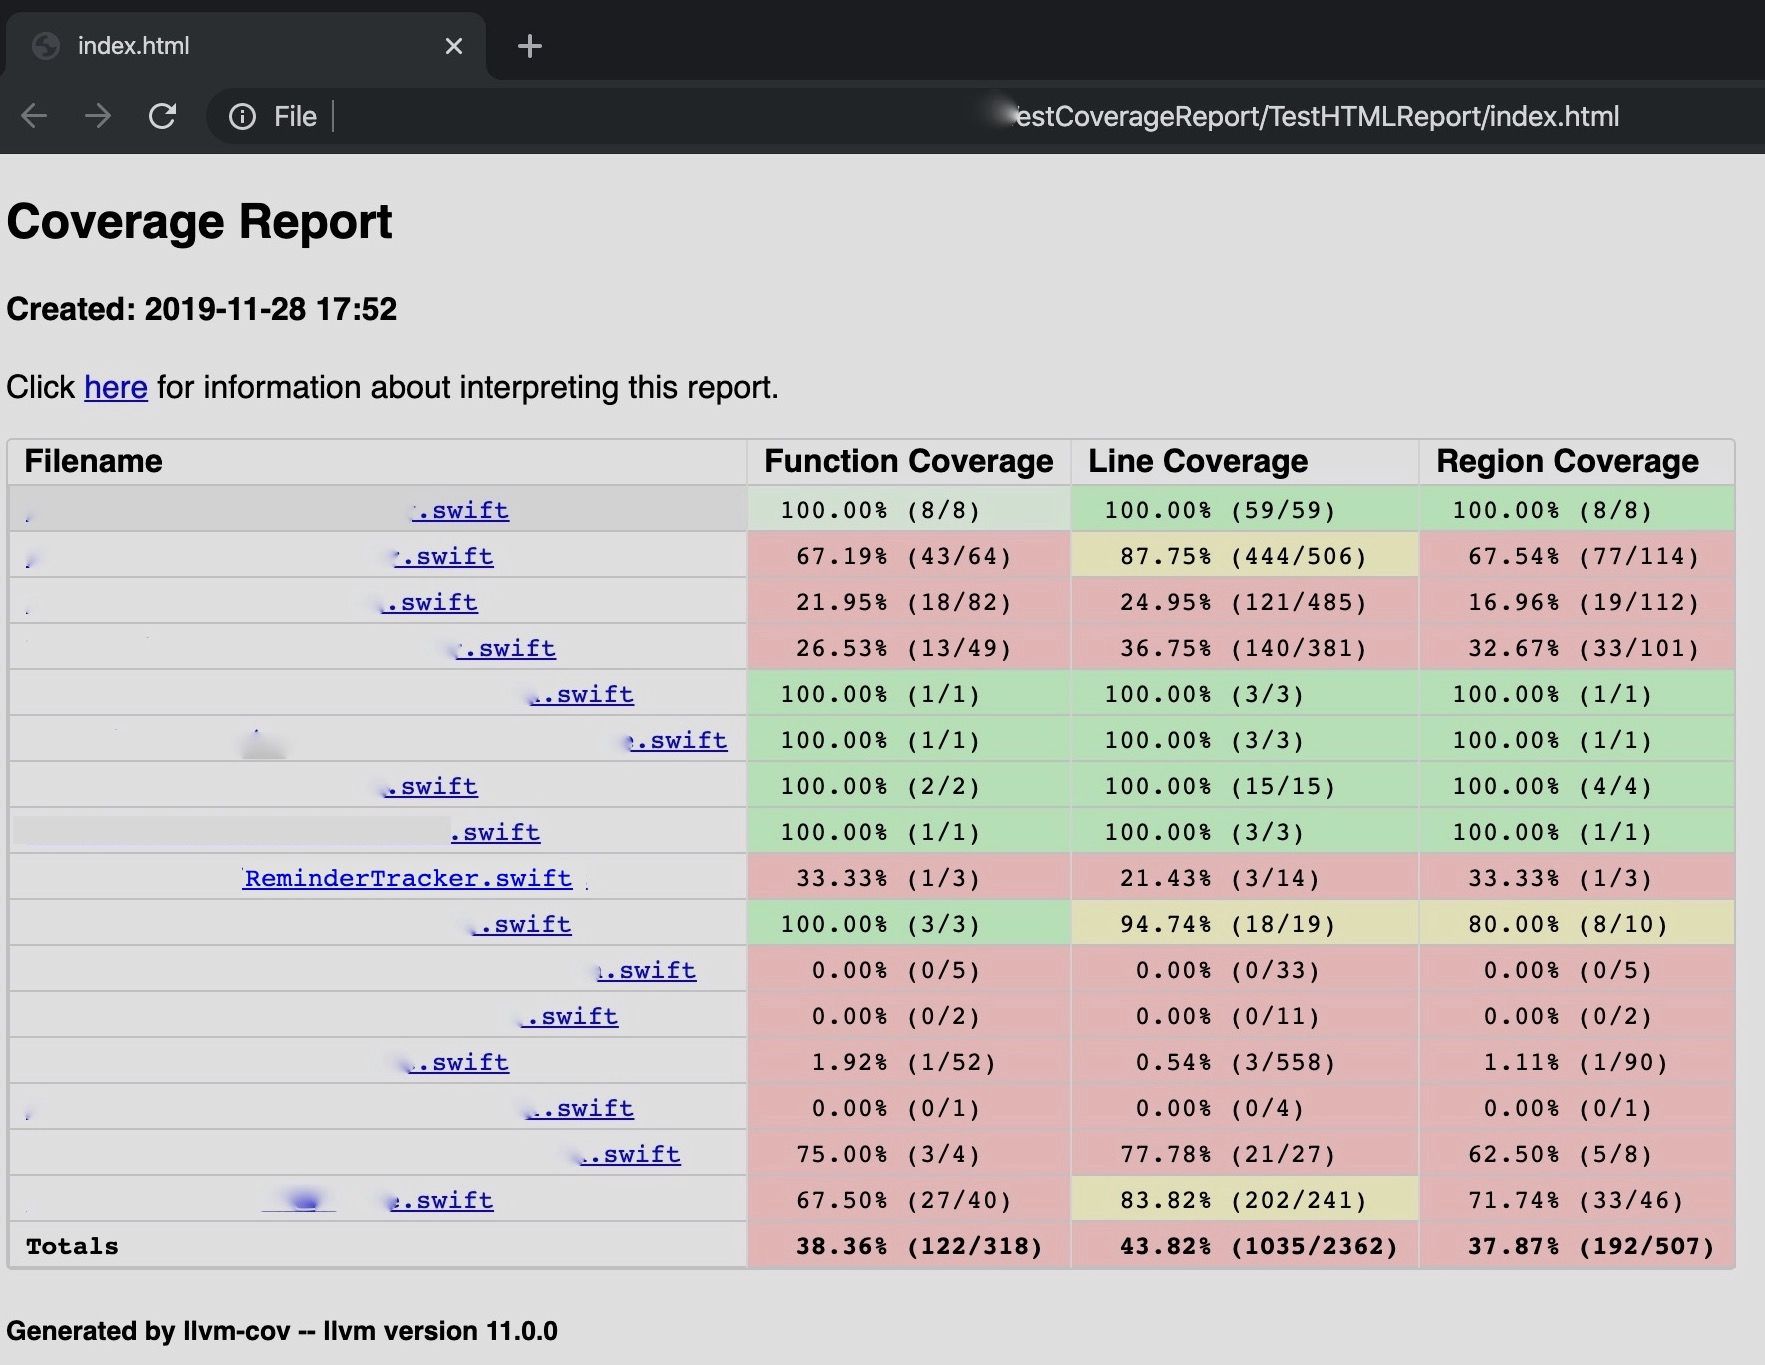
With the above commands from LLVM, we are able to emit Function, Line and Region Coverage Metrics. We have also setup a Jenkins Job which runs at the end of the day to provide insights into how much of our code base is unit tested. I shared my findings with the Swift enthusiasts in a talk in Swift BLR Chapter #18.
We are always looking out to hire for all roles for our tech team. If challenging problems that drive big impact enthral you, do reach out to us at careers.india@halodoc.com
About Halodoc
Halodoc is the number 1 all around Healthcare application in Indonesia. Our mission is to simplify and bring quality healthcare across Indonesia, from Sabang to Merauke.
We connect 20,000+ doctors with patients in need through our teleconsultation service, we partner with 1500+ pharmacies in 50 cities to bring medicine to your doorstep, we partner with Indonesia's largest lab provider to provide lab home services, and to top it off we have recently launched a premium appointment service that partners with 500+ hospitals that allows patients to book a doctor appointment inside our application.
We are extremely fortunate to be trusted by our investors, such as the Bill & Melinda Gates foundation, Singtel, UOB Ventures, Allianz, Gojek and many more. We recently closed our Series B round and In total have raised USD$100million for our mission.
Our team work tirelessly to make sure that we create the best healthcare solution personalized for all of our patient's needs, and are continuously on a path to simplify healthcare for Indonesia.