
Performance monitoring web apps using WebPageTest, InfluxDB and Grafana
Being a rapidly growing, fast-paced start-up, our website(www.halodoc.com) is continuously evolving & undergoing lots of changes. Hence, it becomes very important for us to ensure that our web pages are performing well at ALL times, especially after every production deployment. For this we have setup a performance monitoring system run at regular cadence.
In this blog, we provide a walkthrough on how we set up this workflow to monitor any web page performance.
Let's begin...
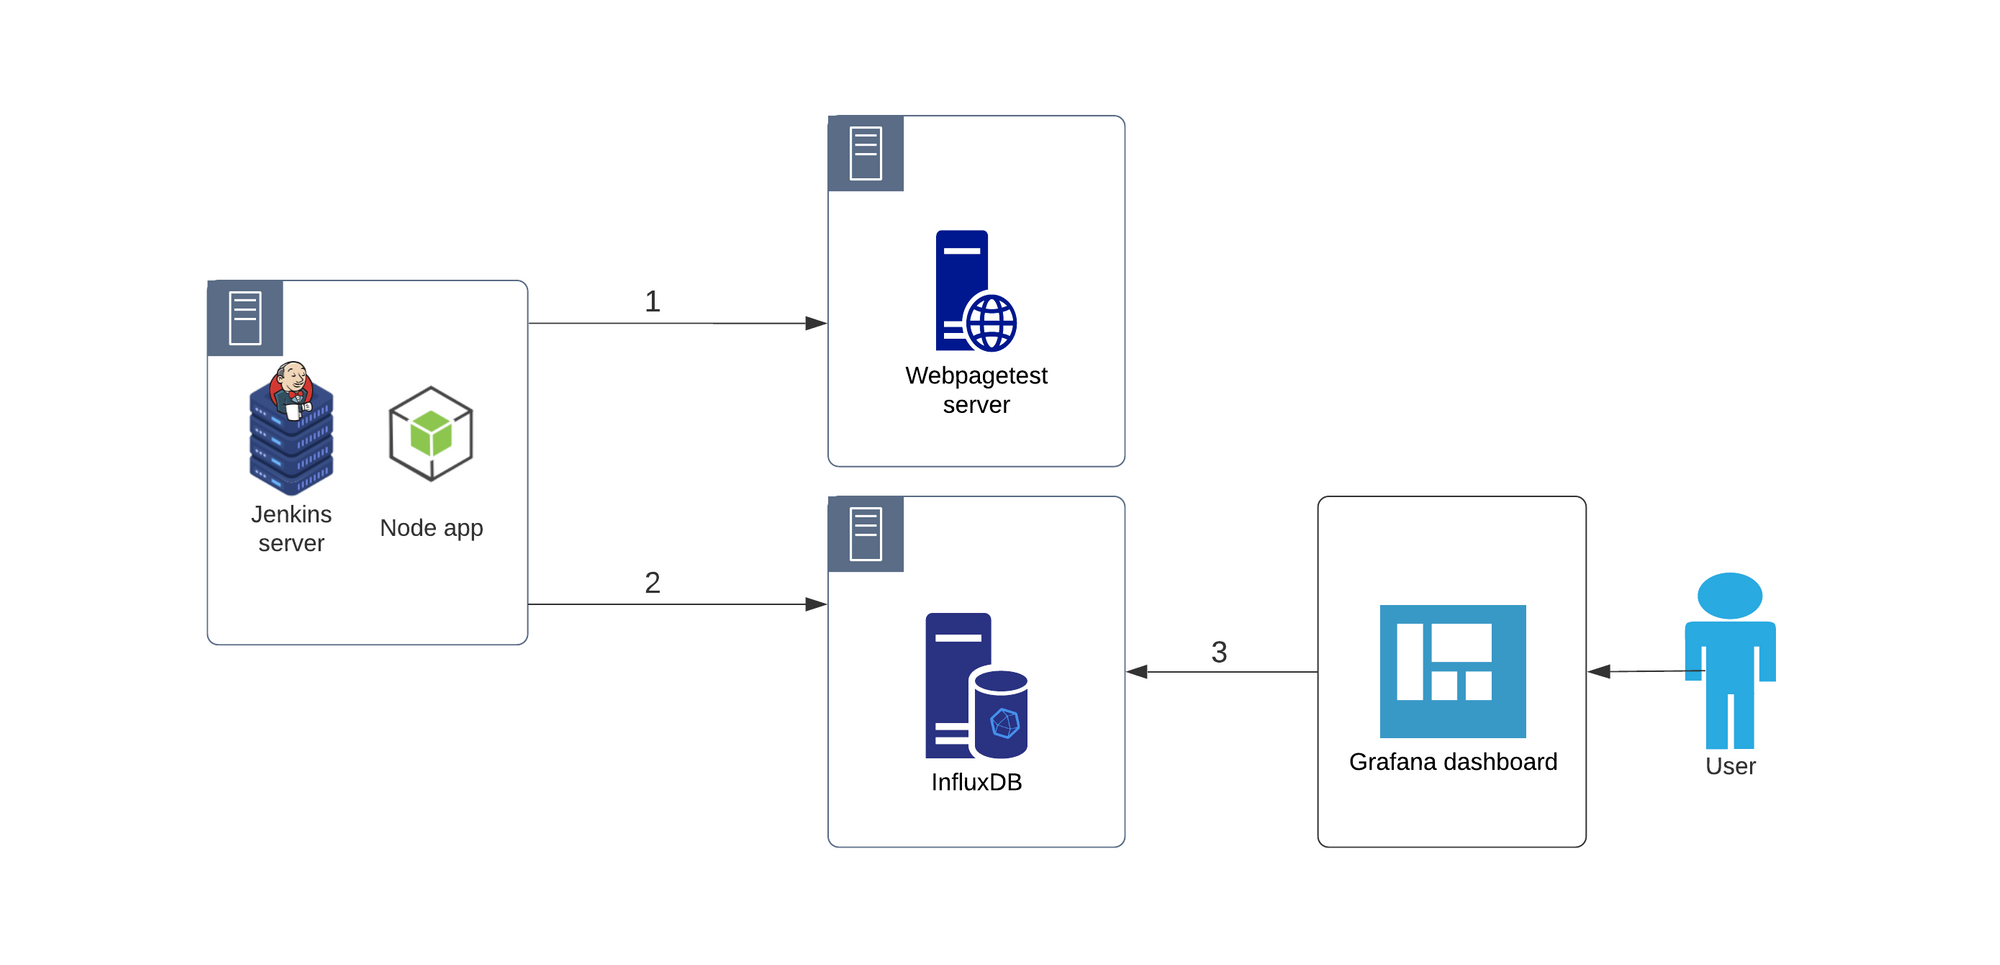
Monitoring of any web application for performance involves 3 main steps as outlined below:
1. Profiling the web page performance
2. Storing the data that's generated (in step#1)
3. Data visualization for different performance metrics (that are stored in step#2)
1. Measuring the web page performance
As mentioned above, to measure the web page performance, we are going to use Webpagetest.
Why WebPageTest?
- It's an open-source tool which lets us run location-based tests. This location based testing becomes very important when a website is developed in one part of the world but its customer base is in another part (which is exactly the use-case for us). In our case, our website is run in the AWS Singapore region, catering to our customers in Indonesia.
- It uses real devices (mobile/desktop) to run the tests & not any emulator. So the performance metrics data is by far more accurate than using an emulator.
- We can also configure connection type for our tests (2G, 3G fast, 3G slow etc.). This is very helpful in knowing how our web pages are performing with different network speeds.
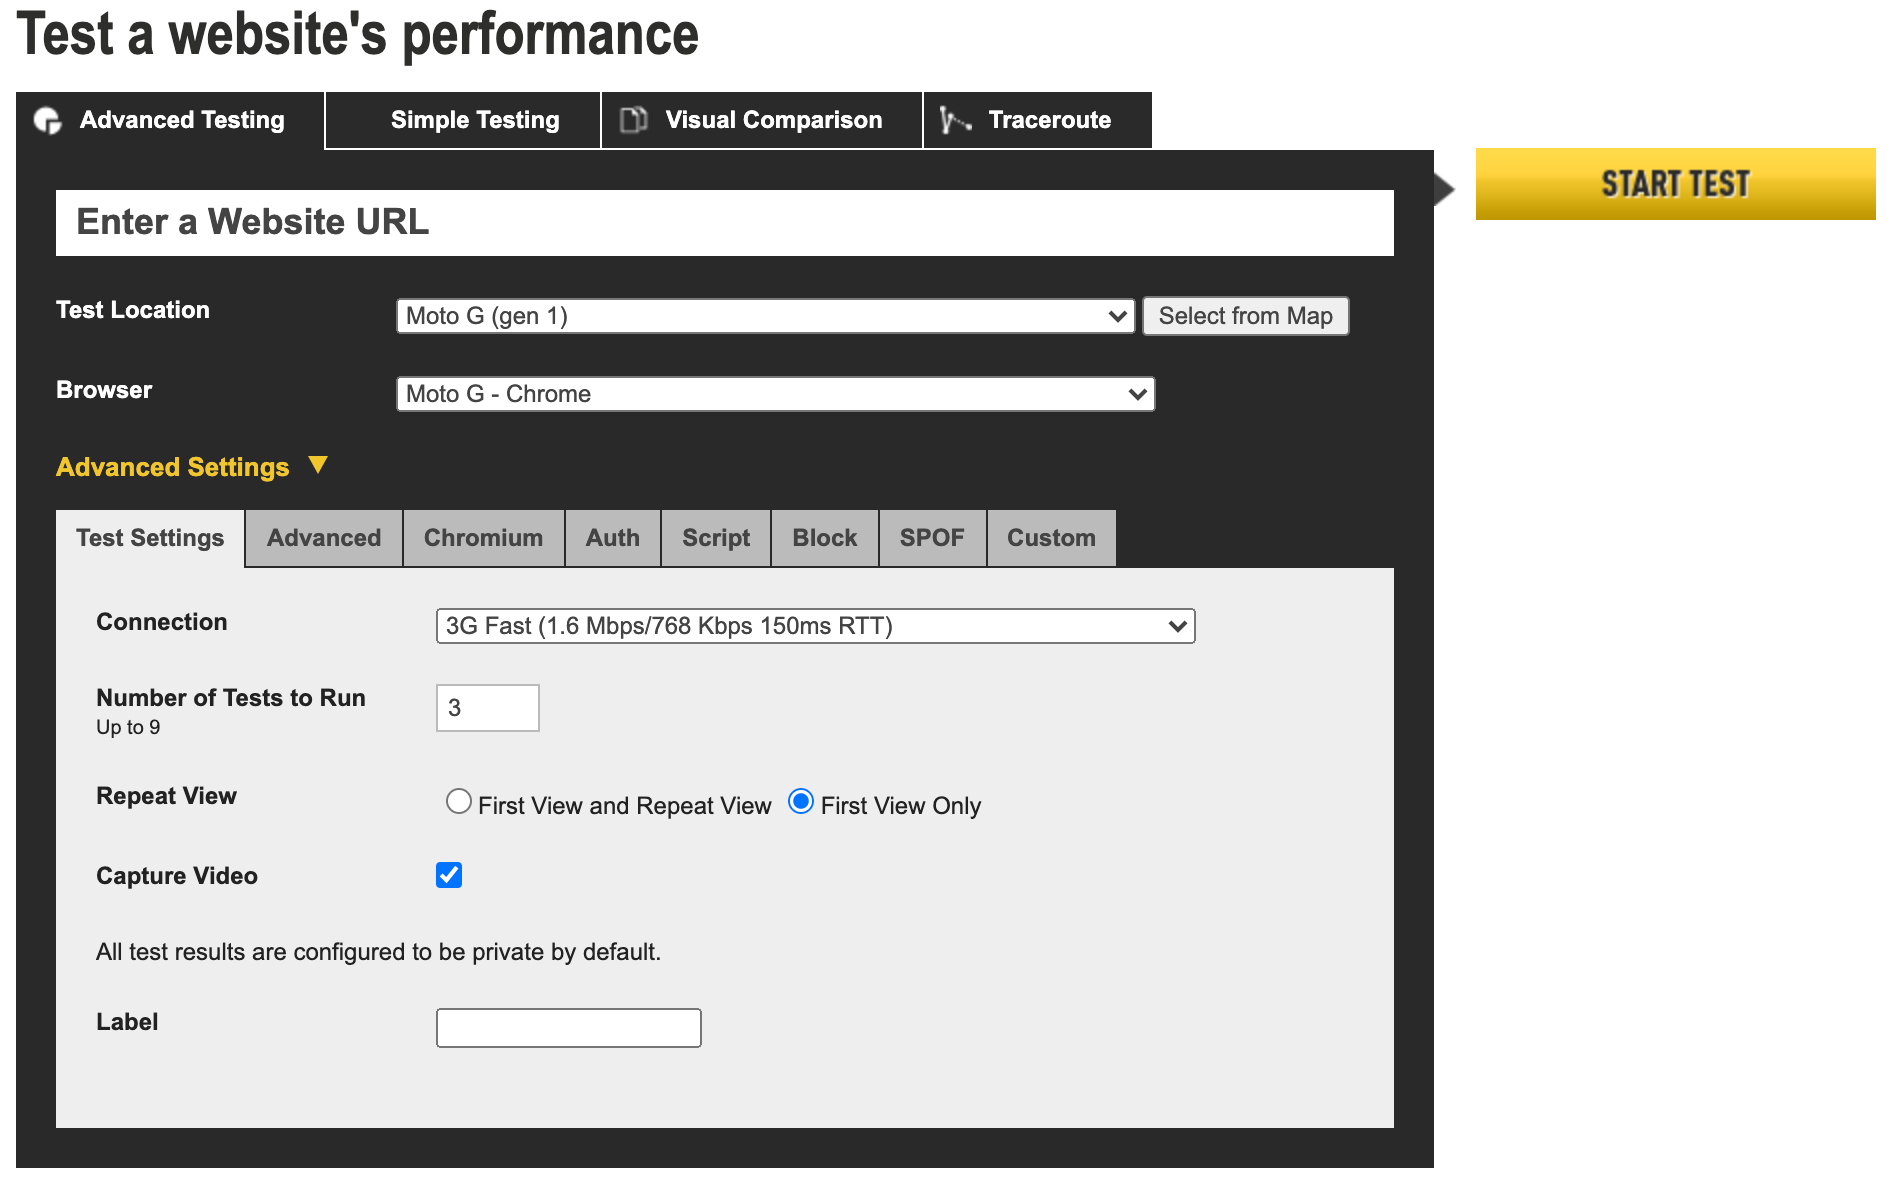
There is an online version of Webpagetest at https://www.webpagetest.org, where we can run performance tests for web pages. There are many configurations available that can be used as per one's needs.
However, setting up an automated workflow is a bit technically challenging with this tool. Hence, we are going to create a small NodeJS application that will hit the Webpagetest server with all the required configurations, in order to overcome this technical challenge of this tool.
The node app will have two dependencies:
1. webpagetest-api -> webpagetest API wrapper for NodeJS
2. axios -> Promise based HTTP client for the browser and node.js
To run a test on Webpagetest is pretty simple & straight forward. All we need to do is, create an instance of WebPageTest class & call its runTest method.
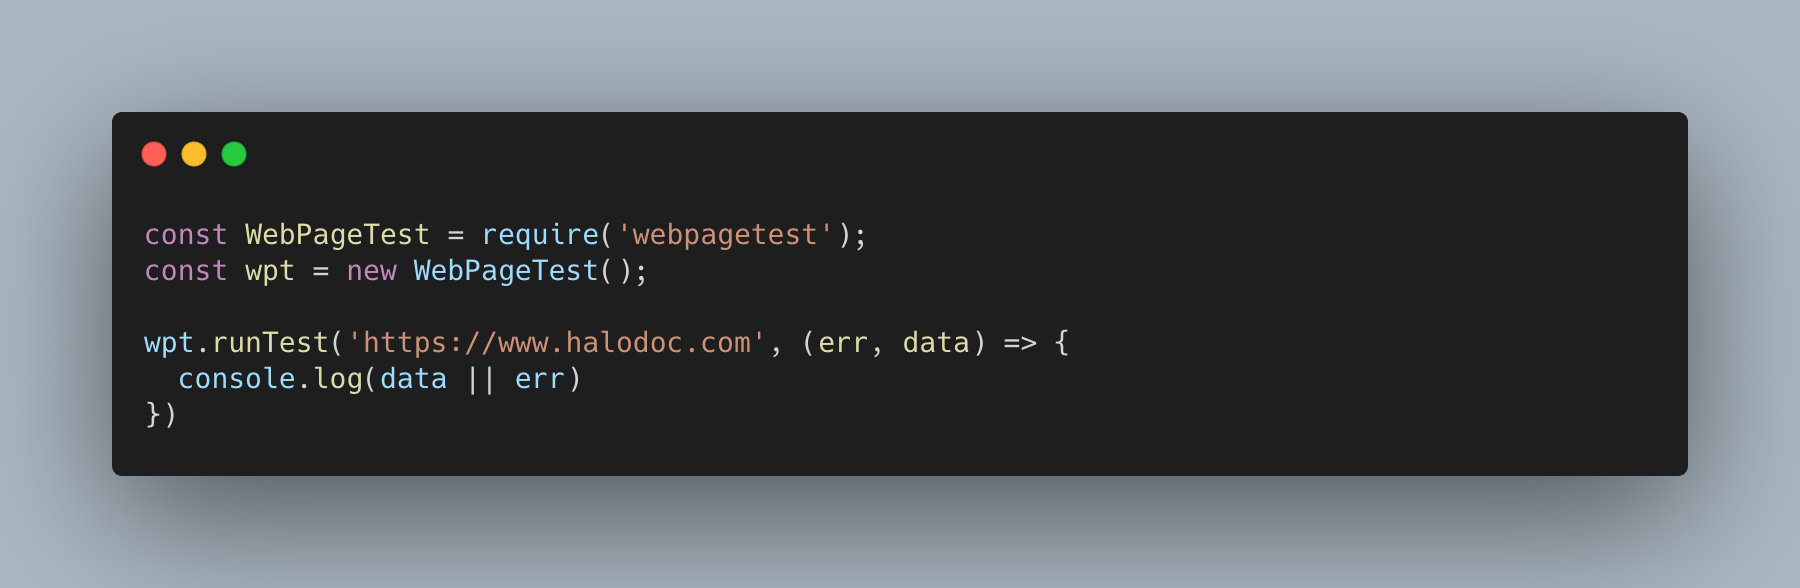
This will trigger the test with the default configuration. To run this test with required configurations, we need to pass the config object to runTest method.
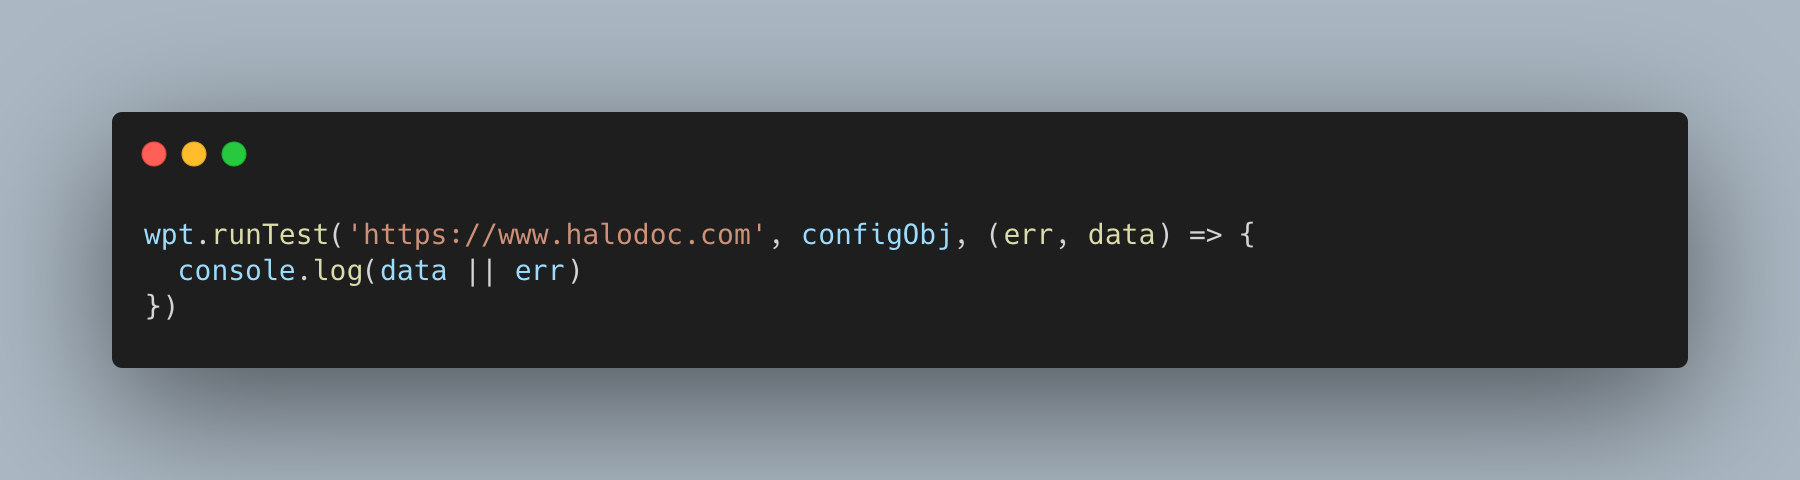
Please refer webpagetest-api documentation for all the available configuration options
The response data for this test on success is going to be a json object.
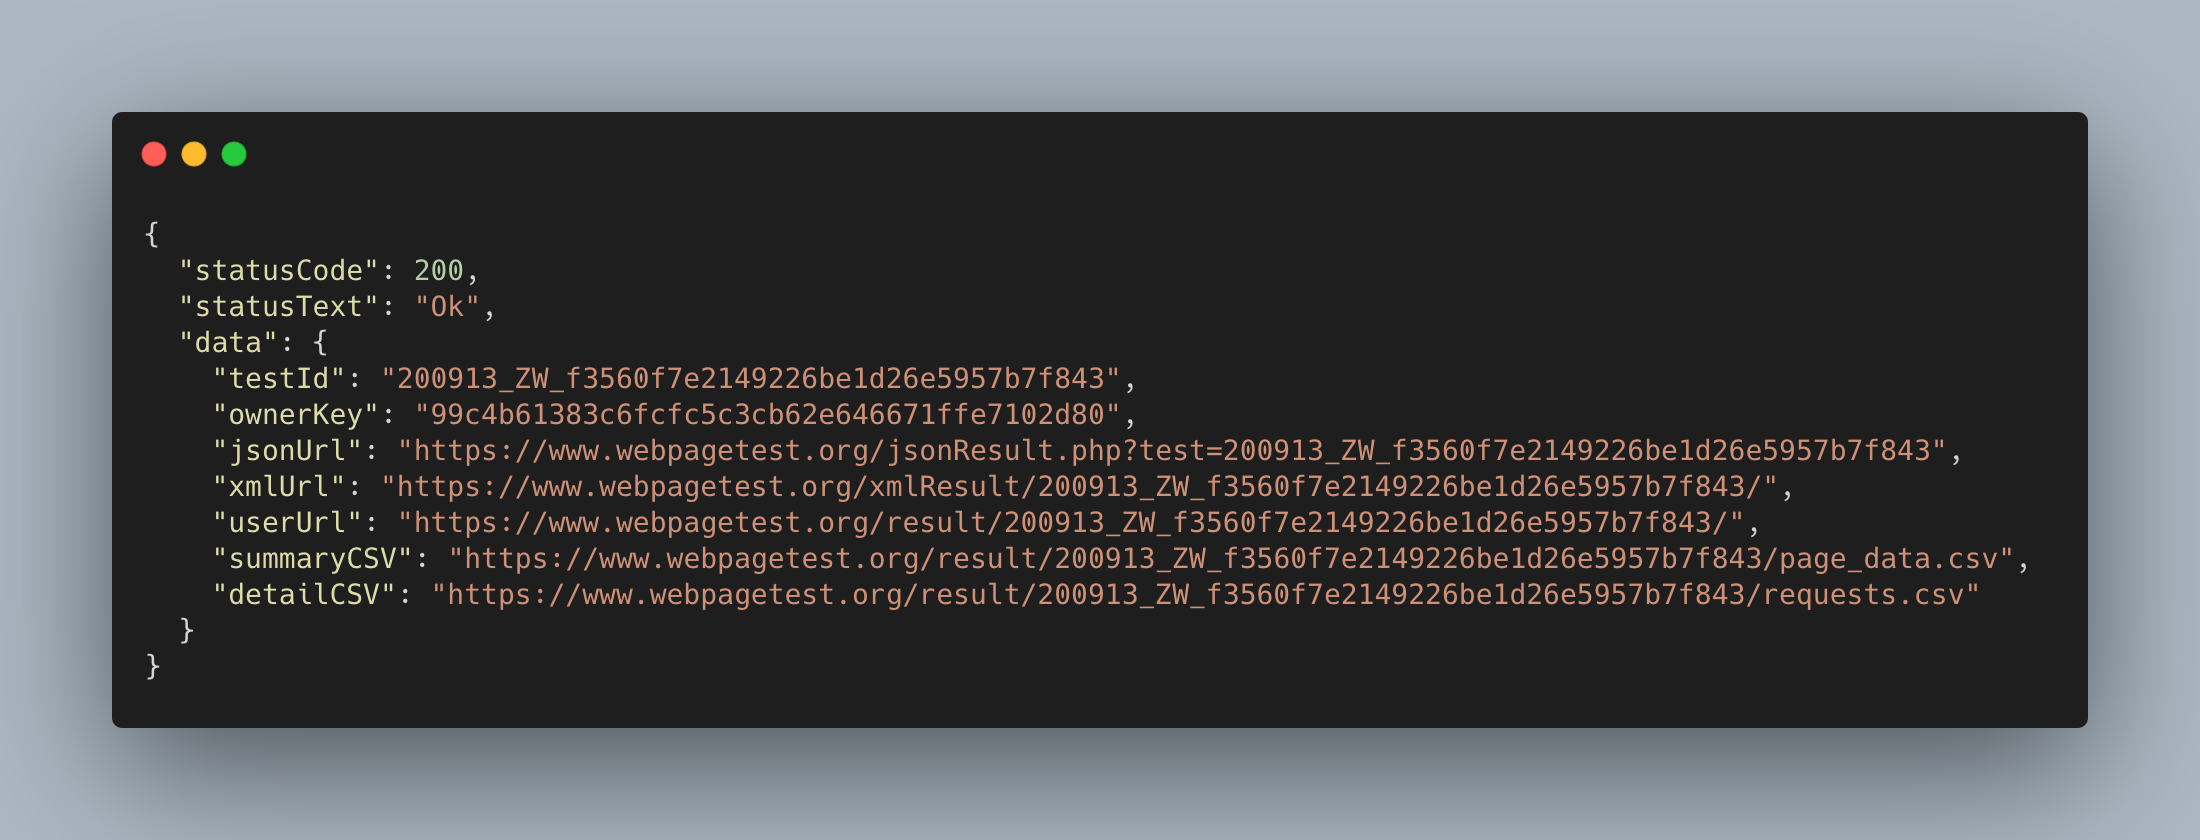
In the above response, as we can see, the test results are available in multiple formats. For our use-case we will be using the jsonUrl attribute.
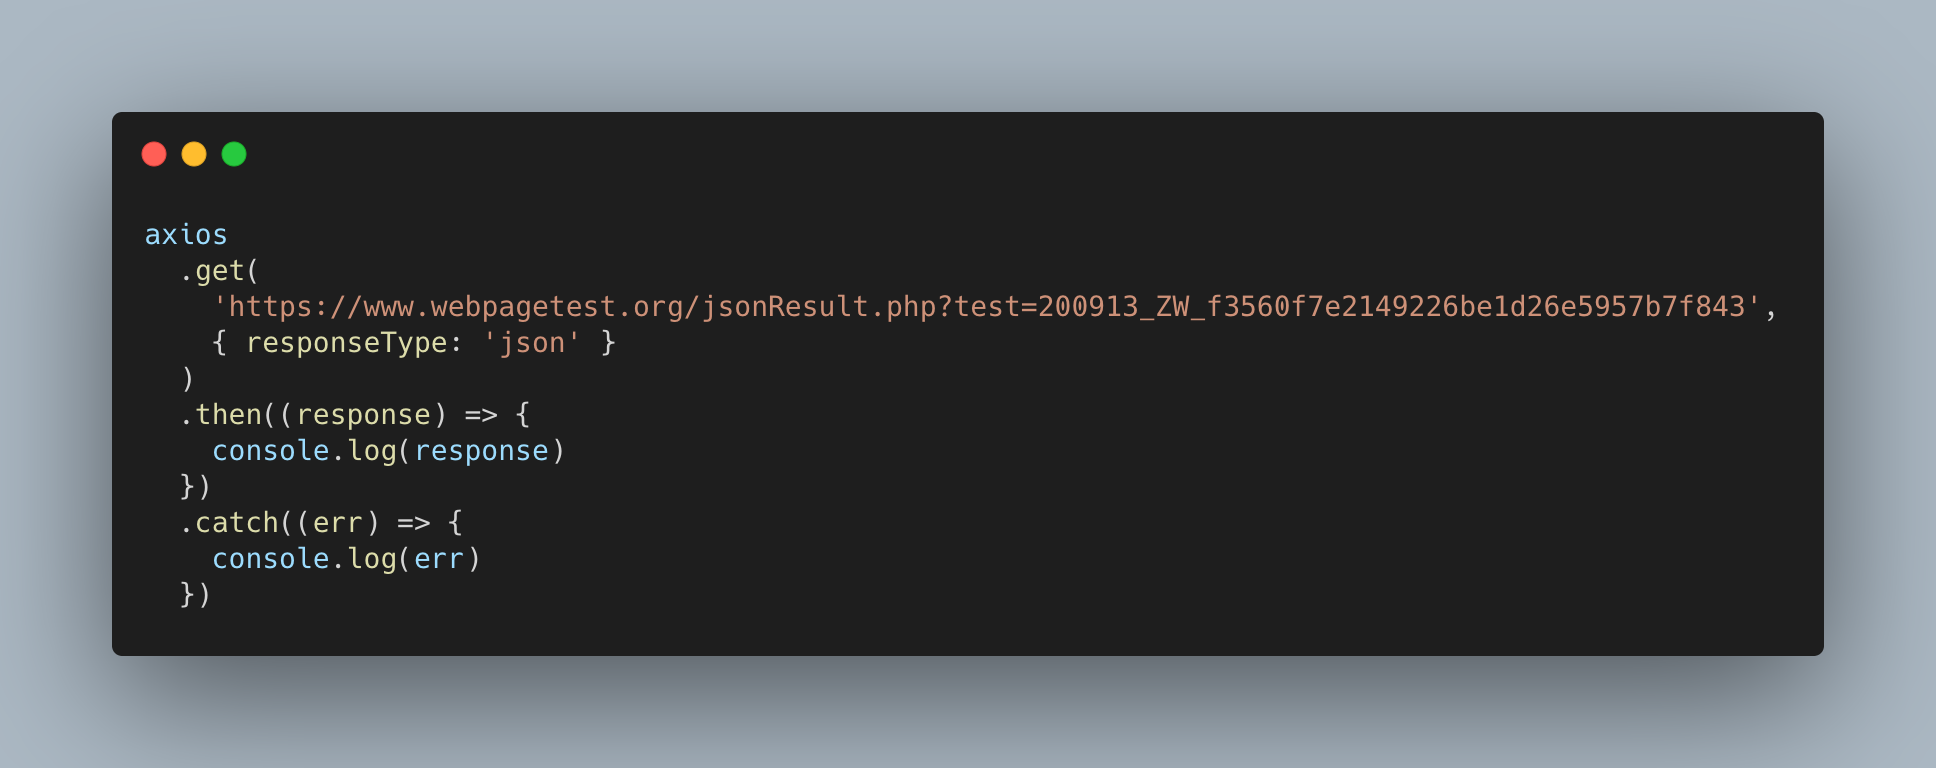
So now we have all the performance metrics data for the test in JSON format. In the next step we are going to store it in the database for continuous monitoring.
NOTE: After we run the test, it takes some time for the test result to be available. The time depends on the number of tests that are queued before your test on webpagetest server.
2. Storing the performance metrics data
To store the data we are going to use InfluxDB, a time series database.
Why InfluxDB ?
- InfluxDB provides inbuilt APIs to write data to it. With MySql we need to write our own APIs.
- To plot the graph against any metric we need to store the data against time, in a time series DB, such as InfluxDB.
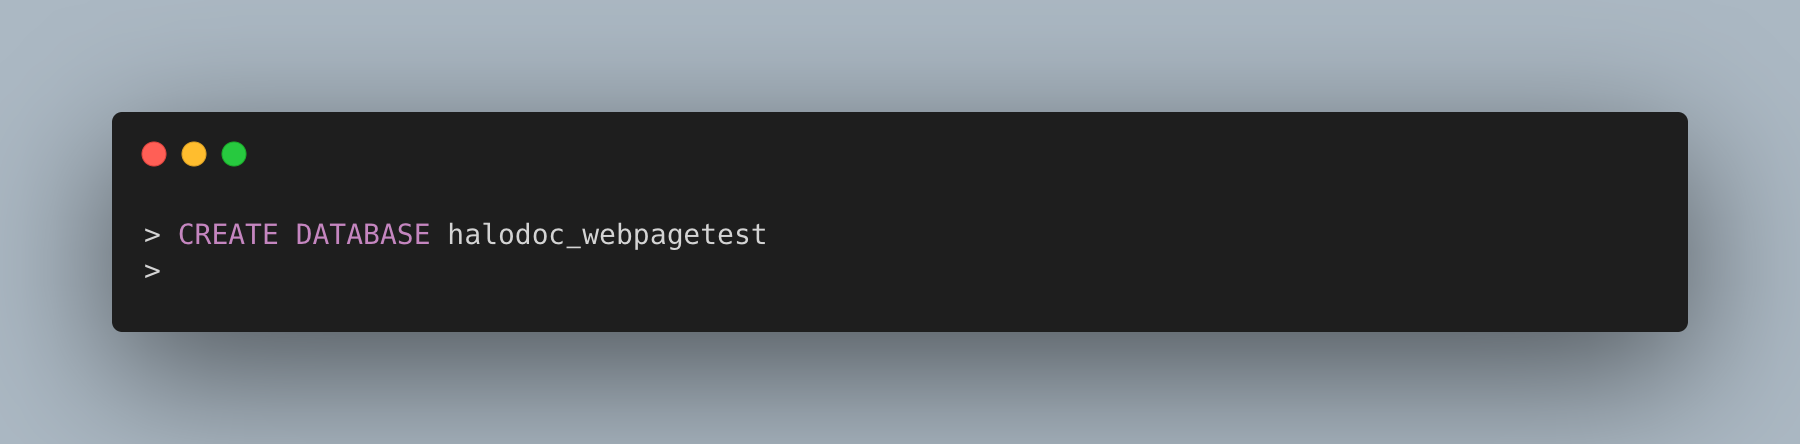
Once the Influx DB engine has started(if its not running already), let's create a database named halodoc_webpagetest. We are going to use this database to store our performance metrics data. (Please note: In this example, we're running a local instance of Influx DB).
To write data to this DB, we are going to use /write endpoint provided by Influx DB. But before we make a call to this endpoint, the JSON data that we got in previous step, needs to be converted to a particular format that InfluxDB expects. This format is called line protocol. It's a text-based format for writing points to influxDB.
<measurement>[,<tag_key>=<tag_value>[,<tag_key>=<tag_value>]] <field_key>=<field_value>[,<field_key>=<field_value>] [<timestamp>]Please refer InfluxDB documentation for more details.
Now let's assume we are going to monitor two performance metrics for this page, TTFB & First Contentful Paint. So we will get values for these two from the result JSON & create request data using line protocol.
halodoc_home loadTime=31996,TTFB=1476,firstContentfulPaint=5166 1599935400000000000Let's save this data to DB.

Now since we have successfully saved the metrics data to DB, let's move to next step where we can visualize these data points graphically.
3. Data visualization
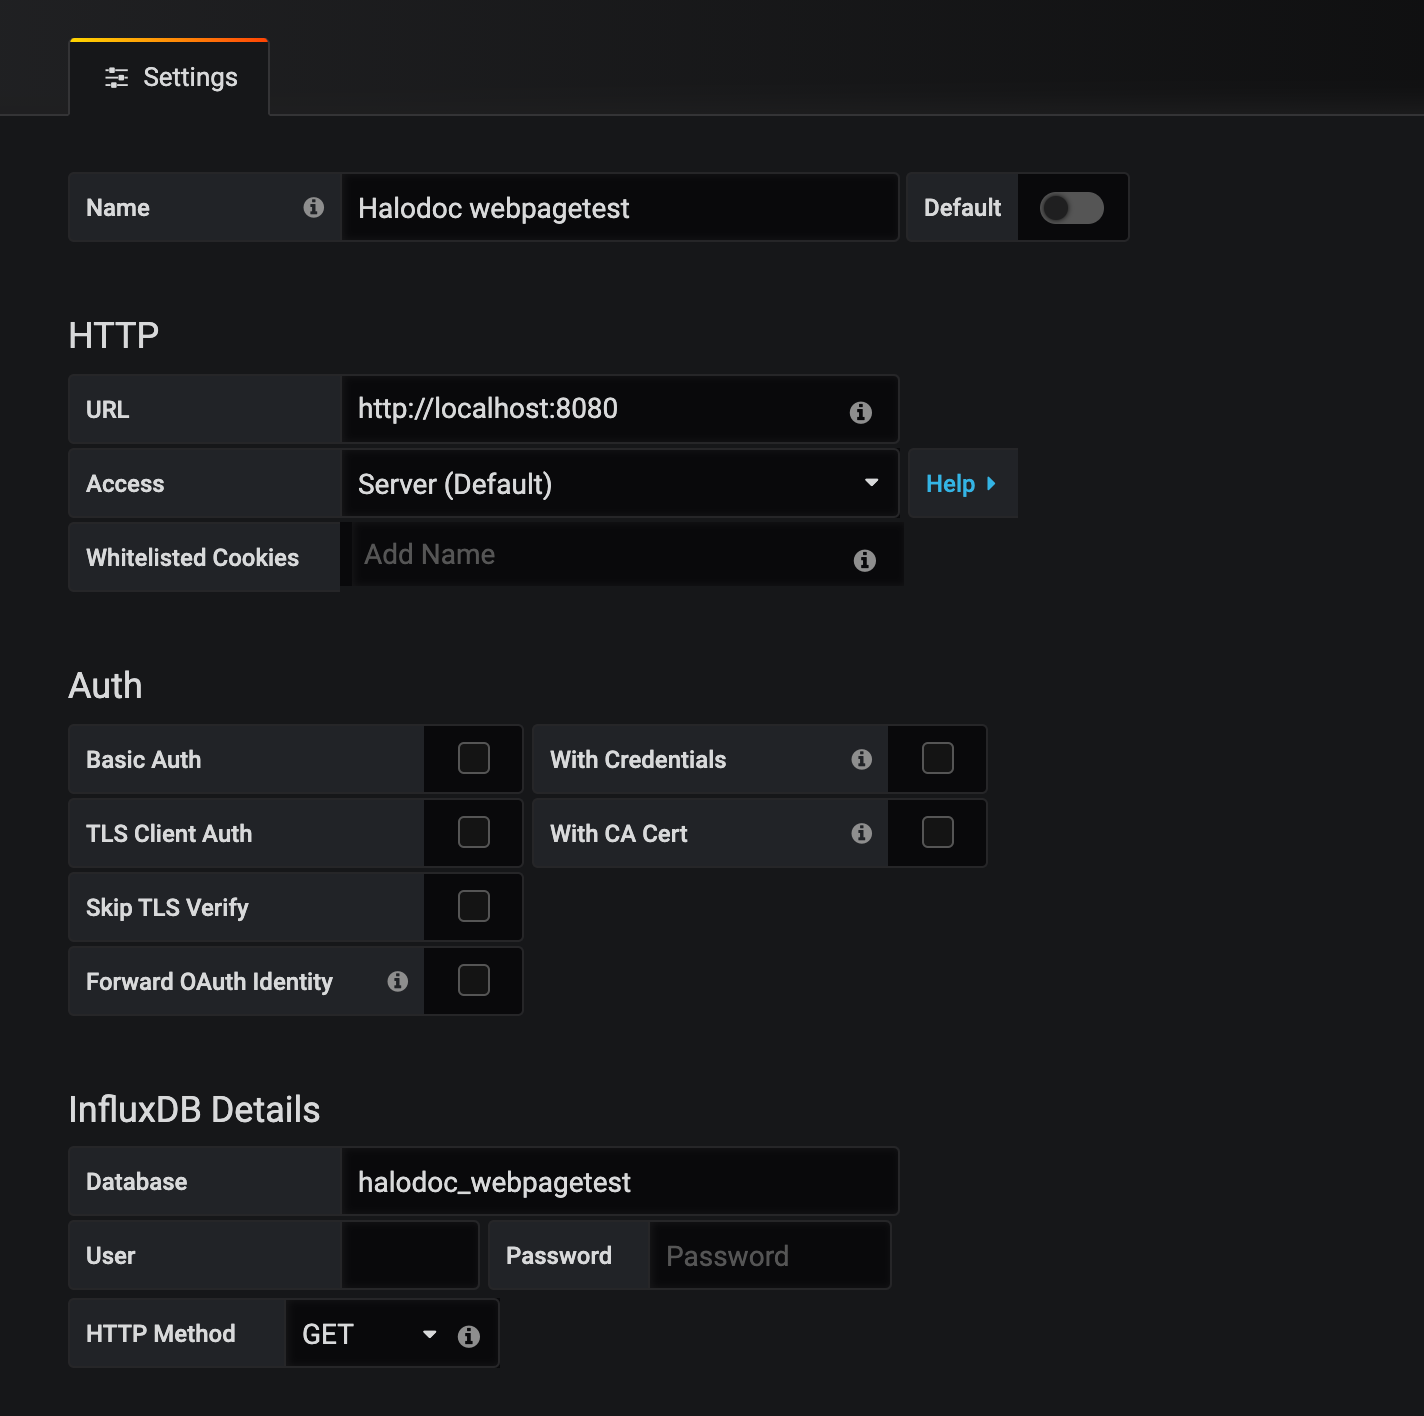
To visualize the data points we are going to use Grafana. For this we need to create a datasource of type InfluxDB in Grafana portal.
The datasource configuration would look something like this
Once the datasource is ready, all we need to do is create a dashboard & use it.
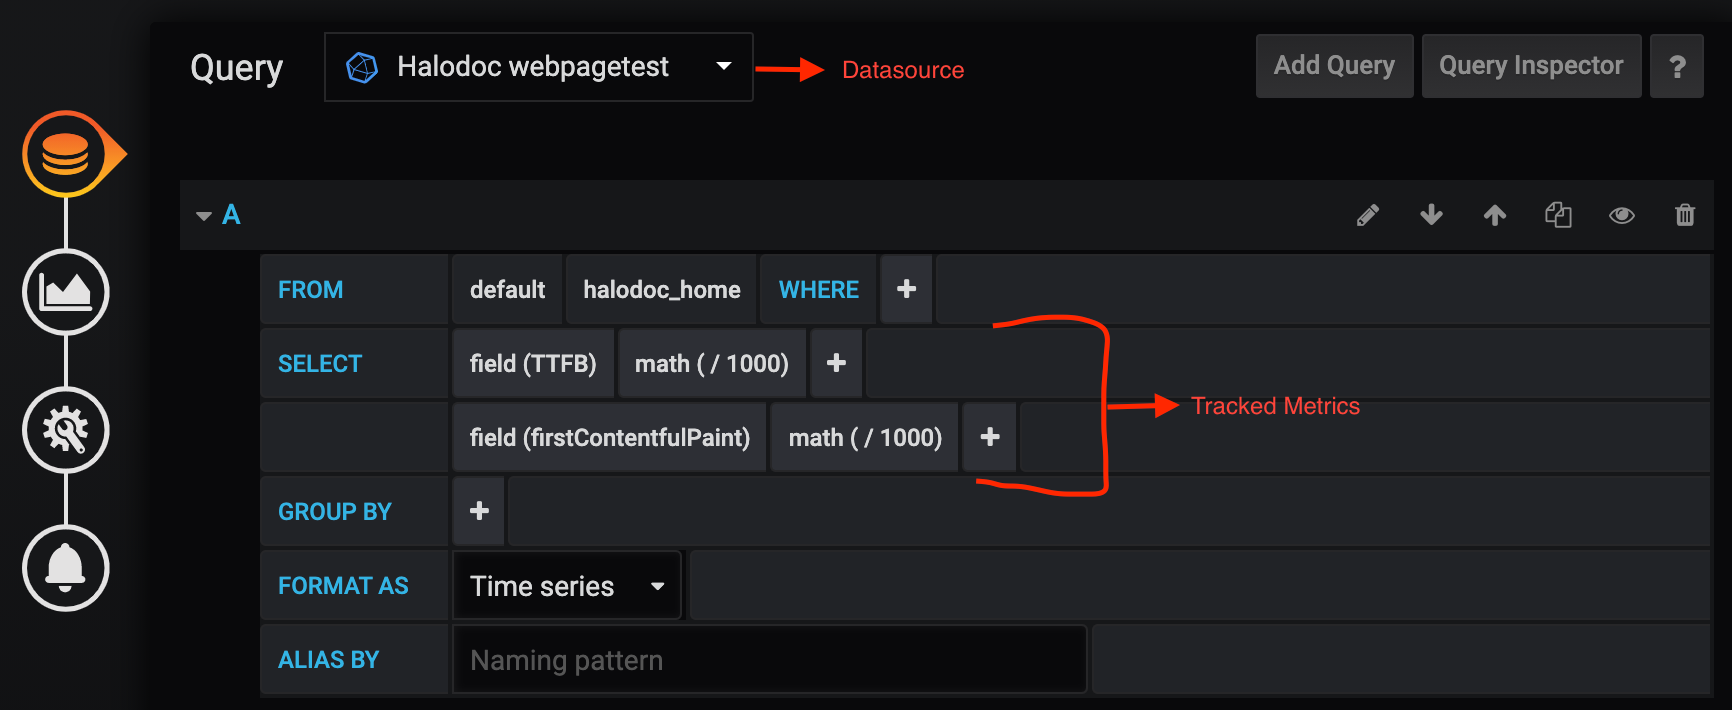
The panel settings for the dashboard will be something like this:
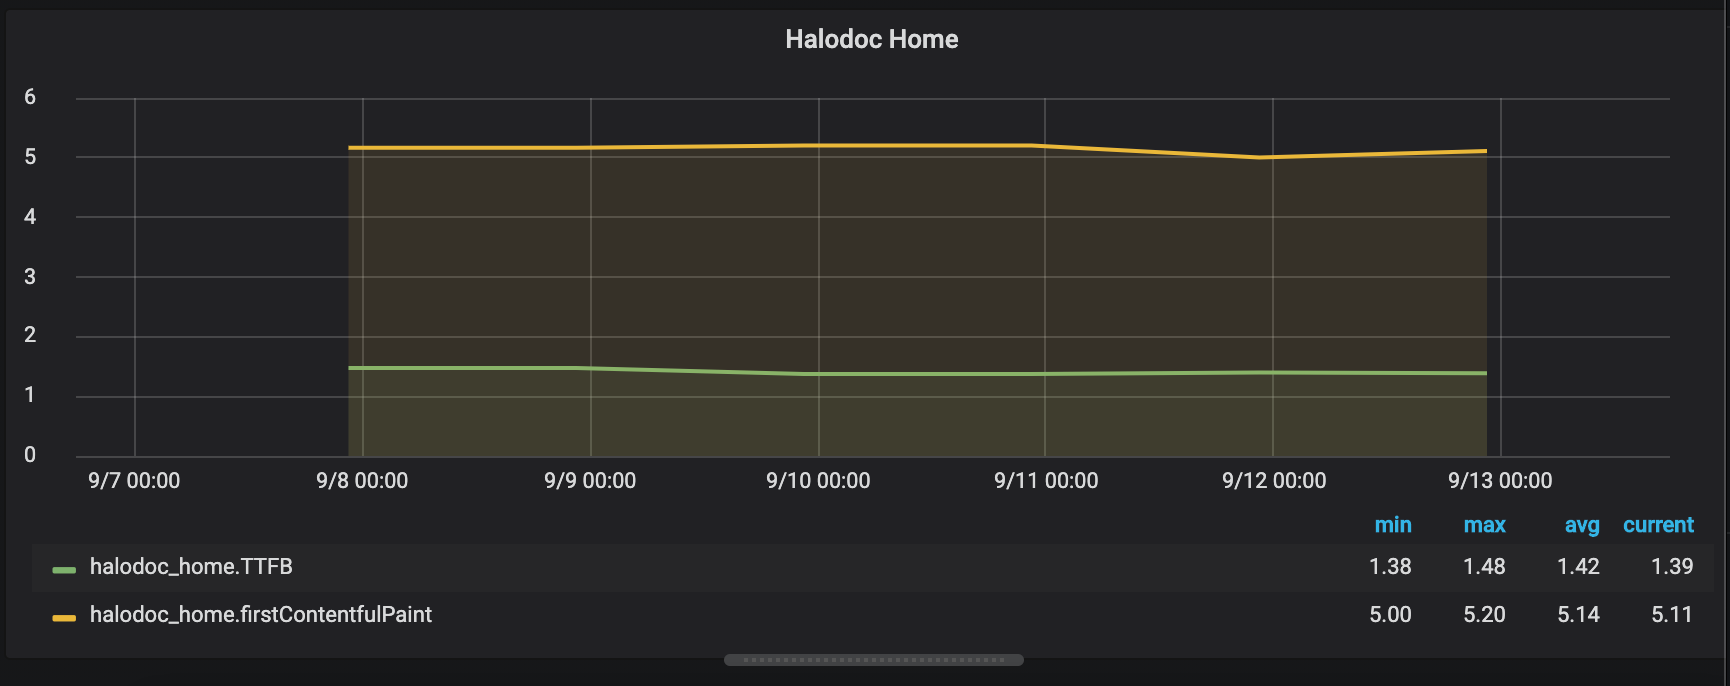
And on running this test for multiple times for the same page, the dashboard panel is going to look somewhat like this:
So now we are almost done with the setup, except for automatically scheduling the NodeJS application to publish the metrics to Influx DB. For this we can take help of Jenkins by creating a Jenkins task that can be scheduled to run periodically.
One last thing to note here is, since the result for Webpagetest is not going to be instantly available after running the test.
There are two solutions for this:
- Our NodeJS app will need to continuously poll/ping the WebpageTest server to download the results when they become available. Webpagetest provides a configuration for polling of result.
- The other approach would be to store the response JSON that we get after starting of test, in a separate file. Using this file data, we can hit the webpagetest server after few hours of running of test.
As per current traffic on webpagetest server, after around 3-4 hours of running of test, there is a very high probability that the result will be available.
The first approach has higher resource consumption than the second one, as we need to keep our application running for longer time.
For second approach, we can create two Jenkins jobs, one to trigger the test & store corresponding response in a JSON file and second one to get the result data (using the JSON file created by first Jenkins job) from webpagetest server & store them to database.
In our case, we went with approach#2 above to download the results from WebPageTest and publish it to Grafana via InfluxDB.
Conclusion
Web page performance has always been important for any website, especially in the online world where it is mission-critical. With this setup, we got one step closer to improving our web page performance by continuous monitoring of the metrics and making ongoing improvements to keep it highly responsive all the time.
Happy monitoring!!!
Join us
We are always looking out to hire for all roles in our tech team. If challenging problems that drive big impact enthral you, do reach out to us at careers.india@halodoc.com
About Halodoc
Halodoc is the number one all around Healthcare application in Indonesia. Our mission is to simplify and bring quality healthcare across Indonesia, from Sabang to Merauke.
We connect 20,000+ doctors with patients in need through our Tele-consultation service. We partner with 2500+ pharmacies in 100+ cities to bring medicine to your doorstep. We've also partnered with Indonesia's largest lab provider to provide lab home services, and to top it off we have recently launched a premium appointment service that partners with 500+ hospitals that allows patients to book a doctor appointment inside our application.
We are extremely fortunate to be trusted by our investors, such as the Bill & Melinda Gates foundation, Singtel, UOB Ventures, Allianz, Gojek and many more. We recently closed our Series B round and In total have raised USD$100million for our mission.
Our team work tirelessly to make sure that we create the best healthcare solution personalised for all of our patient's needs, and are continuously on a path to simplify healthcare for Indonesia.