
Performance Testing and Right Sizing
Halodoc serves millions of users every month and sees a predictable traffic pattern on tech infra. When there are promotional events (for example, a TV advert), we see significant short-lived spikes in traffic.
Earlier we would manually provision our infra to meet these spikes. As these promotional events become more common, we felt a need to automate the infra provisioning. Infra must be automatically scaled up when traffic is high and should be scaled down when demand is low.
As a first step in automating, we decided to do performance testing of all the Halodoc microservices.
Getting Started
The critical question to answer before starting the performance testing is: How much traffic multiple do we expect? The multiple is based on historical traffic volumes. At Halodoc, we decided to simulate 3X to 5X of normal traffic.
It's essential to understand the difference between performance testing and load testing.
- Performance testing is to determine the responsiveness, stability and reliability of systems under normal traffic. There is no stress on the system.
- Load testing is to find the maximum operating capacity of the system under different target loads. The systems are stressed by design.
The key to performance testing is to ensure that when traffic spikes quickly to 3X to 5X, auto-scaling kicks in and there is no performance degradation.
Test Environment
When setting up an environment for testing, we decided that:
- It would have a smaller scale than the production environment - for cost reasons
- It would include databases and "Elastic search" configurations - to realistically mimic the production environment
- It would not have auto-scaling enabled - to determine what traffic volumes test environment supports and then slowly increase server resources till the desired throughput.
Tools
Once we were ready with the test environment, the next step was to simulate the load. We evaluated jmeter, locust, K6, Vegata, Gatling, Artillery. The vectors considered were OS, Test Code Support, Protocol Support, Resource Consumption, Test Result Analysis, Real Time Analysis to name a few.
JMeter was the best-suited tool for our requirements.
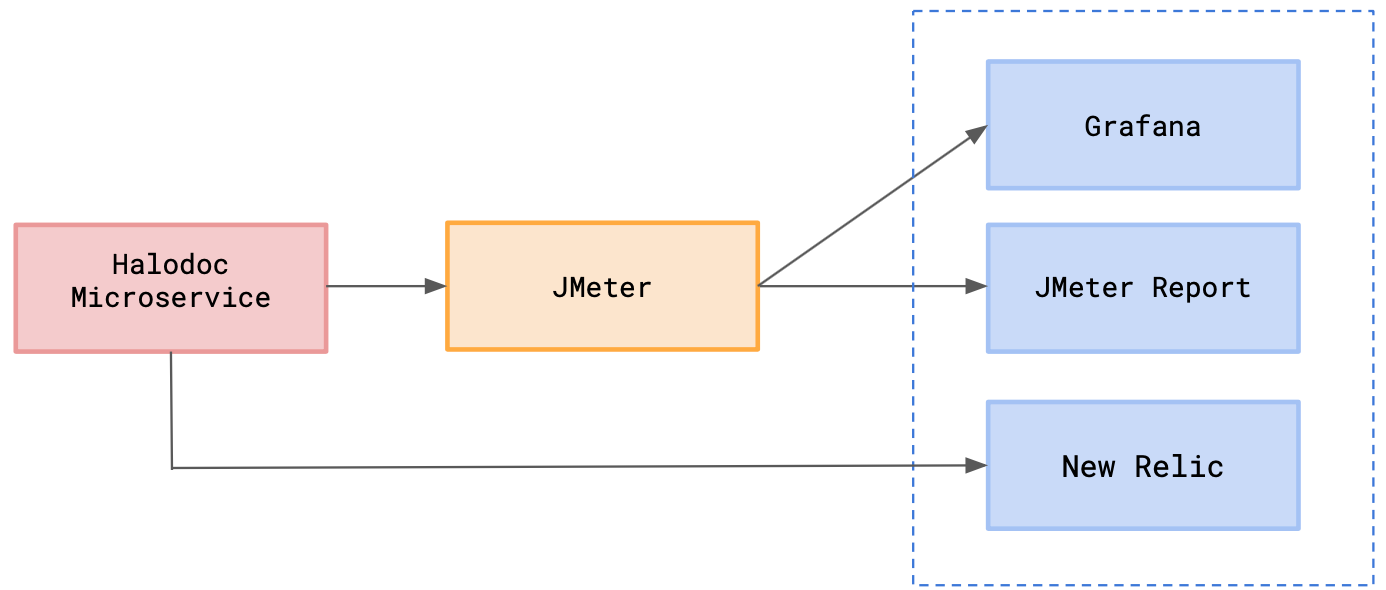
Monitoring
We used Grafana for real-time monitoring through customizable dashboards. We also set up NewRelic for performance infrastructure. This way, we were able to capture application level and server level metrics. To capture API level metrics, we relied on JMeter report, which was adequate.
Execution
Step 1: We shortlisted the APIs which were heavily used or have higher response time based on NewRelic metrics. We considered various time durations like 7 days, 1 month and 3 months to narrow these down.
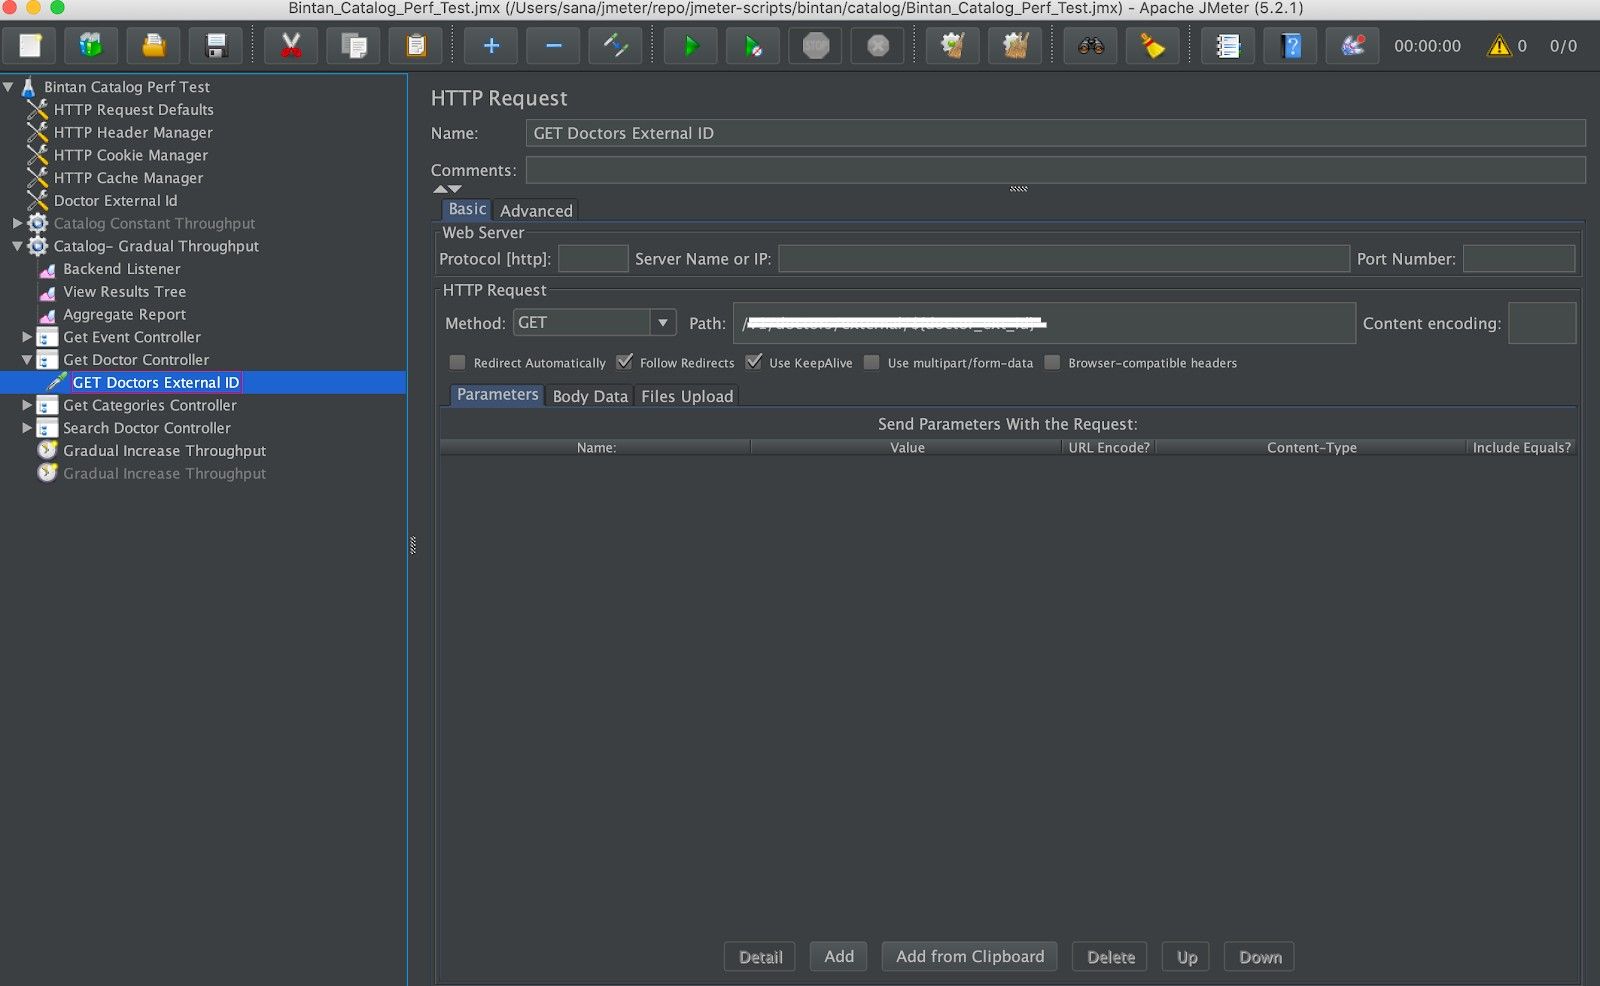
Step 2: We wrote jmeter scripts for these APIs. The APIs were placed in a thread group, and throughput timer was applied. For some microservices, we used a "Constant Throughput Timer". For others, we used "Gradual Throughput Shaping Timer". The number of threads, duration, ramp-up times were parameterised to be changed through command line.
Step 3: Influx was used as a backend listener for jmeter. A new database was created for each microservice, and results were stored there. In Grafana, a data source was created for the newly created database and connected that to the dashboard. With this, our report was visible at runtime.
Each microservice had its own jmeter script. They ran independently and individually.
Test Results
With each run, we captured following metrics:
- CPU Consumption
- Memory Cosumption
- Garbage Collection
- JVM Used
- API Throughput
- API Response Time
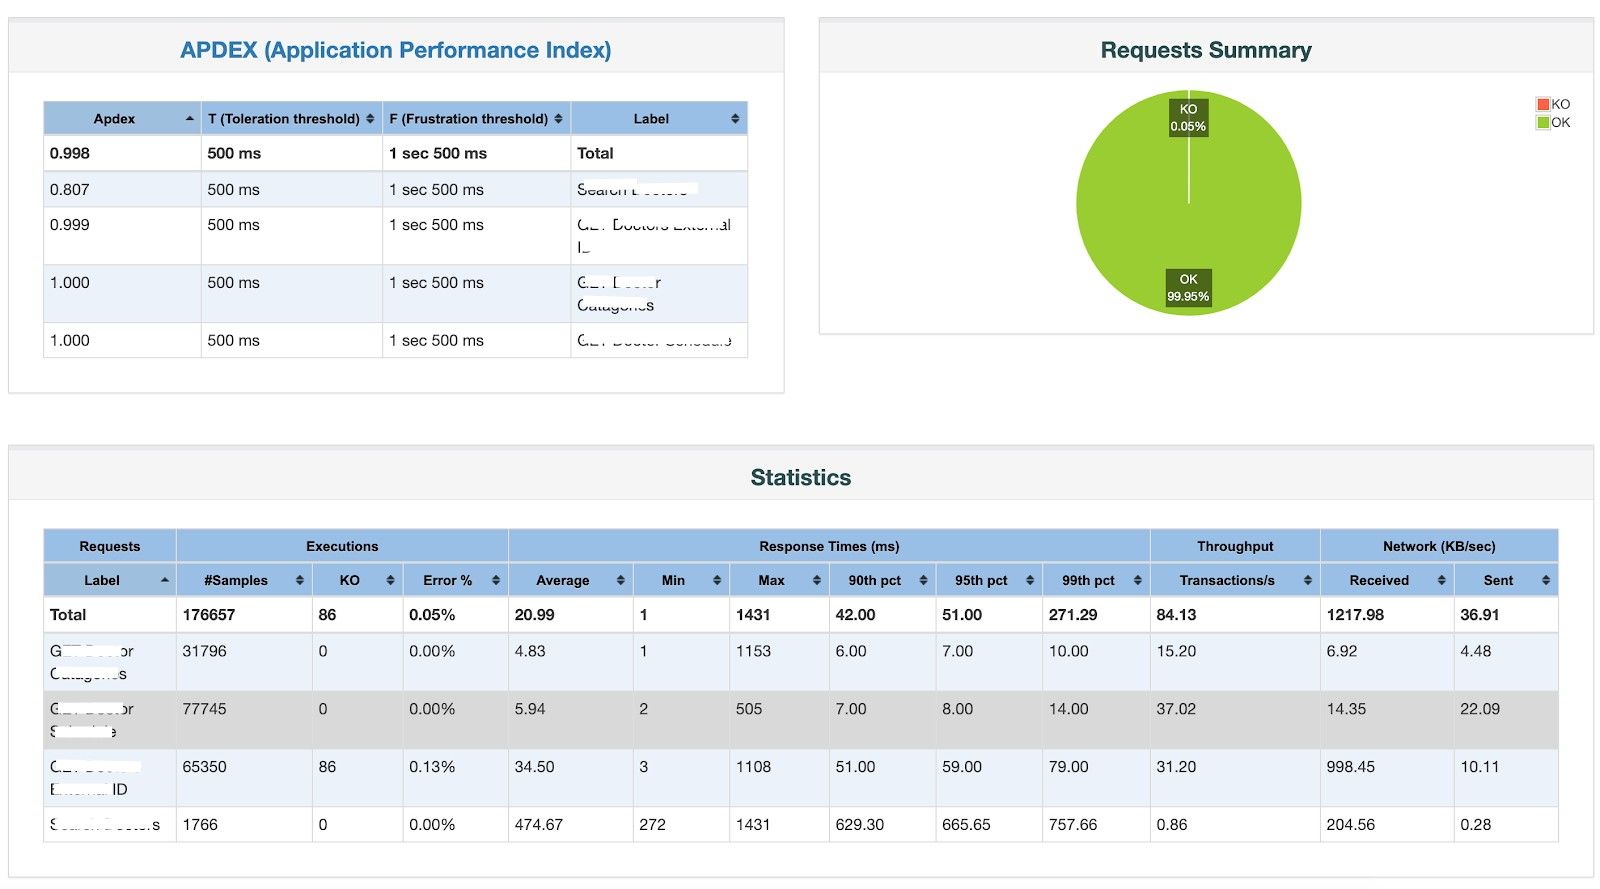
- JMeter Report
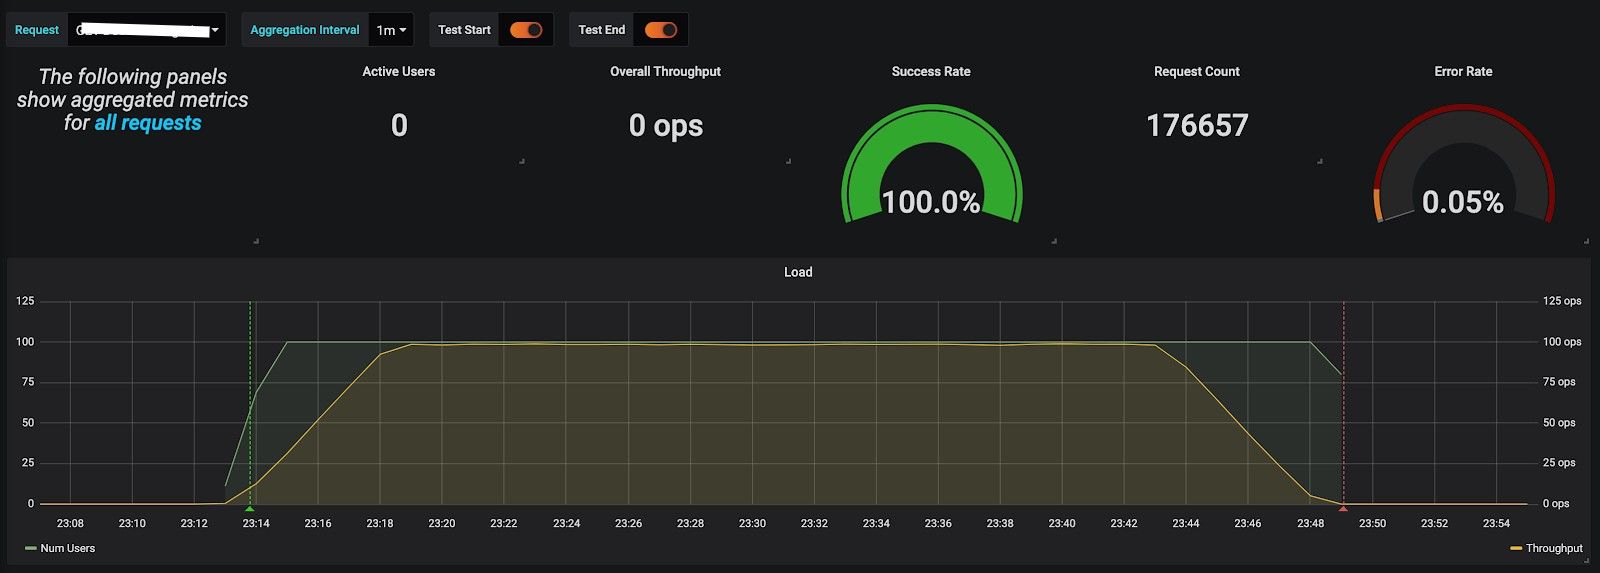
- Grafana Report
- RDS Parameters
Right Sizing
Every run exposed some bottlenecks. When CPU or memory was causing response time to rise up, we increased the instance size. Based on these readings we deduced if the service requires more CPU intensive or memory intensive instances. When instance size was determined and still performance was going down, we checked the heap memory and kept it at a higher value. Sometimes, GC caused some issues. In such cases we collected dumps and reached to the root cause. When there was a problem with RDS, its size also was adjusted accordingly.
These runs enabled us to resolve all the performance related issues and get the throughput to the desired level and response time within acceptable margins.
Auto-Scaling
For the last couple of runs, auto-scaling was also enabled. Performance testing was done for upto 5X of the desired throughput to make sure auto-scaling kicks in. A custom auto scaling policy was then decided based on CPU, memory usage, no. of requests for every service.
Closing Notes
Once the configuration was finalised for a particular service, it was deployed on production. The services started running smoothly with optimised resource allocation, reducing our monthly cost by a significant factor. When any promotional event happened, there used to be a traffic spike. The auto-scaling policy could handle these seamlessly.
Scalability, reliability and maintainability are the three pillars that govern what we build at Halodoc Tech. We are actively looking for data engineers/architects and if solving hard problems with challenging requirements is your forte, please reach out to us with your resumé at careers.india@halodoc.com.
About Halodoc
Halodoc is the number 1 all around Healthcare application in Indonesia. Our mission is to simplify and bring quality healthcare across Indonesia, from Sabang to Merauke.
We connect 20,000+ doctors with patients in need through our Tele-consultation service. We partner with 2500+ pharmacies in 100+ cities to bring medicine to your doorstep. We've also partnered with Indonesia's largest lab provider to provide lab home services, and to top it off we have recently launched a premium appointment service that partners with 500+ hospitals that allows patients to book a doctor appointment inside our application.
We are extremely fortunate to be trusted by our investors, such as the Bill & Melinda Gates foundation, Singtel, UOB Ventures, Allianz, Gojek and many more. We recently closed our Series B round and In total have raised USD$100million for our mission.
Our team work tirelessly to make sure that we create the best healthcare solution personalised for all of our patient's needs, and are continuously on a path to simplify healthcare for Indonesia.