Non-functional metrics monitoring in Android
Background
Traditionally people concentrate on functional aspects of the app first rather than non functional aspects. Functional aspects means whether all the features in app is working as expected according to the inputs provided. Ex: Navigating through the flows, Uploading images etc..
Non functional aspects defines system attributes such as security, reliability, performance, maintainability, scalability, and usability. They often called as quality attributes of the system. They contributes major part to the user experience and in turn helps in retention and active users.
At Halodoc, we always want to give the best user experience to our customers and constantly monitoring and measuring the performance of our apps/systems help us in achieving this objective. In order to achieve this objective for our Android apps, we came up with Android NF monitor - a system to capture the performance metrics and give insights through the meaningful reports.
Non-functional metrics
We decided to capture the below metrics as the part of first implementation phase
- APK size
- App launch time
- Memory info
- Network info
System Overview
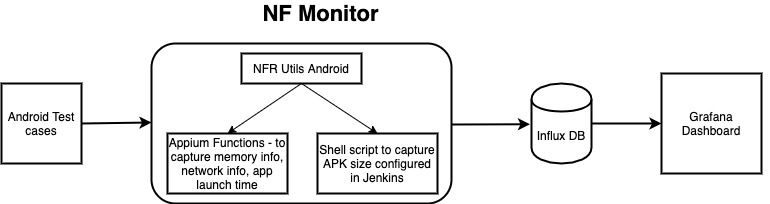
- Android test cases: Test cases to be run to capture NFR metrics
- NFR Utils Android: Util functions to capture NFR metrics which includes Appium functions, shell script to capture apk size configured in Jenkins
- Influx DB: To store the NFR metrics
- Grafana Dashboard: To show the NFR reports
Implementation
- Identify the business critical flows: We started by choosing the most critical business flows in our app, to capture the NFR metrics.
- Identify tools to capture non-functional metrics: We used shell script to capture the apk size. Appium utility functions to capture memory info, network info and app launch time
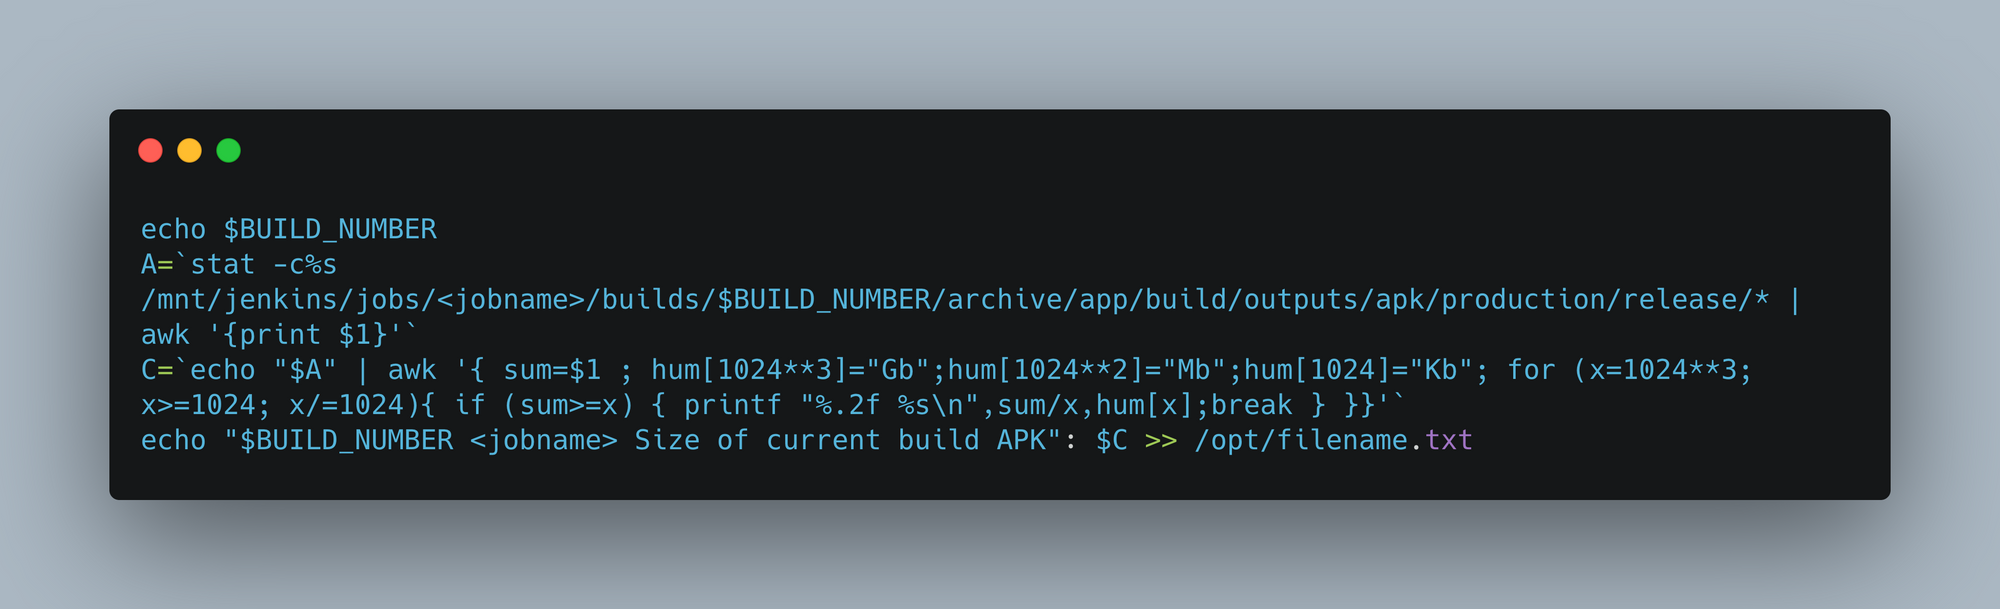
APK size: We are executing the below shell script as part of our development job in Jenkins to get the APK size and write into a text file
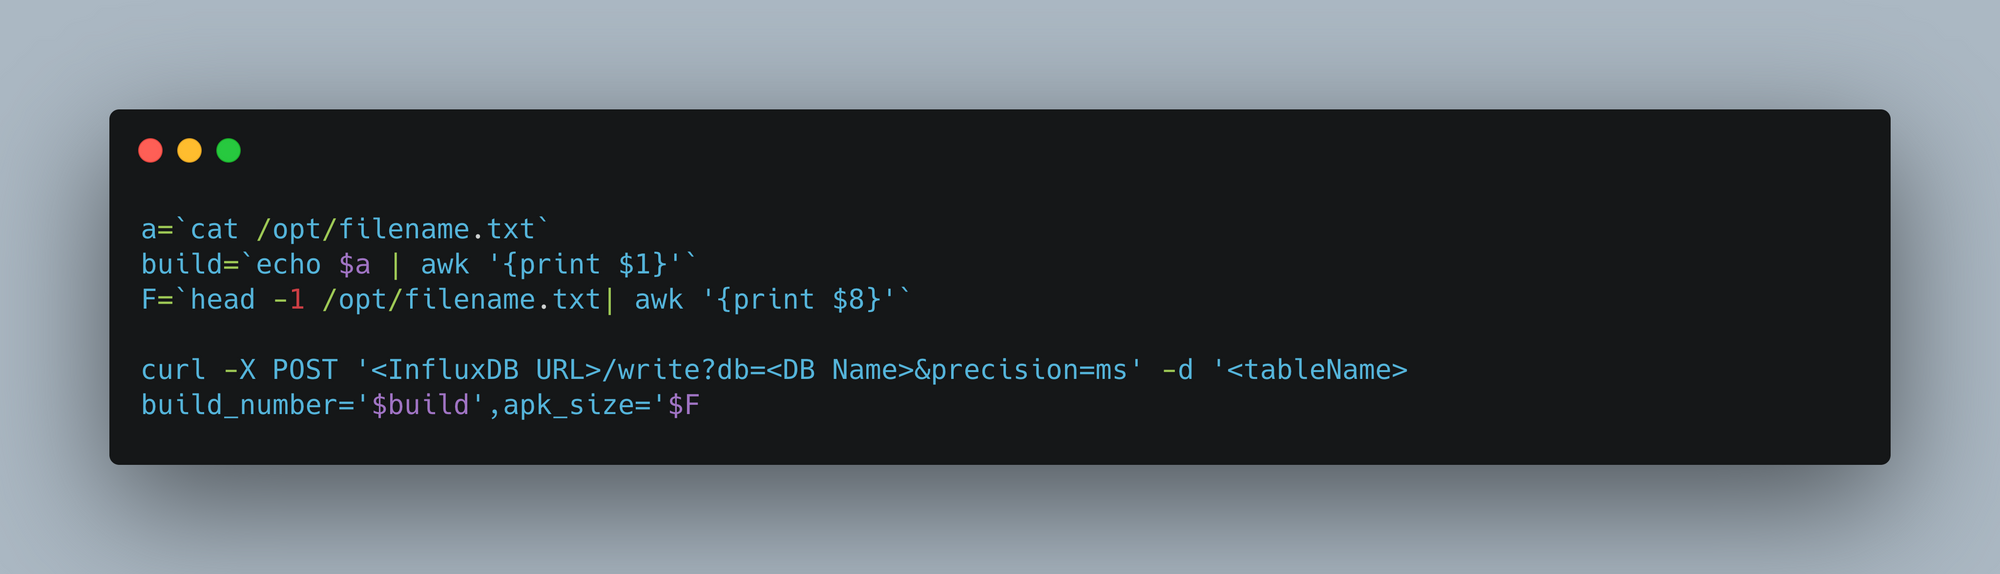
We are using the below command to write build number and APK size to Influx DB
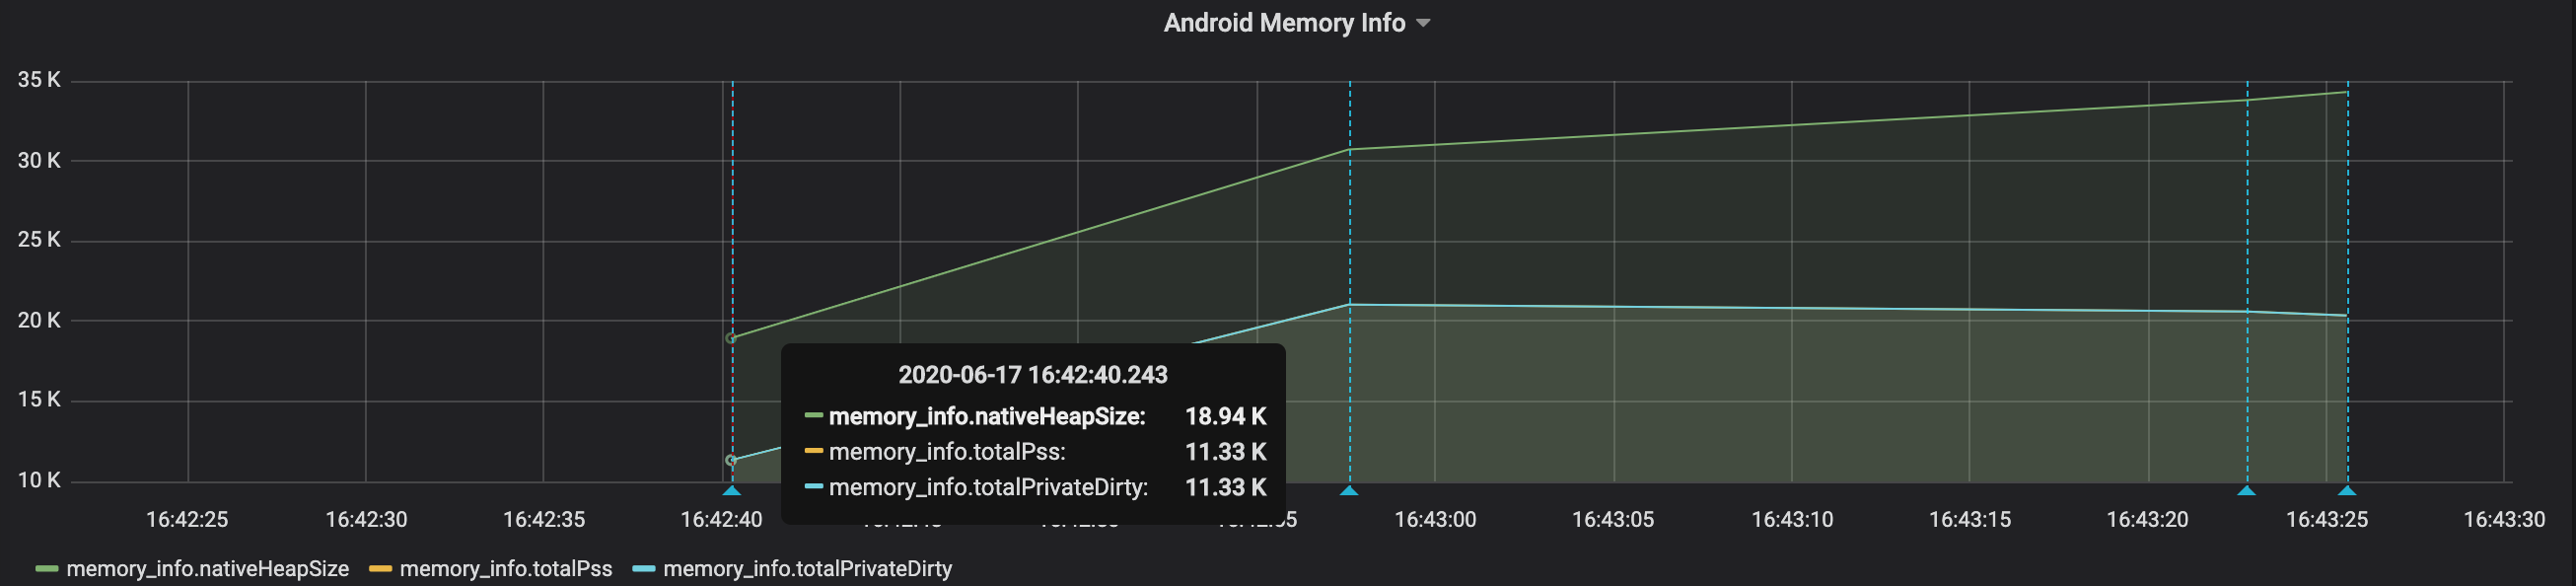
Memory info and Network info: We are capturing memory info and network info by executing the Appium util getPerformanceData in each and every screen of the flow.
Below is the sample Meminfo data
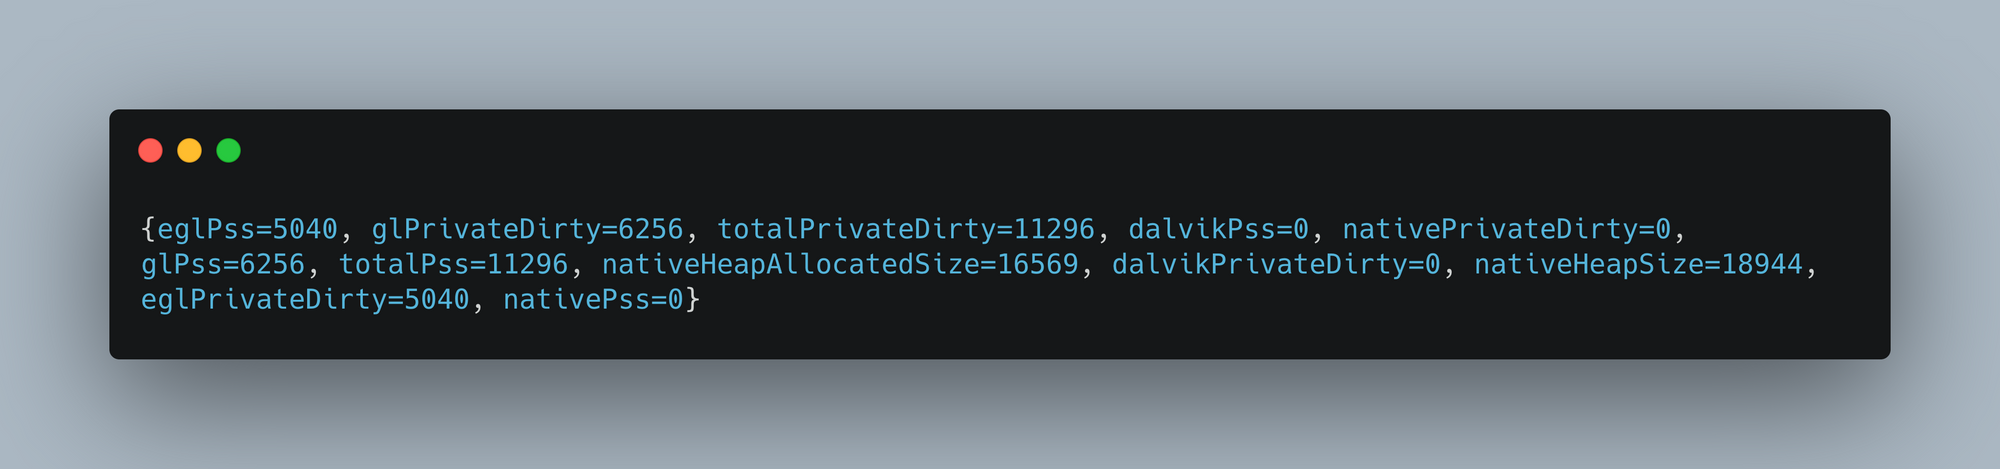
Heap sizeHeap space is used by java runtime to allocate memory to Objects and JRE classes. Whenever we create an object, it’s always created in the Heap space.Private dirtyThis is memory that is being used by only your process. This is the bulk of the RAM that the system can reclaim when your app’s process is destroyedPSSThe "proportional set size" (PSS) of a process is the count of pages it has in memory, where each page is divided by the number of processes sharing it. So if a process has 1000 pages all to itself, and 1000 shared with one other process, its PSS will be 1500
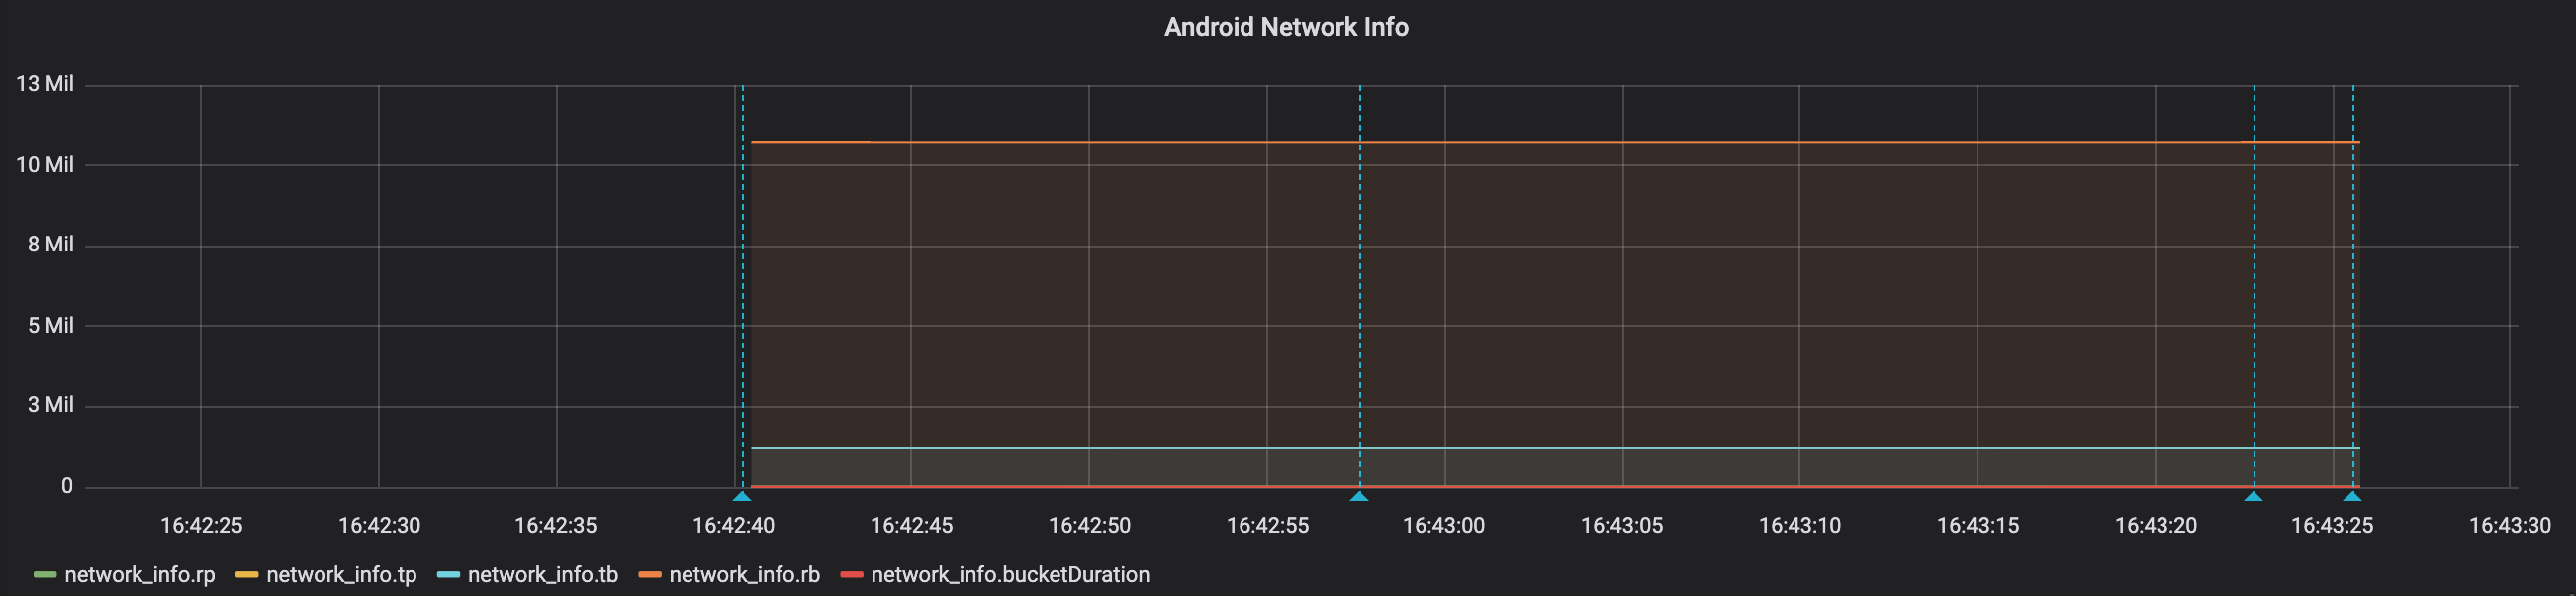
Below is the sample networkinfo data
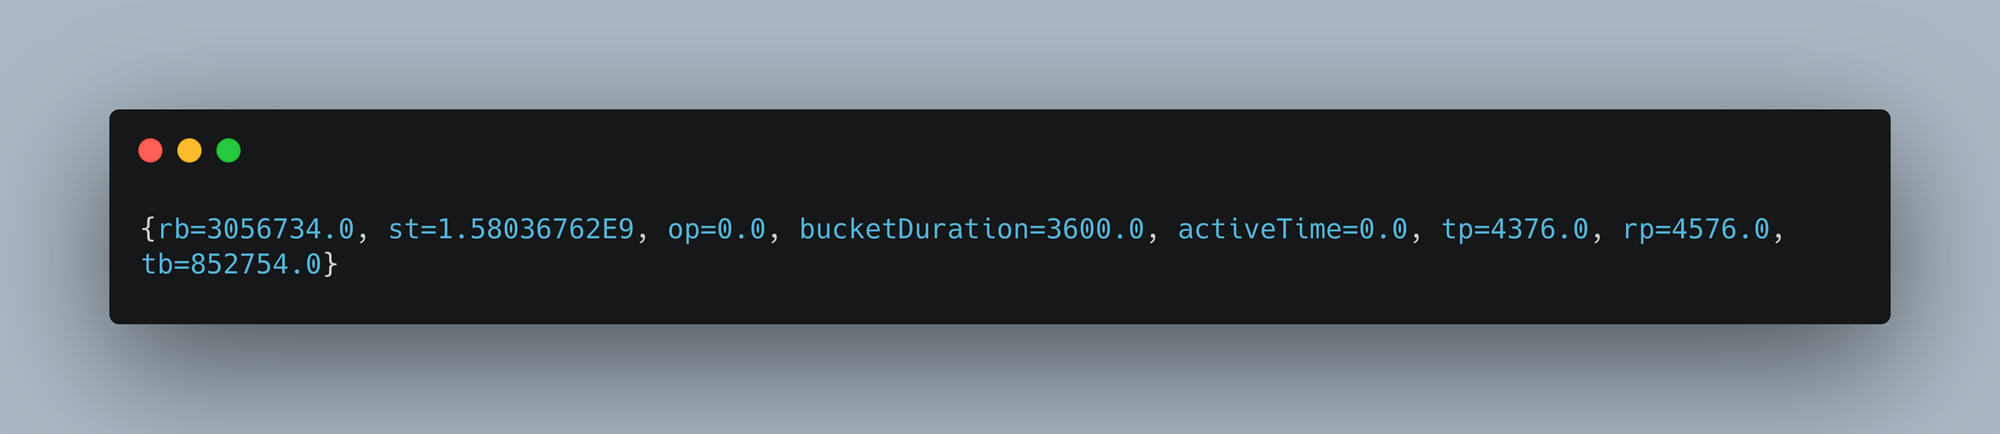
rbandrprepresent received bytes and received packets in the corresponding time interval.tbandtprepresent sent (transmitted) bytes and sent packets in the corresponding time interval.bucketDurationis the time interval in which we are capturing these network stats
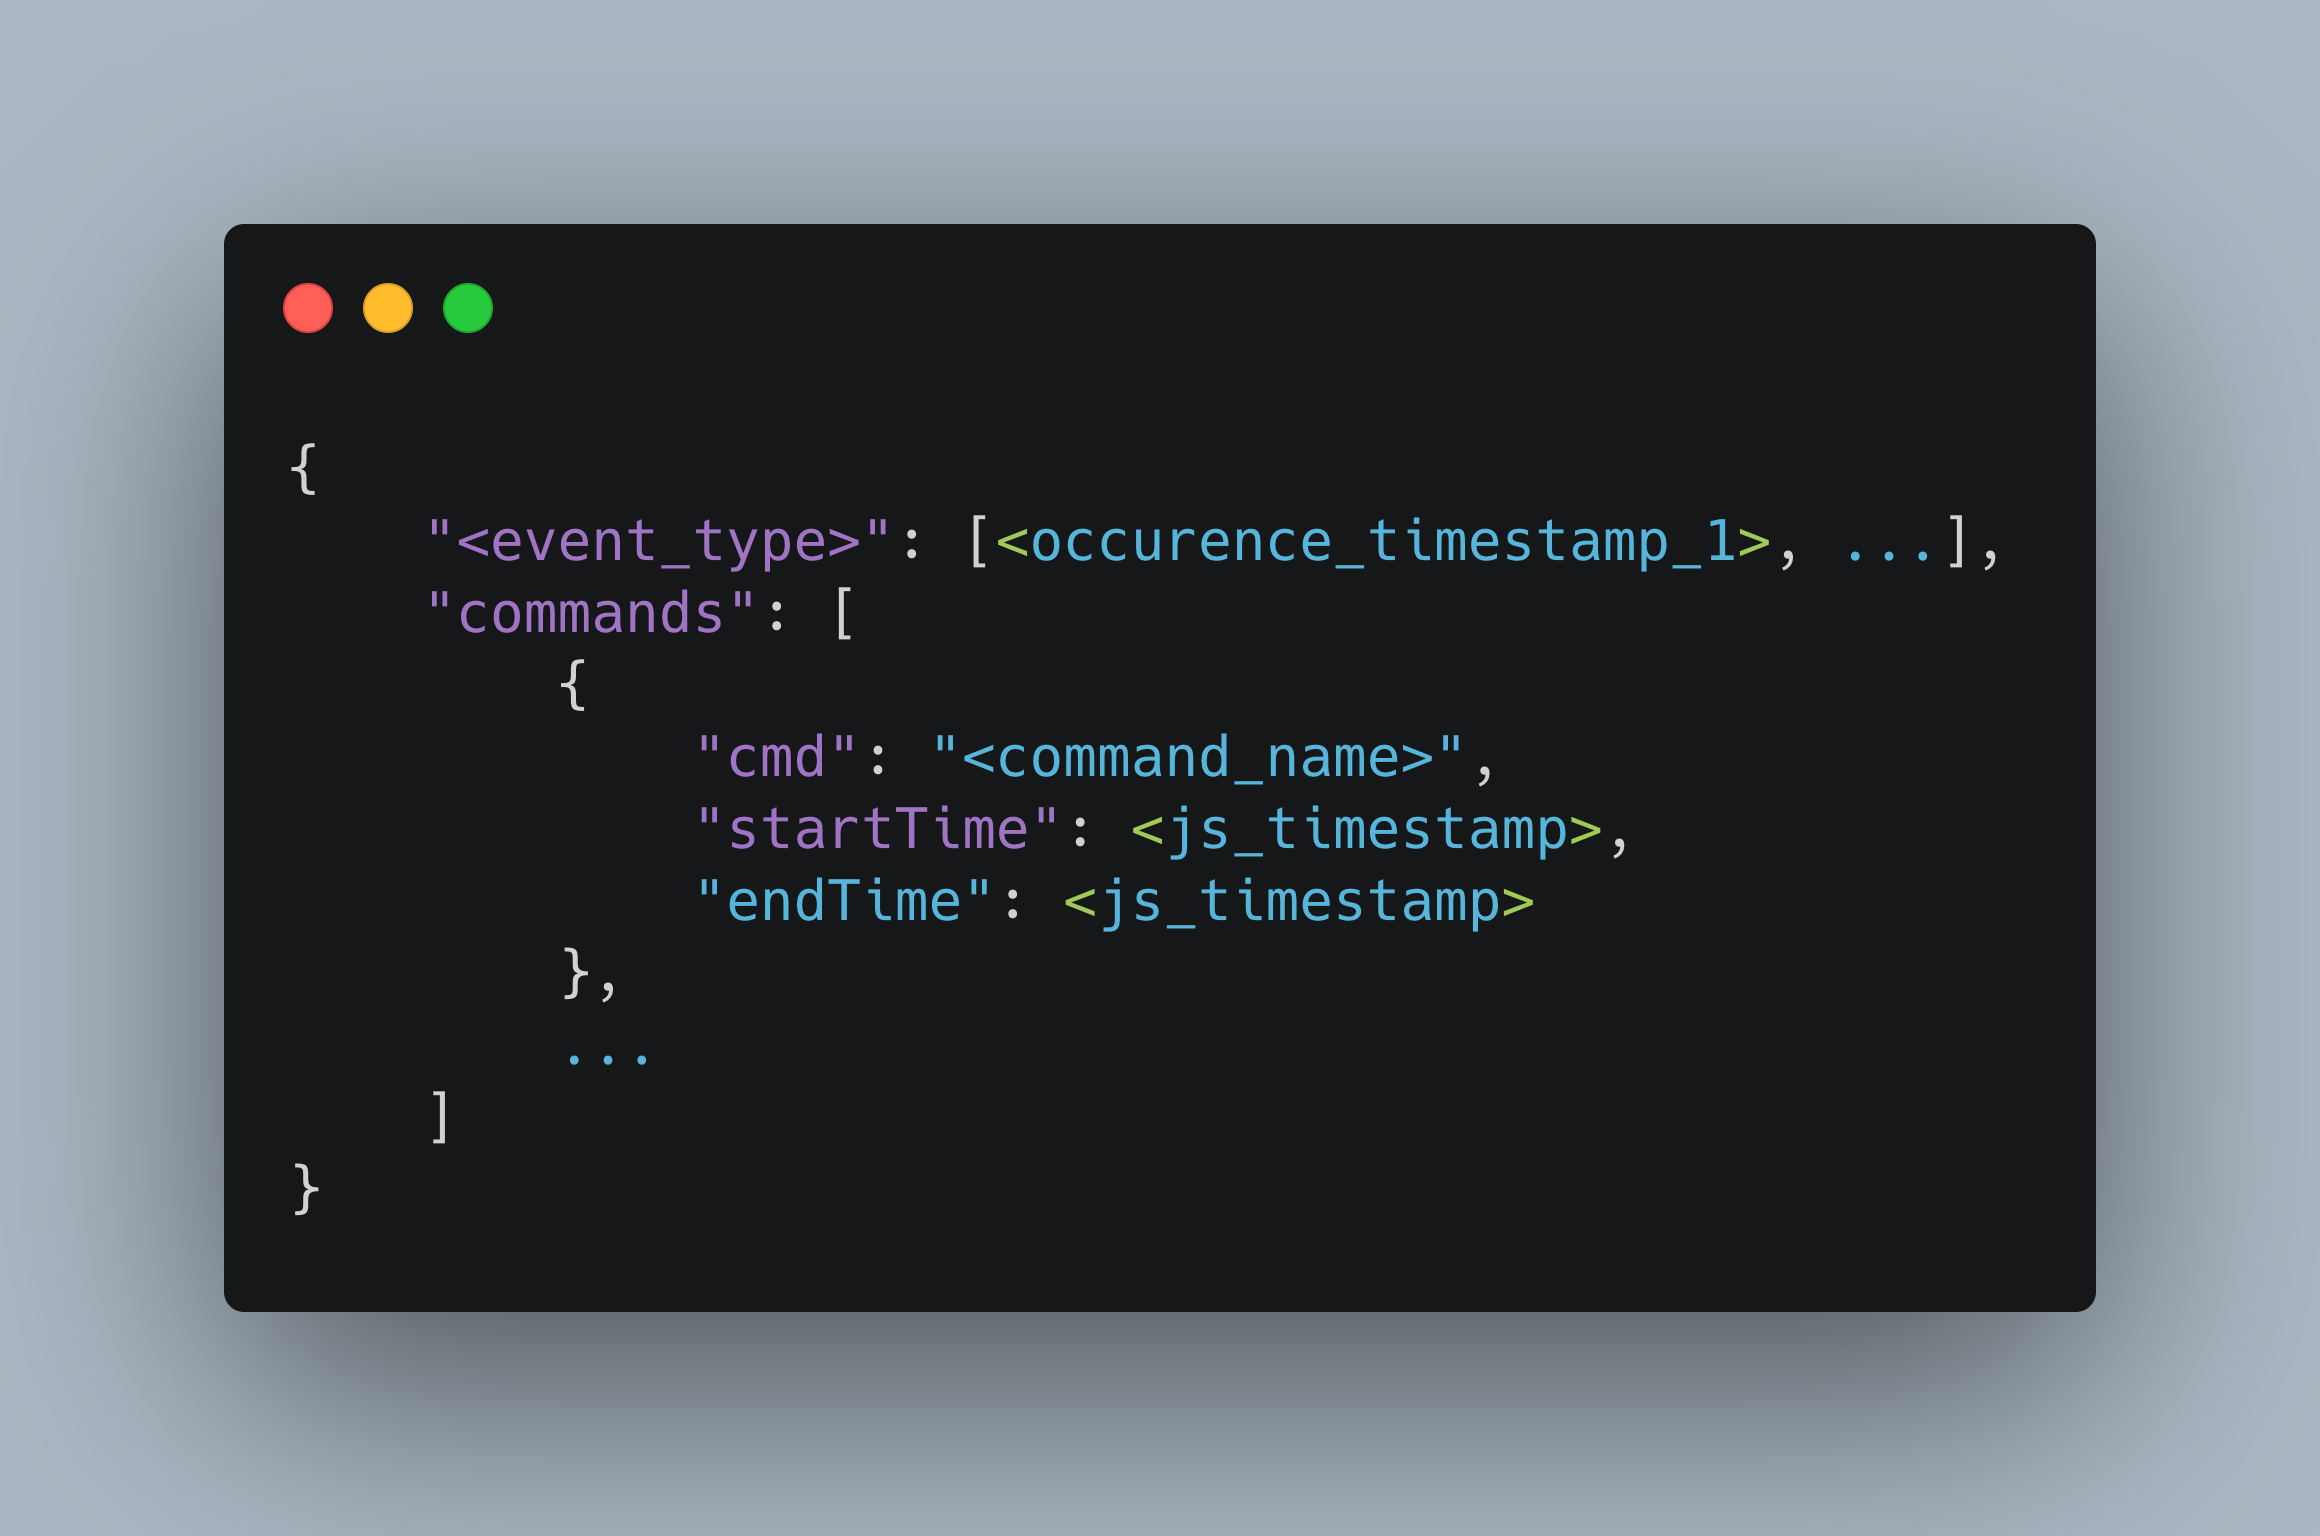
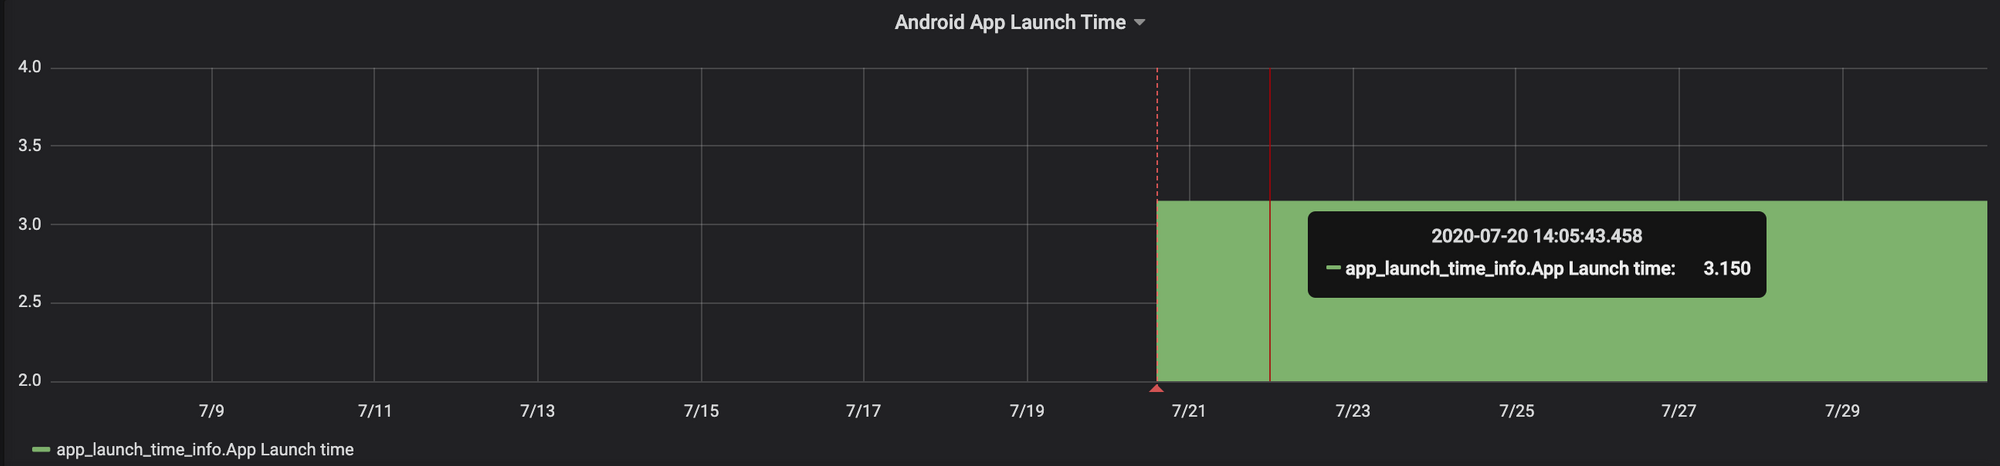
App launch time: We are capturing the app launch time by executing the Appium util getSessionDetails which gives below output. Here we are filtering for "cmd":"launchApp" event and writing the difference of endTime and startTime to Influx DB
3. DB evaluation: We evaluated MySql vs InfluxDB. We have chosen InfluxDB to store NFR metrics based on our evaluation. Create the database and respective measurements to store the NFR metrics.
4. Identify the devices to run test suite: Choosing the right set of devices to run the test suite is crucial to capture the meaningful NFR metrics. To start with, we have chosen the most used device from our user base to run the test suite. Gradually we will move this to AWS device farm where we can cover most of the devices used by our users.
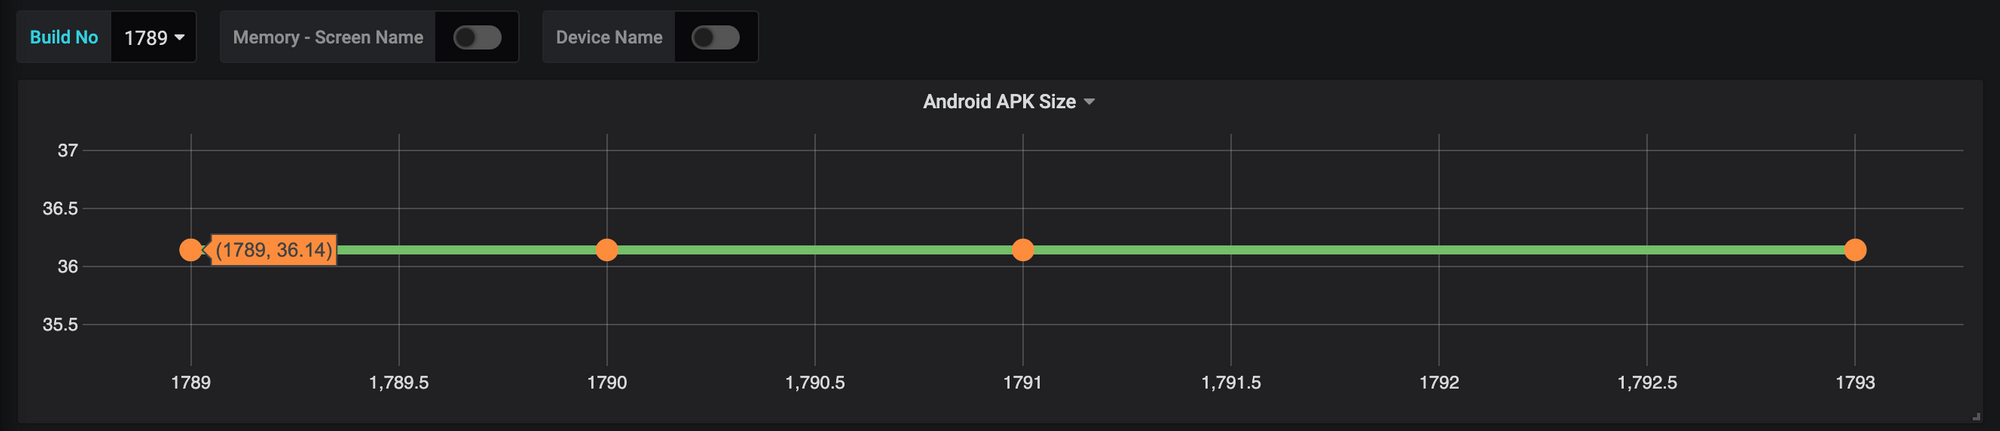
5. Grafana dashboard: We have setup the Grafana dashboard to show meaningful reports. These are self serve dashboards which developers can make use of.
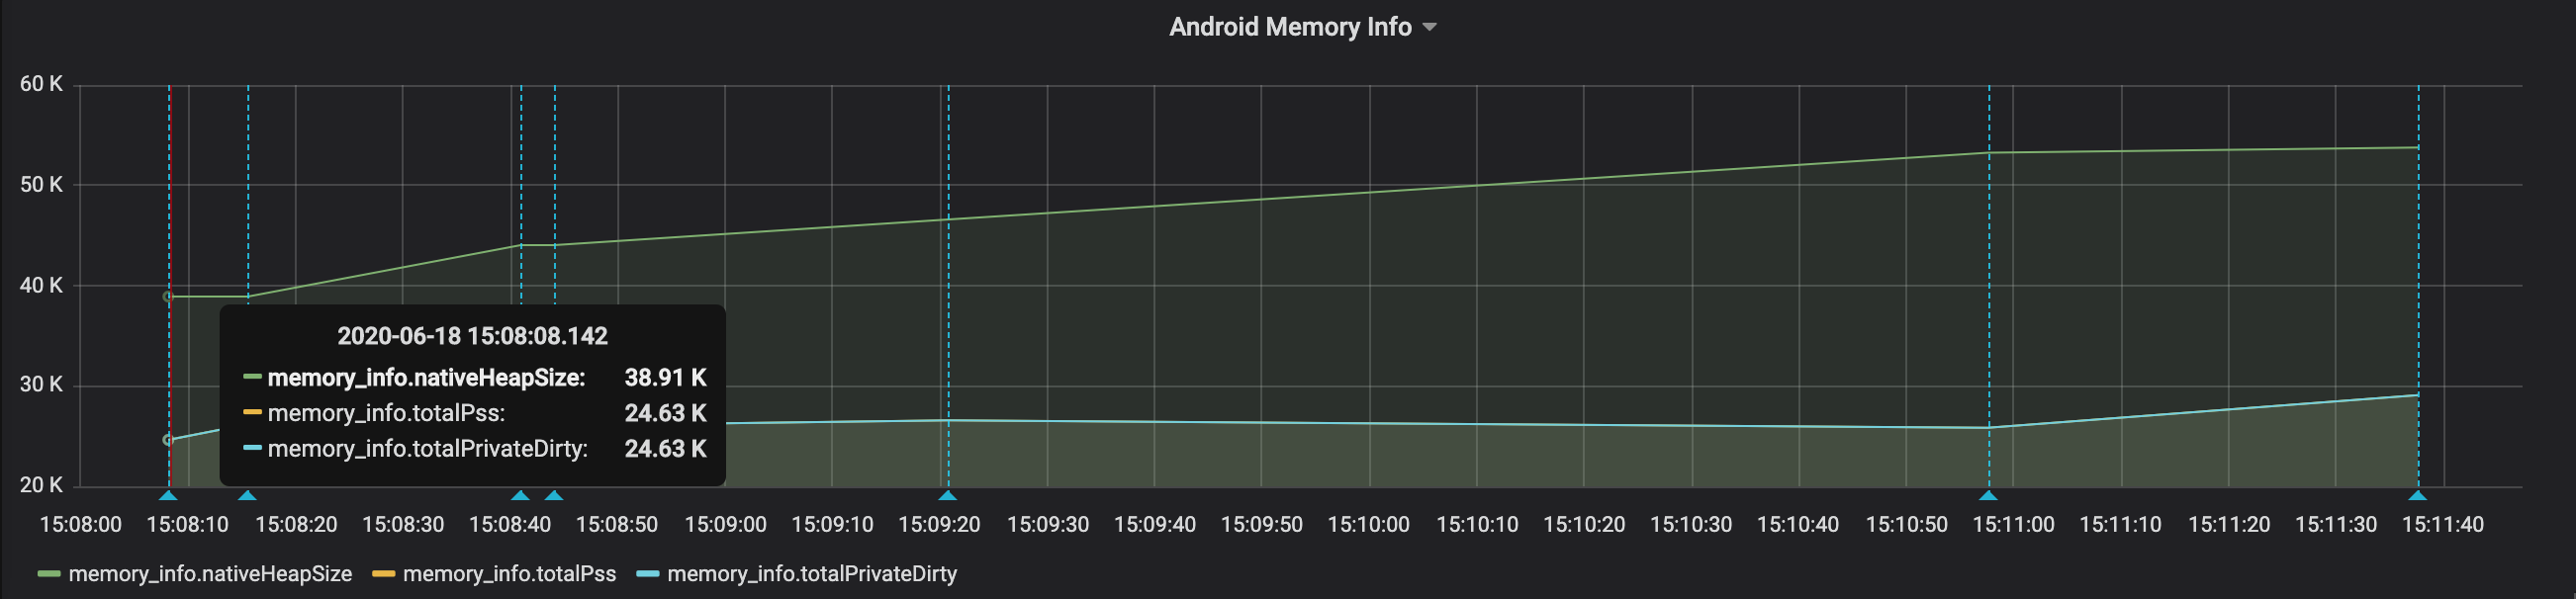
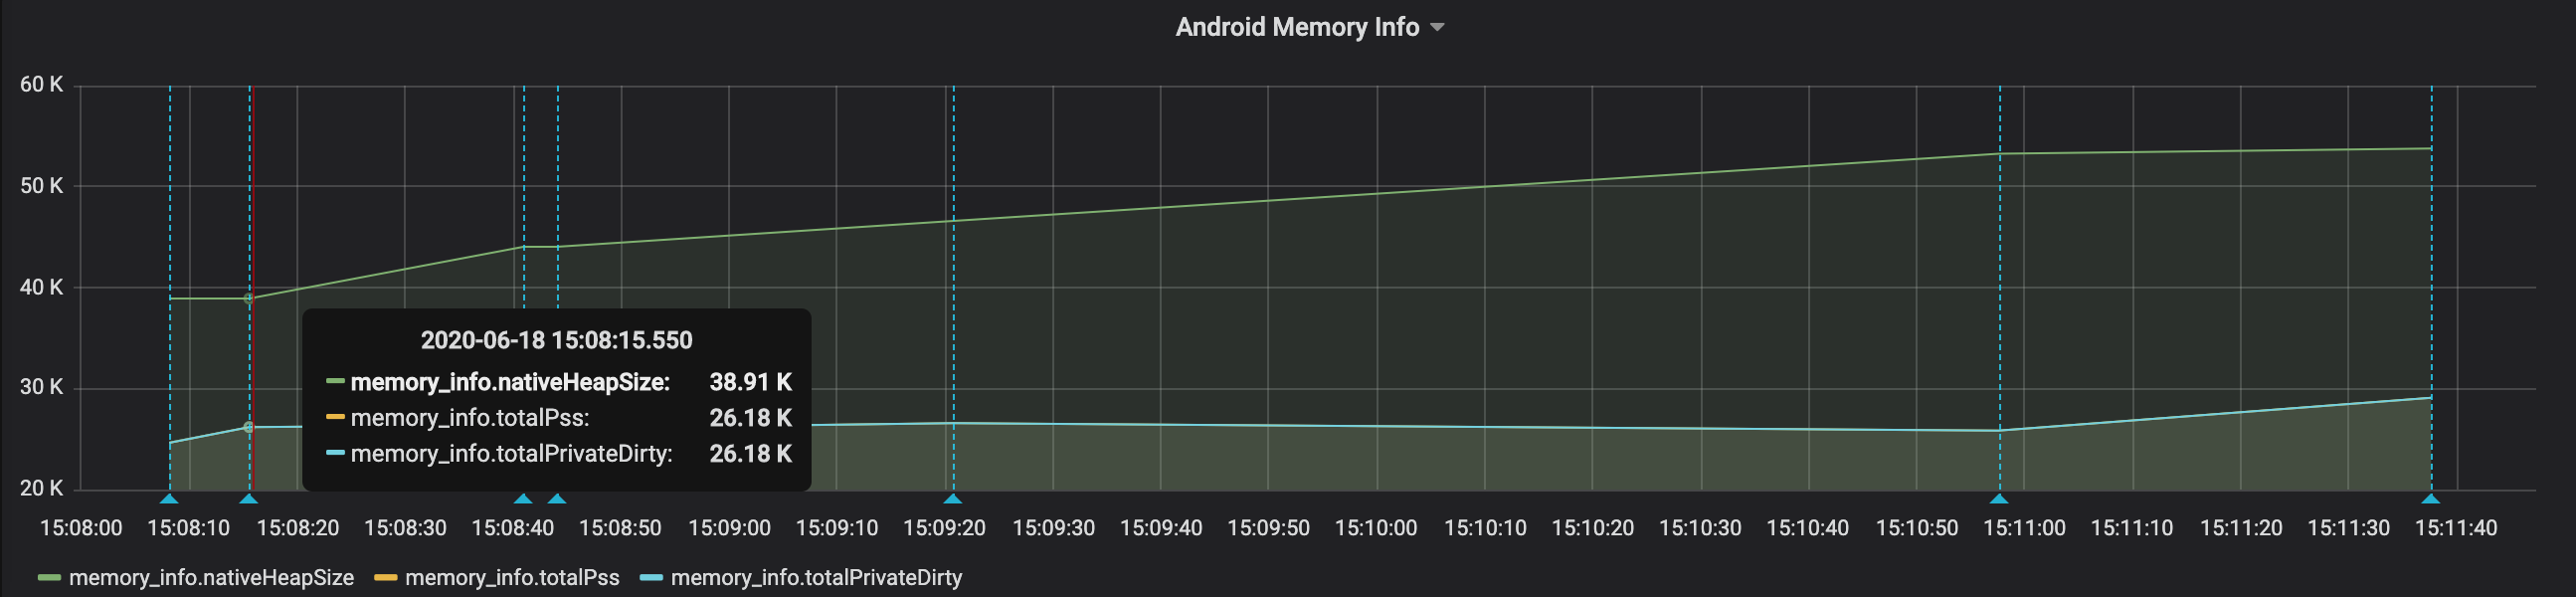
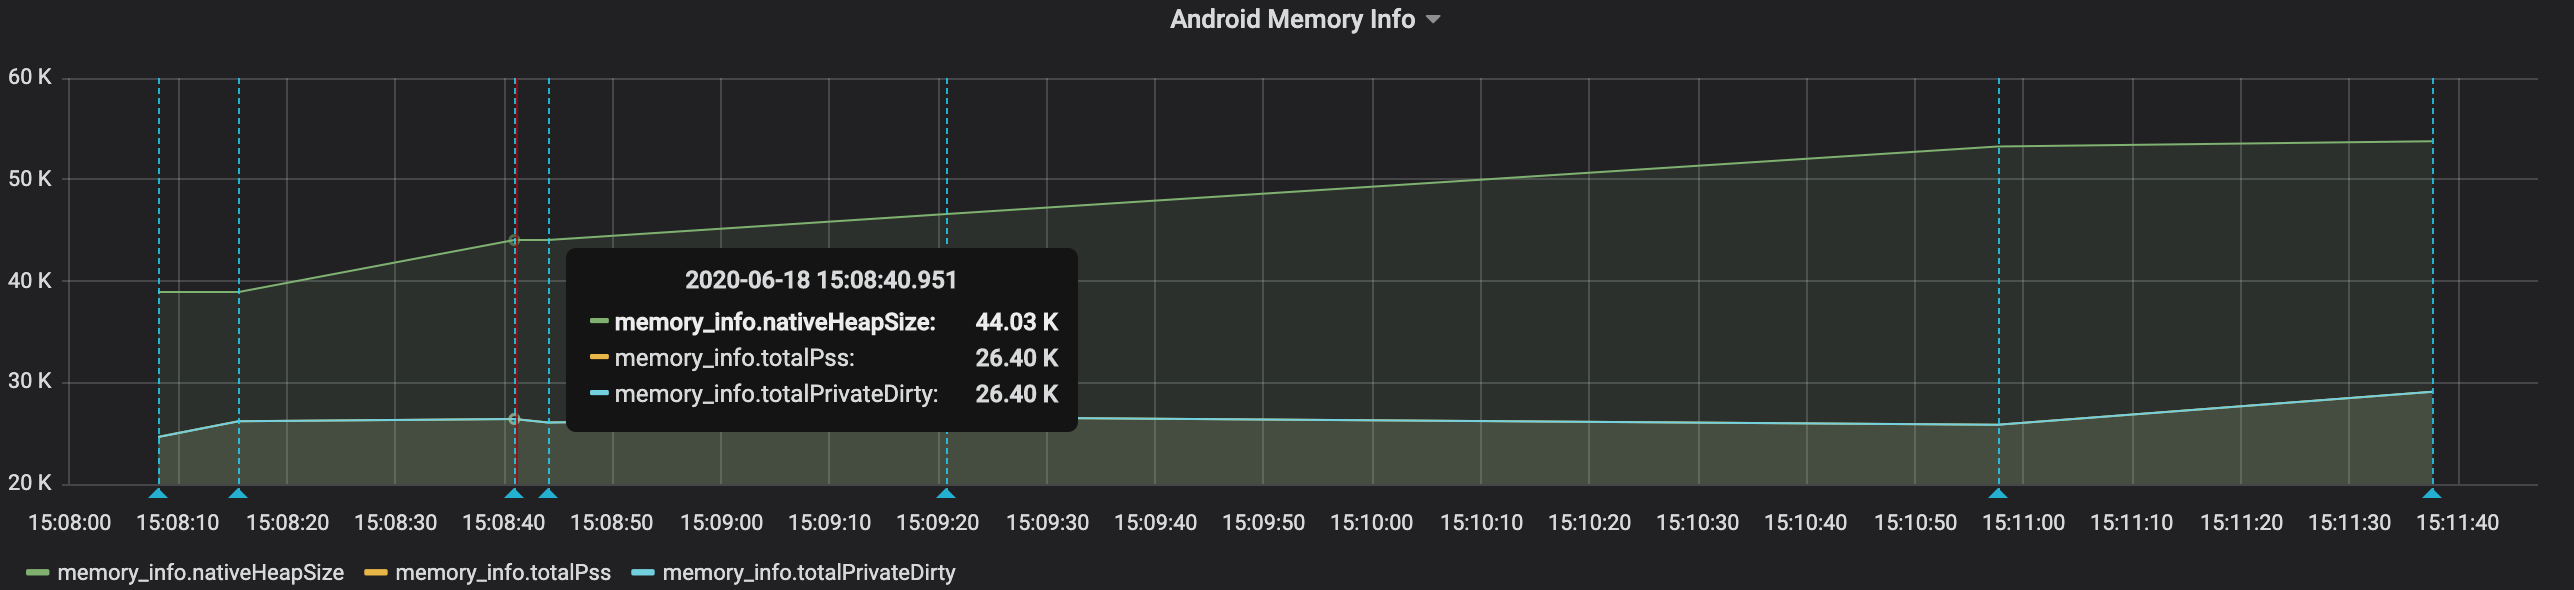
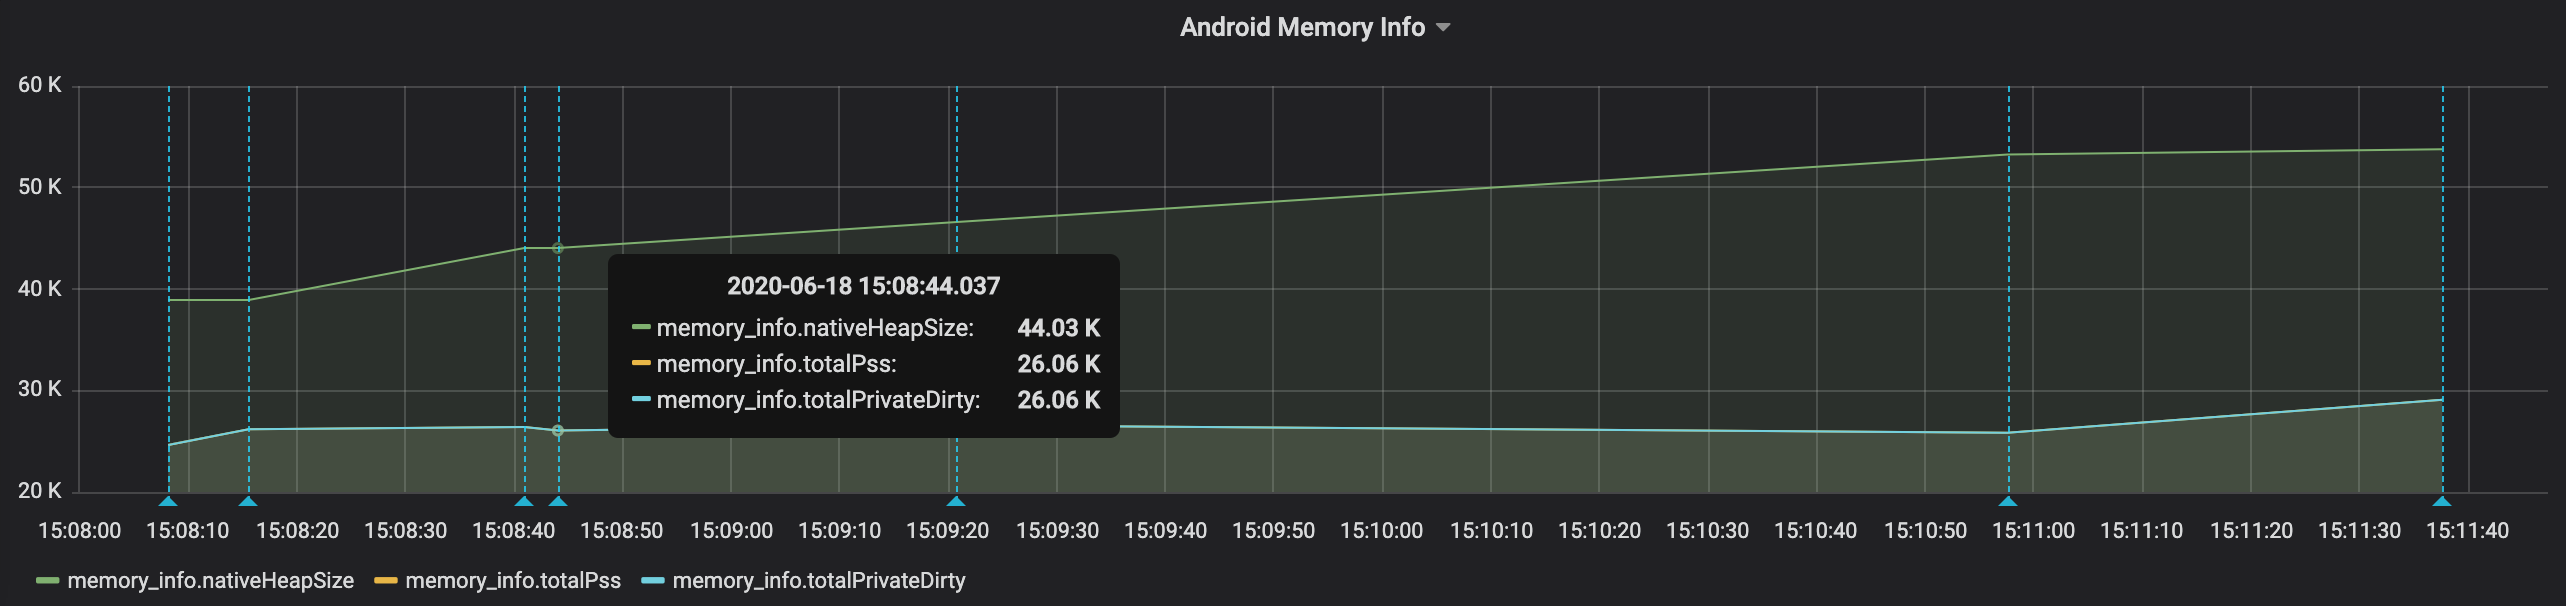
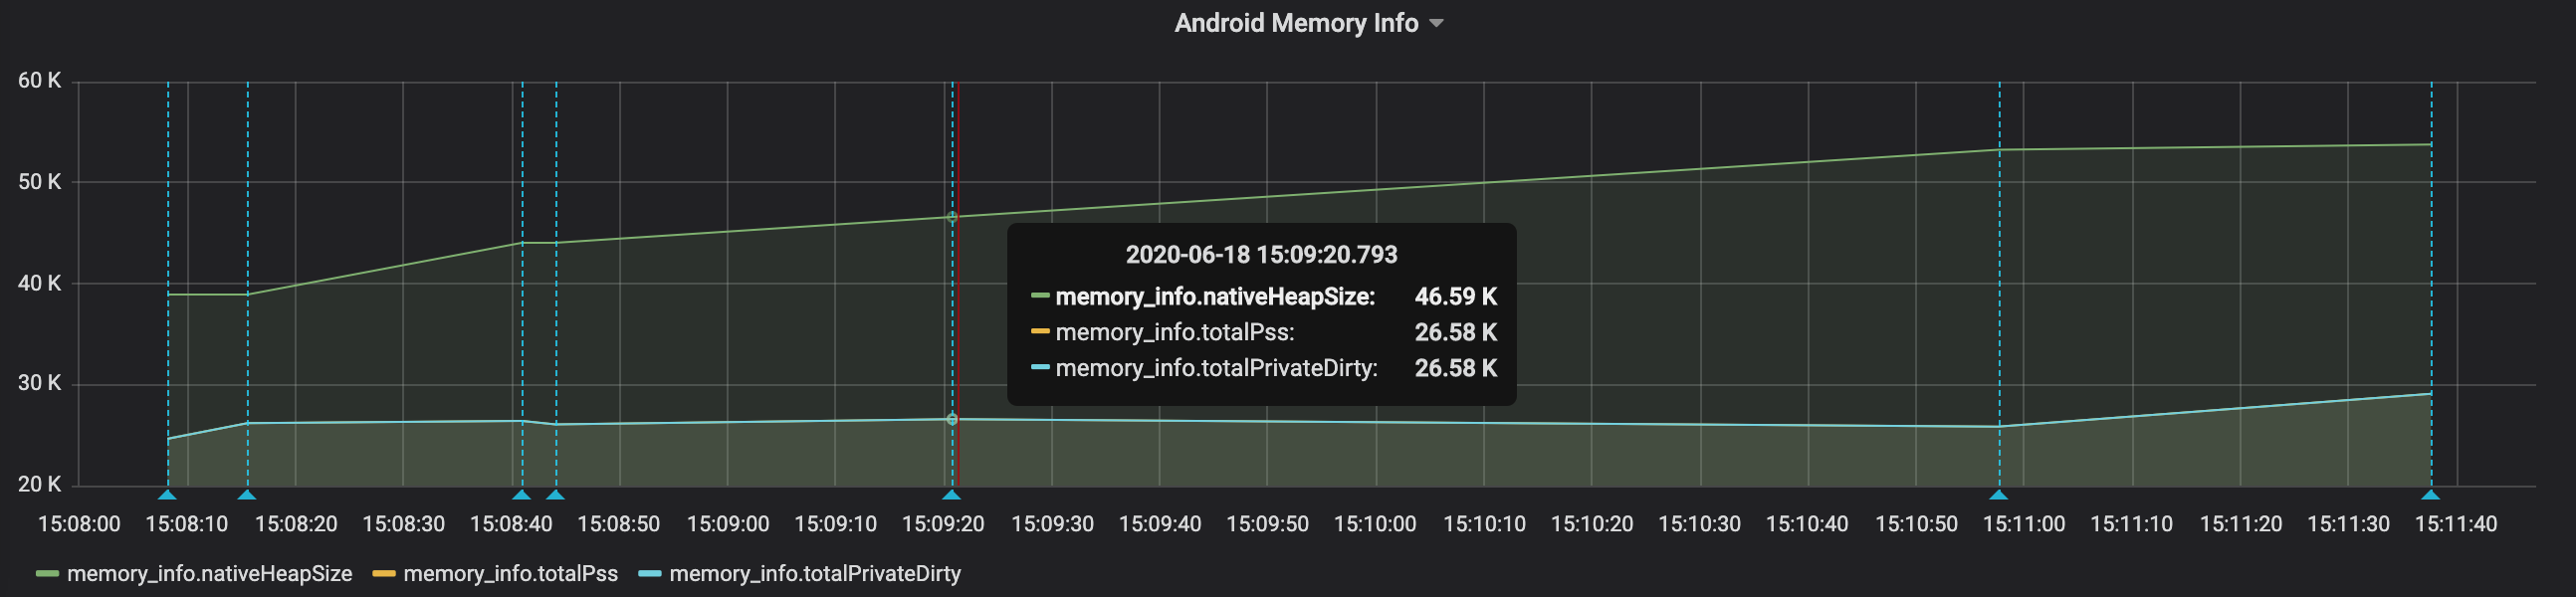
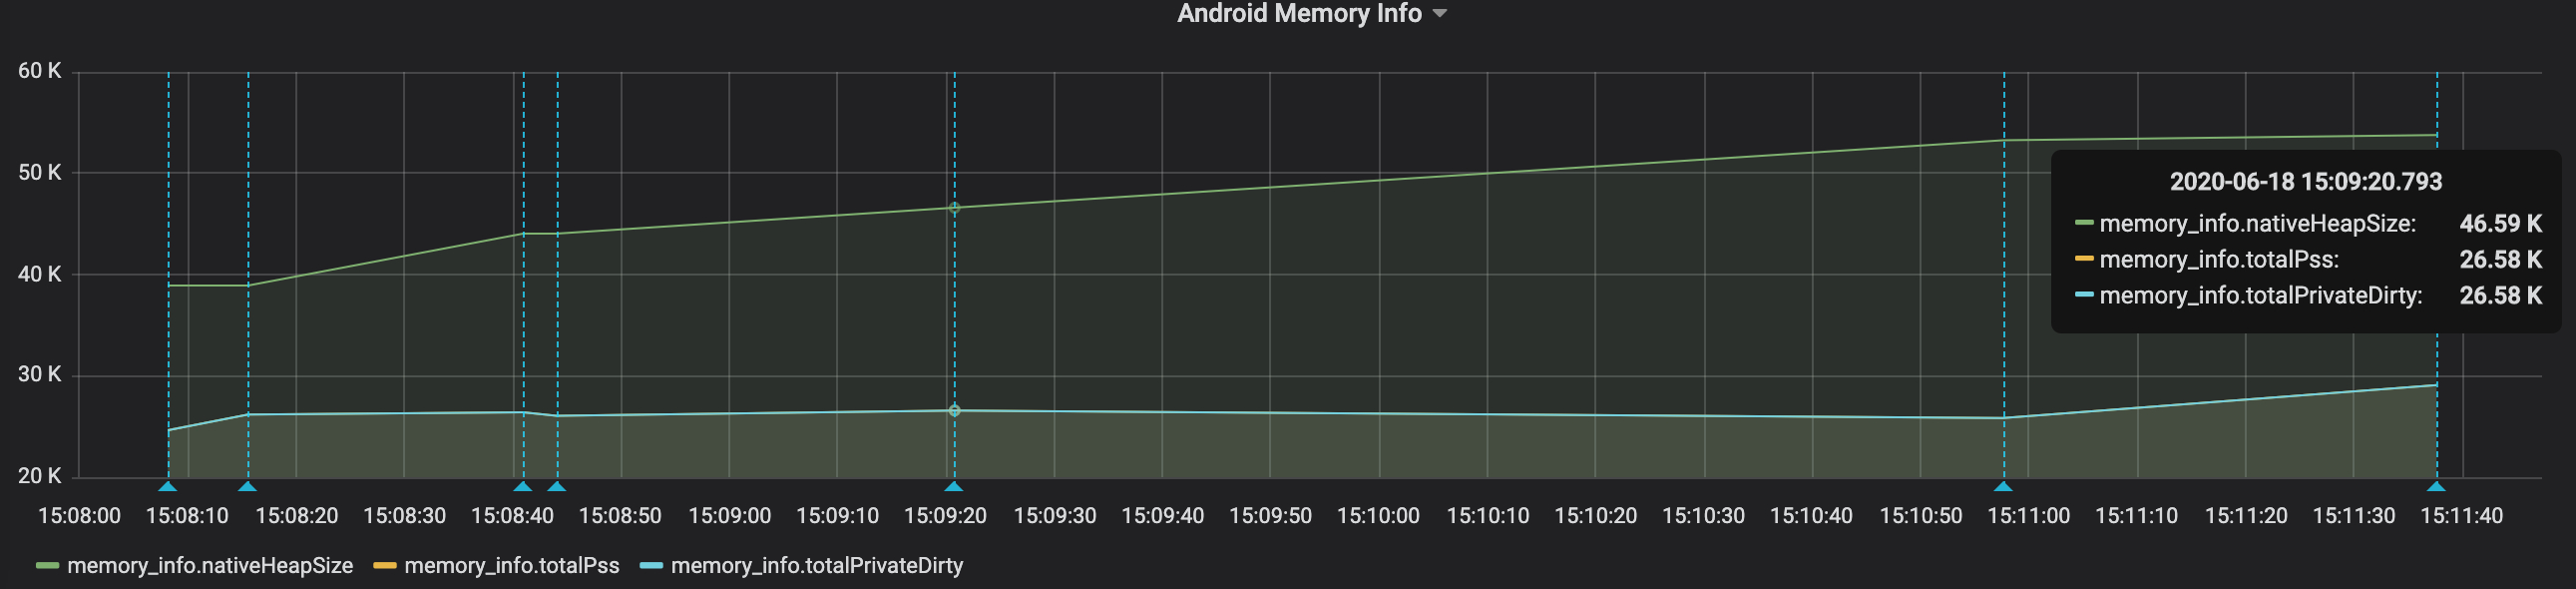
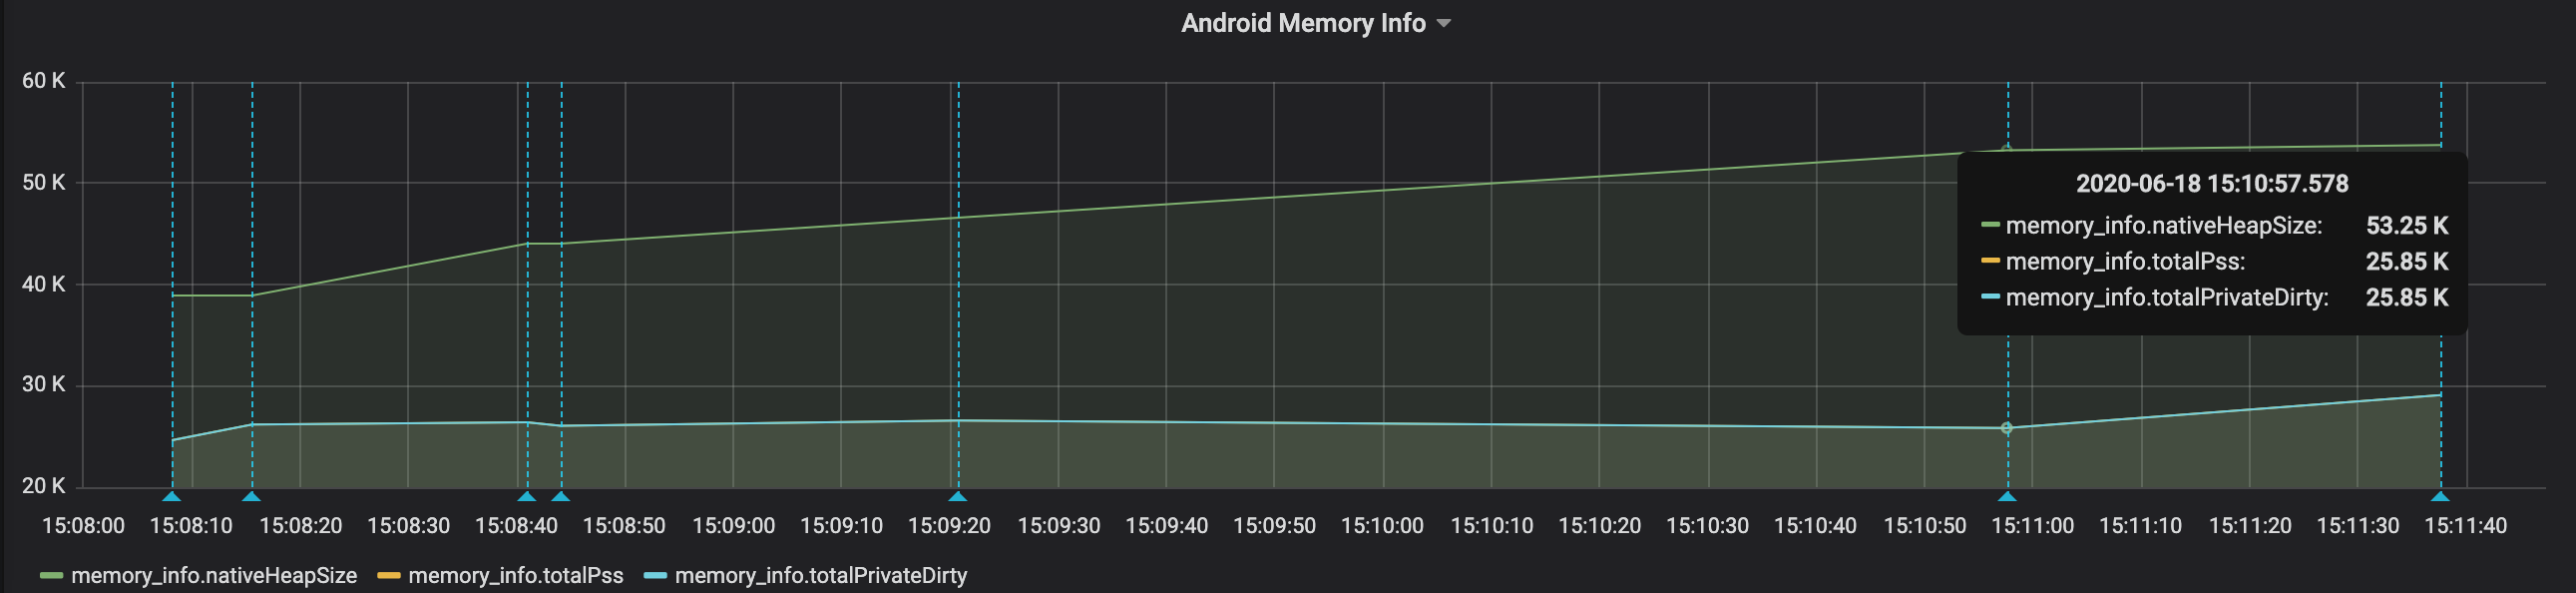
Tele-Consultation Flow - memory info
Future Enhancements:
- Extend this to capture other metrics - Battery info, CPU info
- Setting the benchmark for these metrics and set up alerting mechanism
- Collecting Android logs which helps in debugging
Conclusion:
In this article we learnt how we can capture non-functional metrics through automation. This will help in giving insights about the app performance and will help in providing the best user experience to the customers.
References:
- https://appiumpro.com/editions/5-performance-testing-of-android-apps
- https://developer.android.com/studio/command-line/dumpsys
- http://appium.io/docs/en/advanced-concepts/event-timings/
- https://grafana.com/docs/grafana/latest/features/dashboard/dashboards/
- https://docs.influxdata.com/influxdb/v1.8/write_protocols/line_protocol_tutorial/
Join us
We are always looking out to hire for all roles in our tech team. If challenging problems that drive big impact enthral you, do reach out to us at careers.india@halodoc.com
About Halodoc
Halodoc is the number 1 all around Healthcare application in Indonesia. Our mission is to simplify and bring quality healthcare across Indonesia, from Sabang to Merauke.
We connect 20,000+ doctors with patients in need through our Tele-consultation service. We partner with 1500+ pharmacies in 50 cities to bring medicine to your doorstep. We've also partnered with Indonesia's largest lab provider to provide lab home services, and to top it off we have recently launched a premium appointment service that partners with 500+ hospitals that allows patients to book a doctor appointment inside our application.
We are extremely fortunate to be trusted by our investors, such as the Bill & Melinda Gates foundation, Singtel, UOB Ventures, Allianz, Gojek and many more. We recently closed our Series B round and In total have raised USD$100million for our mission.
Our team work tirelessly to make sure that we create the best healthcare solution personalised for all of our patient's needs, and are continuously on a path to simplify healthcare for Indonesia.