Transporter - Centralised logging system
Logs are the quintessential tools for every software engineer, more so in a fast-paced, high scale and agile environment like Halodoc. With a release cadence of 2 weeks, we are constantly shipping new features that take us closer to our vision of Simplifying Healthcare. Logs play a critical role not only in helping debug bugs in the code, but also are be immensely helpful to help understand the inner working of the code.
What is Transporter?
Transporter, which is Halodoc's own implementation of the centralized logging system, consolidates all of the log data and pushes it to one central, accessible, and easy-to-use interface. Centralized logging is designed to make the life of engineers easier. Not only does it provide multiple features that allow you to easily collect log information, but it also helps you consolidate, analyze, and view that information quickly and clearly.
Why Transporter?
Logs give you insight into what a system is doing, as well do a post-mortem of the events that occurred in the past. Usually, these logs are written to files on local disks. When your system grows to multiple hosts, managing the logs and accessing them can get complicated. Searching for a particular error across hundreds of log files on hundreds of servers is difficult without good tools. A common approach to this problem is to setup a centralized logging solution so that multiple logs can be aggregated in a central location.
So we came up with in house solution called "Transporter", to record and ship client app logs of different taxonomies to our remote server.
Different kind of Transporter events or logs
- API failure events : Errors that occur can be logged and visualised in Kibana.
- Transactional events : Transactional events for order flow of Pharmacy Delivery, Contact Doctor, Labs, Appointments can be logged and visualised in Kibana
- Crash events : Any crash happens in app can be logged and visualised in Kibana
- Analytics events (User behaviour) : Analytics events that track the user behaviour.
As a part of phase 1, we are scoped the system to only record API failure events.
High-level design
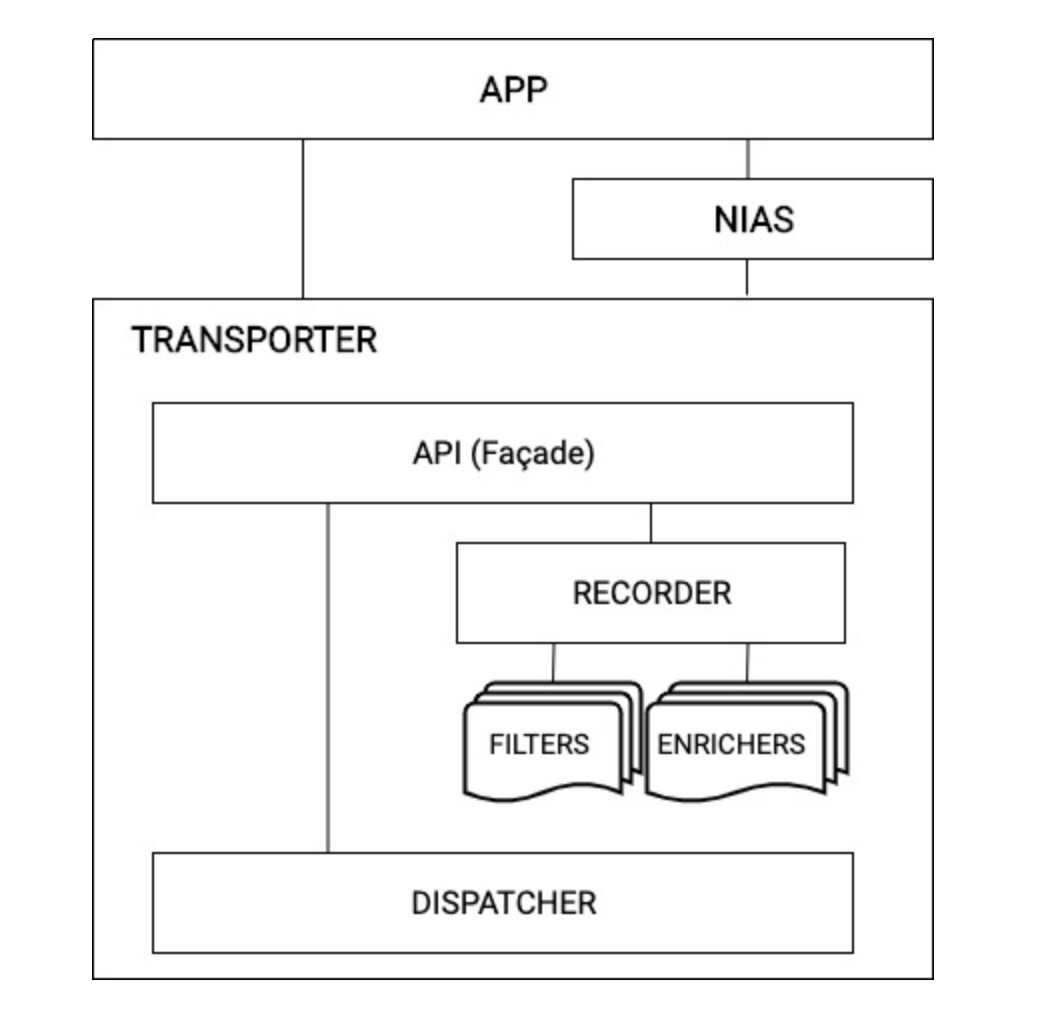
API/Transporter Façade : Events will be logged from Transporter. API will provide the option to distinguish event type and also option to configure the behavior of the SDK.
Recorder : Records events in the storage system. Storage can be either file or DB. Each event type will have its own file and package, will have a file to store the recording info. It will be an abstraction over the underlying storage.
Filters : Applied while storing the logs and dispatching them. Logs can be filtered based on the configuration of the log type.
Enrichers : Applied before the recording phase to store some event info. It will also be applied during the dispatch phase to add info to the recorded logs. Each event type may have its own enrichers.
Dispatcher : Dispatcher will be HTTP layer for uploading logs to server.
NIAS : It is an analytics SDK(scoped for phase 2) used for providing recording capabilities of analytics events.
Structure of the transporter events or logs
Events shall be structured based on pre-defined taxonomy. This helps us in:
- Fetching events on various predefined properties
- Correlating events across systems(client, server, across services)
For example API failure event with taxonomy
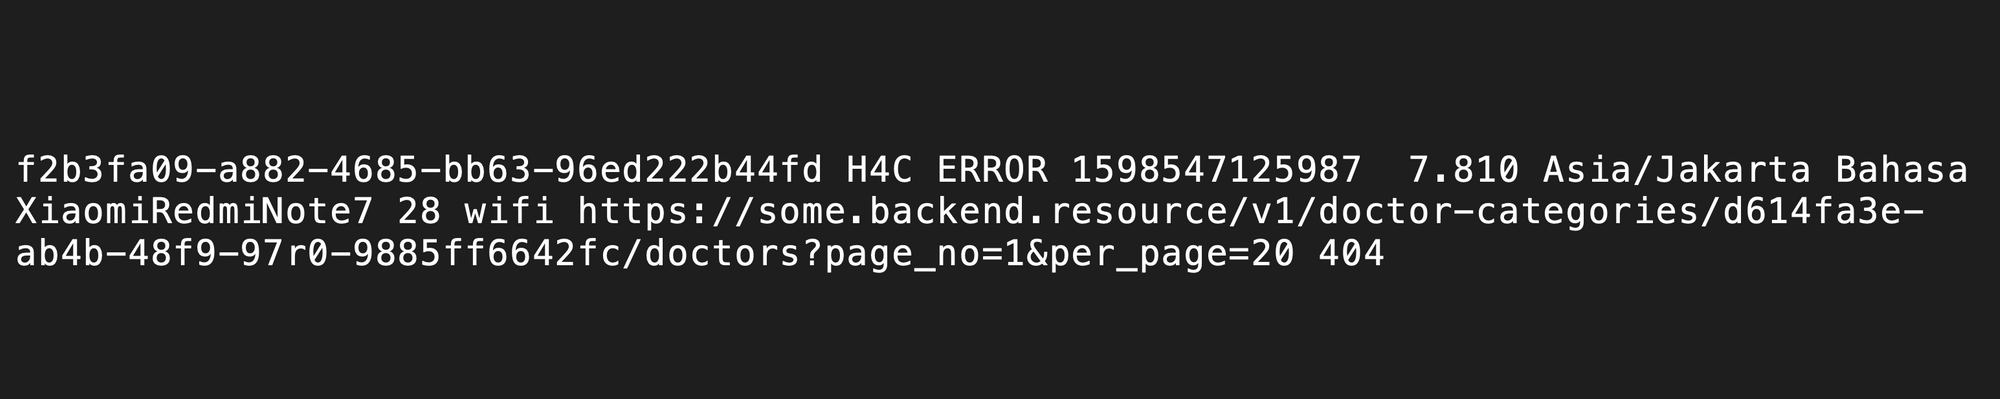
- f2b3ffa09-a882-4685-bb63-96ed22b44fd ->User Id
- H4C -> App name
- INFO -> Default log type (like DEBUG, INFO, ERROR)
- 159857125987 -> Time stamp
- 7.810 -> App version
- Asia/Jakarata -> Time zone of the device
- XiaomiRedmiNote7 -> Device model
- 28 -> Android API version
- wifi -> Network connection
- https://some.backend.resource/v1/doctor-categories/ -> Backend API
- 404 -> Error code
So far, we have discussed how we collect logs in client application using transporter facade, apply filters and enrich them.
Whenever the app goes in background, the collected logs are compressed to a gzip file and are posted to a backend service with some meta-data for further processing. Henceforth, we will be calling this backend service as Logging Service.
What is Logging Service?
Logging service is a backend application dedicated to once cause - make the application logs visible to client via Kibana dashboard and maintaining the state of logs. This is a 5 step process -
- Storing the file uploaded by client to S3.
- Unzipping the
gzipfile received to a folder. - Crawling through the extracted files and creating payload.
- Bulk push to Elastic Search.
- Visualise in Kibana.
Since we wanted higher throughput with optimised cost for this application, we decided to write a very light weight application in Go. By using go-routines, we can process multiple files concurrently without having much implications on memory and CPU.
How do we process logs?
As already discussed, a REST endpoint is the entry point for this logging service. The endpoint receives a stream of bytes which essentially is a gzip file which client has requested to be available on Kibana Dashboard.
The stream of bytes is redirected to our storage service(Lazarus) which stores the uploaded file to Amazon S3 so that we never loose the file that client intended to upload originally. Once the file is uploaded to S3, we receive a document URL for the file.
Since processing this file and making the contents available on Kibana is going to be a time consuming process, we do not expect client to wait for that amount of time. We achieve this by decoupling the upload logic from processing logic. Once the files are uploaded, we push the processing requests for the files to a Kafka topic. Once the processing requests are pushed to Kafka, we move logs further in our state machine and provide updated status for logging request.
A Kafka consumer runs on the same application that keeps polling the same topic which has all the processing requests. As soon the consumer routine receives a log processing request -
- Fetch the file from the document URL.
- If the uploaded file was password protected, use the salt to deduce the password and extract the file to a temporary location in machine.
- Parse through all the files that are present in the folder and created indexable payloads and bulk push to ES.
For visualising the logs, we have an index pattern in Kibana with a custom time stamp field to show the latest uploaded logs.
TL;DR
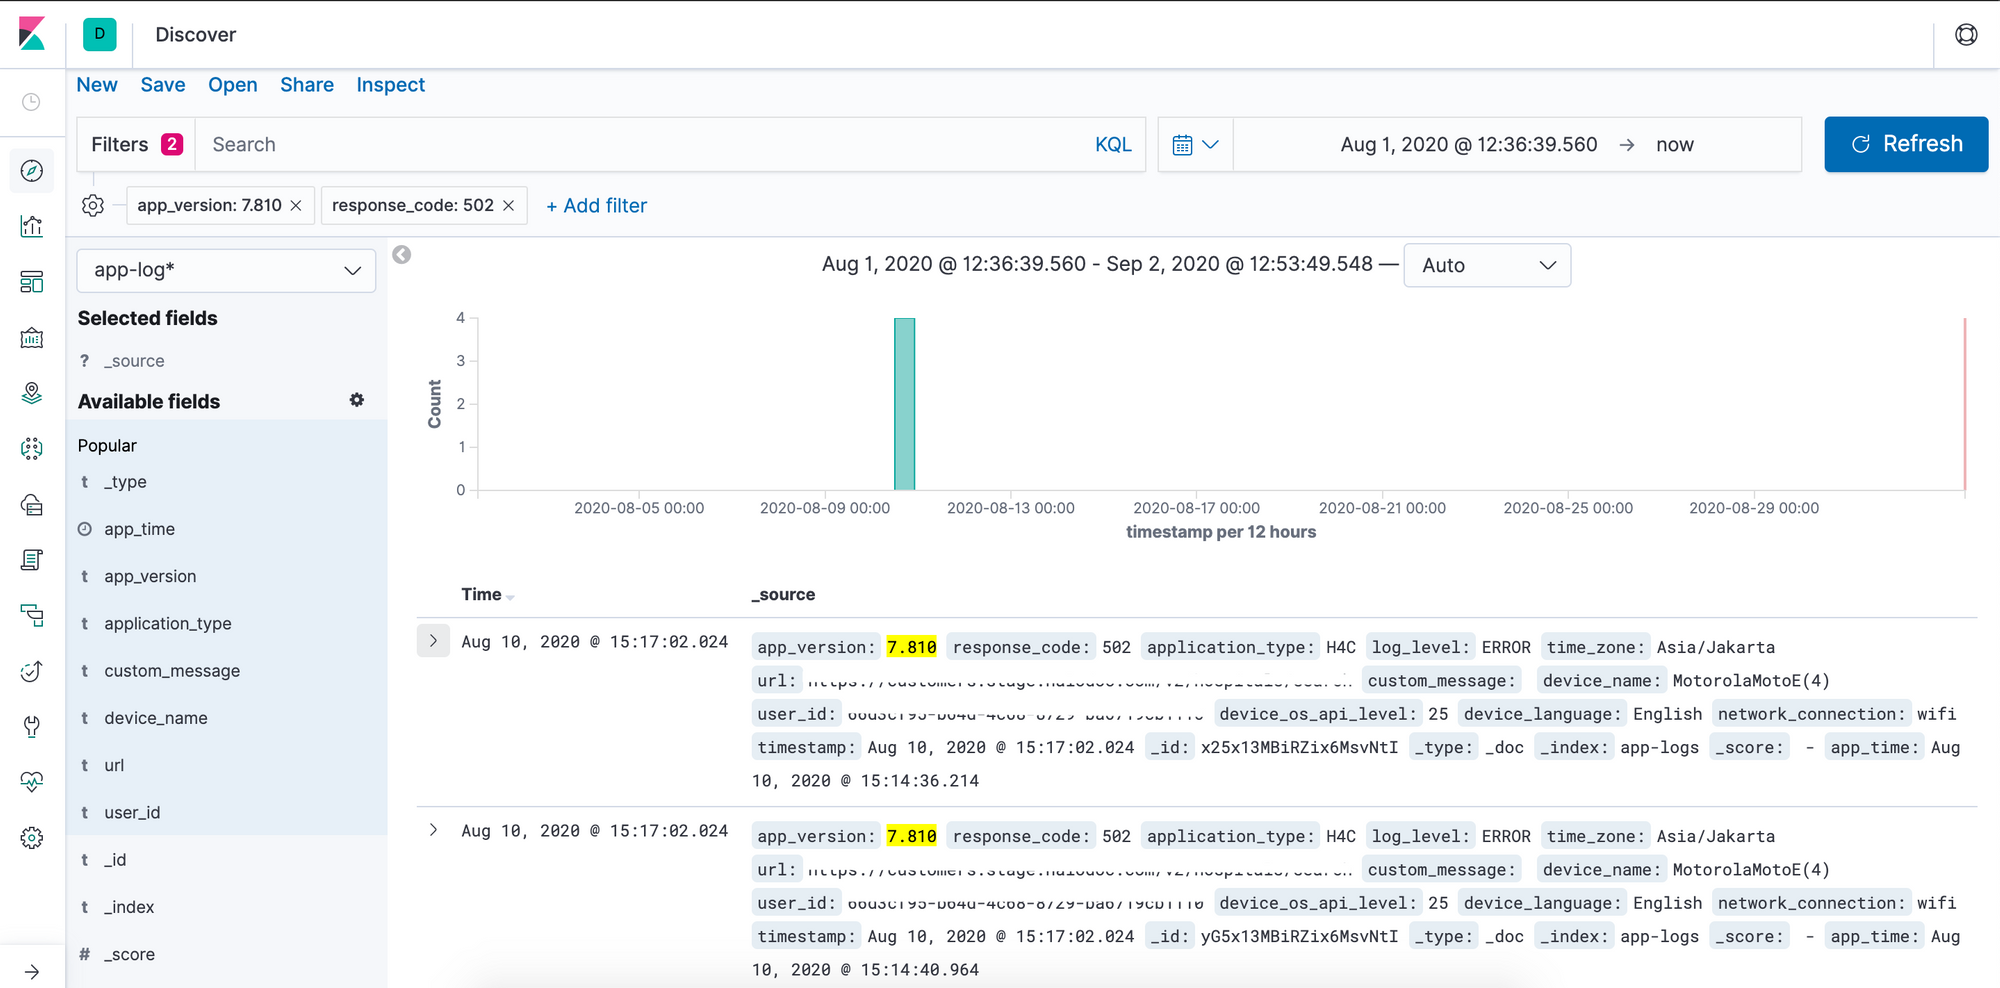
Using Transporter at client and logging service, we convert this -
to this -
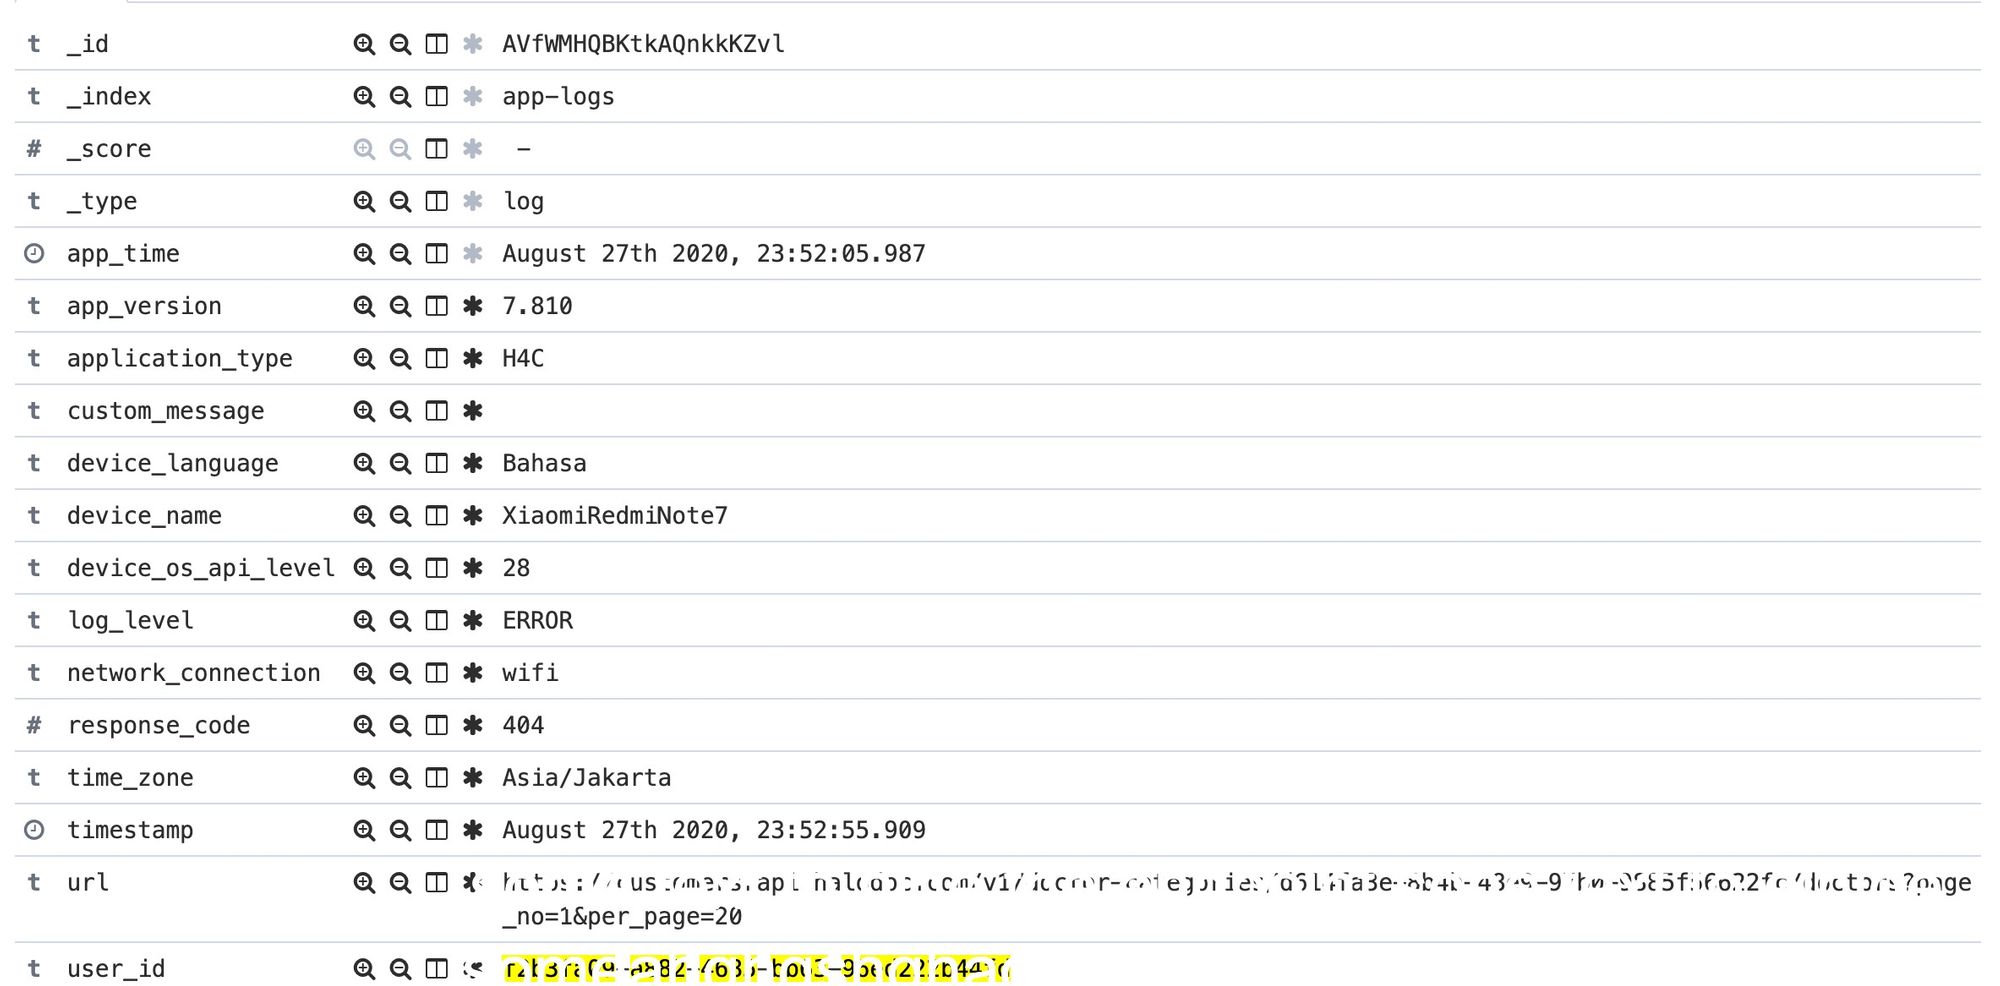
Kibana dashboard helps to filter out specific log based on app version, response code, device, language, user id etc
Summary
In this post, we discussed about the Transporter, our own centralised logging system and how it consolidates all of the log data and pushes it to one central, accessible and easy-to-use interface to help engineers to debug the issues.
Join us
We are always looking out for top engineering talent across all roles for our tech team. If challenging problems that drive big impact enthral you, do reach out to us at careers.india@halodoc.com
About Halodoc
Halodoc is the number 1 all around Healthcare application in Indonesia. Our mission is to simplify and bring quality healthcare across Indonesia, from Sabang to Merauke. We connect 20,000+ doctors with patients in need through our Tele-consultation service. We partner with 3500+ pharmacies in 100+ cities to bring medicine to your doorstep. We've also partnered with Indonesia's largest lab provider to provide lab home services, and to top it off we have recently launched a premium appointment service that partners with 500+ hospitals that allow patients to book a doctor appointment inside our application. We are extremely fortunate to be trusted by our investors, such as the Bill & Melinda Gates Foundation, Singtel, UOB Ventures, Allianz, GoJek and many more. We recently closed our Series B round and In total have raised USD$100million for our mission. Our team works tirelessly to make sure that we create the best healthcare solution personalised for all of our patient's needs, and are continuously on a path to simplify healthcare for Indonesia.