
Automating Web Performance Testing in CI/CD Using Lighthouse and Core Web Vitals
At Halodoc, web performance directly affects how users discover and access healthcare services. Slow loads or layout shifts not only hurt user trust and search rankings, but they also used to be caught only after deployment, through production-only monitoring.
Problem: Regressions caught late through production-only signals.
Solution: Automated Lighthouse checks in MR CI/CD.
Scope: High-traffic URLs, Core Web Vitals-based thresholds.
Outcome: MRs blocked on regressions, faster feedback, less manual perf testing.
Why We Built This
Web performance issues are difficult to catch early because validation is usually inconsistently enforced, non-blocking, and reactive. When performance testing did occur, it was only for larger feature deployments and on shared staging environments with multiple changes present, making attribution difficult and increasing turnaround time due to repeated manual checks.
As a result, performance regressions were typically discovered post-deployment through production monitoring tools, at a point where the code was already merged and live. Addressing these issues often required reactive fixes, additional verification cycles, or rollbacks, increasing both recovery time and operational overhead. Performance validation lacked a consistent, automated signal before code reached production, so regressions surfaced as production alerts or metrics rather than during the merge-review process.
This led to three recurring problems:
- Inconsistent enforcement: Performance checks were selective and non-blocking.
- Staging noise: Shared staging environments contained multiple changes, making attribution unreliable.
- Late discovery: Regressions surfaced only after deployment through production monitoring.
To address this, we introduced web performance as a mandatory pre-deployment check by:
- Automatically validating performance before deployment
- Blocking merges that exceed defined performance metric thresholds
- Reducing manual performance testing efforts for routine changes
- Isolating the performance impact of the specific merge request being deployed
- Persisting reports as build artifacts so developers can inspect detailed Lighthouse findings without rerunning tests locally.
Choosing the Right Tool
We evaluated three broad approaches and optimised for pre-deployment, speed, and control.
- Production-only signals, such as PageSpeed Insights and Chrome UX Report, which rely on live traffic and are unsuitable for validating merge-request code before deployment
- External performance platforms like WebPageTest and SaaS monitoring tools, which introduce external dependencies, queue latency, and limitations when testing private containerized builds
- CI-oriented frameworks, such as Lighthouse CI, which simplify assertions but execute sequentially and become a bottleneck when multiple URLs and repeated runs are required within tight MR pipeline SLAs.
We ultimately chose Lighthouse’s open-source Node.js library and built a custom test framework around it. This gave us control over environment isolation, parallelism, retries, URL selection, and reporting, while still relying on a well-supported engine maintained by the Chrome team at Google.
This combination allowed us to enforce performance deterministically before merge, without introducing external dependencies or slowing down developer feedback loops.
Solution Overview
At a high level, the automated workflow in the MR CI/CD pipeline consists of:
- Trigger the test execution framework when any merge request targets the master branch
- Build and run the merge-request code in an isolated container, ensuring the test reflects only the changes being proposed
- Execute Lighthouse performance tests against a curated set of critical, high-traffic URLs
- Evaluate Core Web Vitals metrics against predefined URL-specific thresholds
- Generate a consolidated report with per-URL results and links to detailed Lighthouse reports
- Block the merge when performance thresholds are exceeded
This approach ensures that performance validation happens automatically, consistently, and early—before code is merged and deployed to production.
Architecture
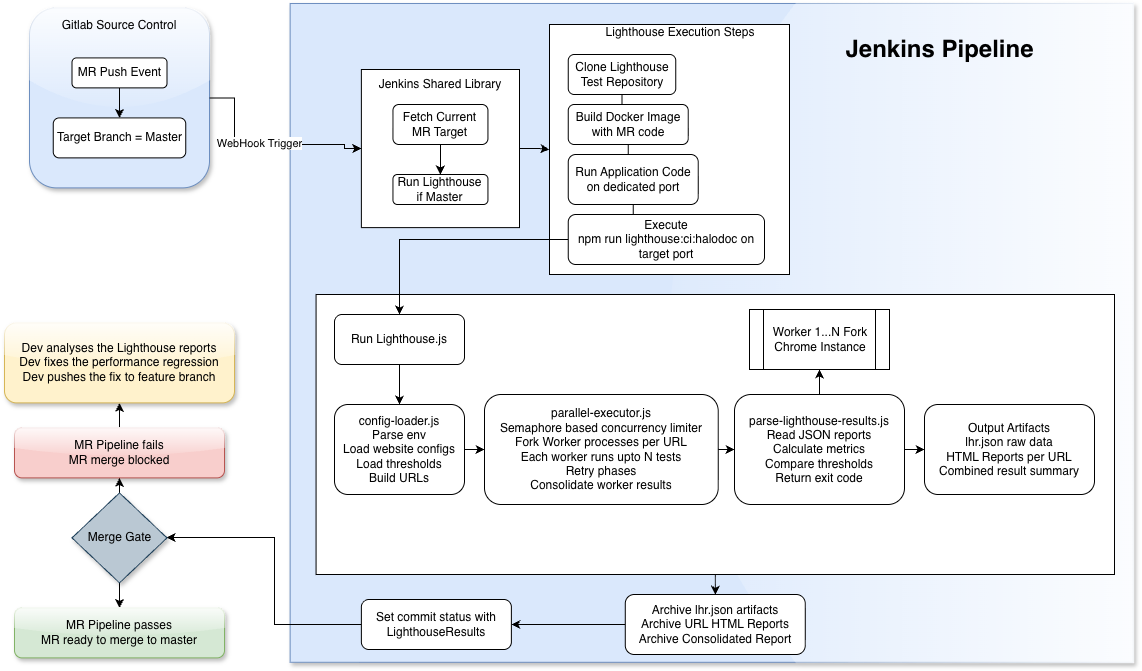
Architecture Summary
- Merge request triggers a Jenkins MR pipeline
- The application is built from the feature branch and runs in an isolated container with production assets
- Lighthouse tests execute against critical URLs
- Results are aggregated and evaluated against predefined thresholds
- Merge is blocked or allowed based on the outcome
Core System Components
The custom test execution framework built around Lighthouse is organized into four logical components, each with a clear responsibility:
Orchestrator – coordinates execution, configuration, and parallelism
- Determines the website under test and parses environment variables
- Loads environment-specific threshold values and website-specific endpoints to be tested
- Loads custom configurable Lighthouse settings and flags
- Coordinates and spawns parallel Lighthouse executions
Worker Processes - run isolated Lighthouse audits per URL
- Launch isolated headless Chrome instances per execution to avoid cross-test interference and ensure reproducibility.
- Run Lighthouse audits independently for each target URL
- Persist raw Lighthouse reports for further analysis
Retry Manager - retries only failed or unstable runs instead of the entire suite
- Identifies incomplete or unstable runs
- Schedules targeted retries wherever required
- Avoids unnecessary re-execution to keep pipeline time bounded
Result Aggregator - aggregates runs, prevents noisy single-run failures from blocking merges
- Groups Lighthouse runs per URL, computing the median metric values
- Aggregates all the individual metrics and Lighthouse reports into a single custom HTML report
- Enforces performance thresholds and determines pipeline outcome
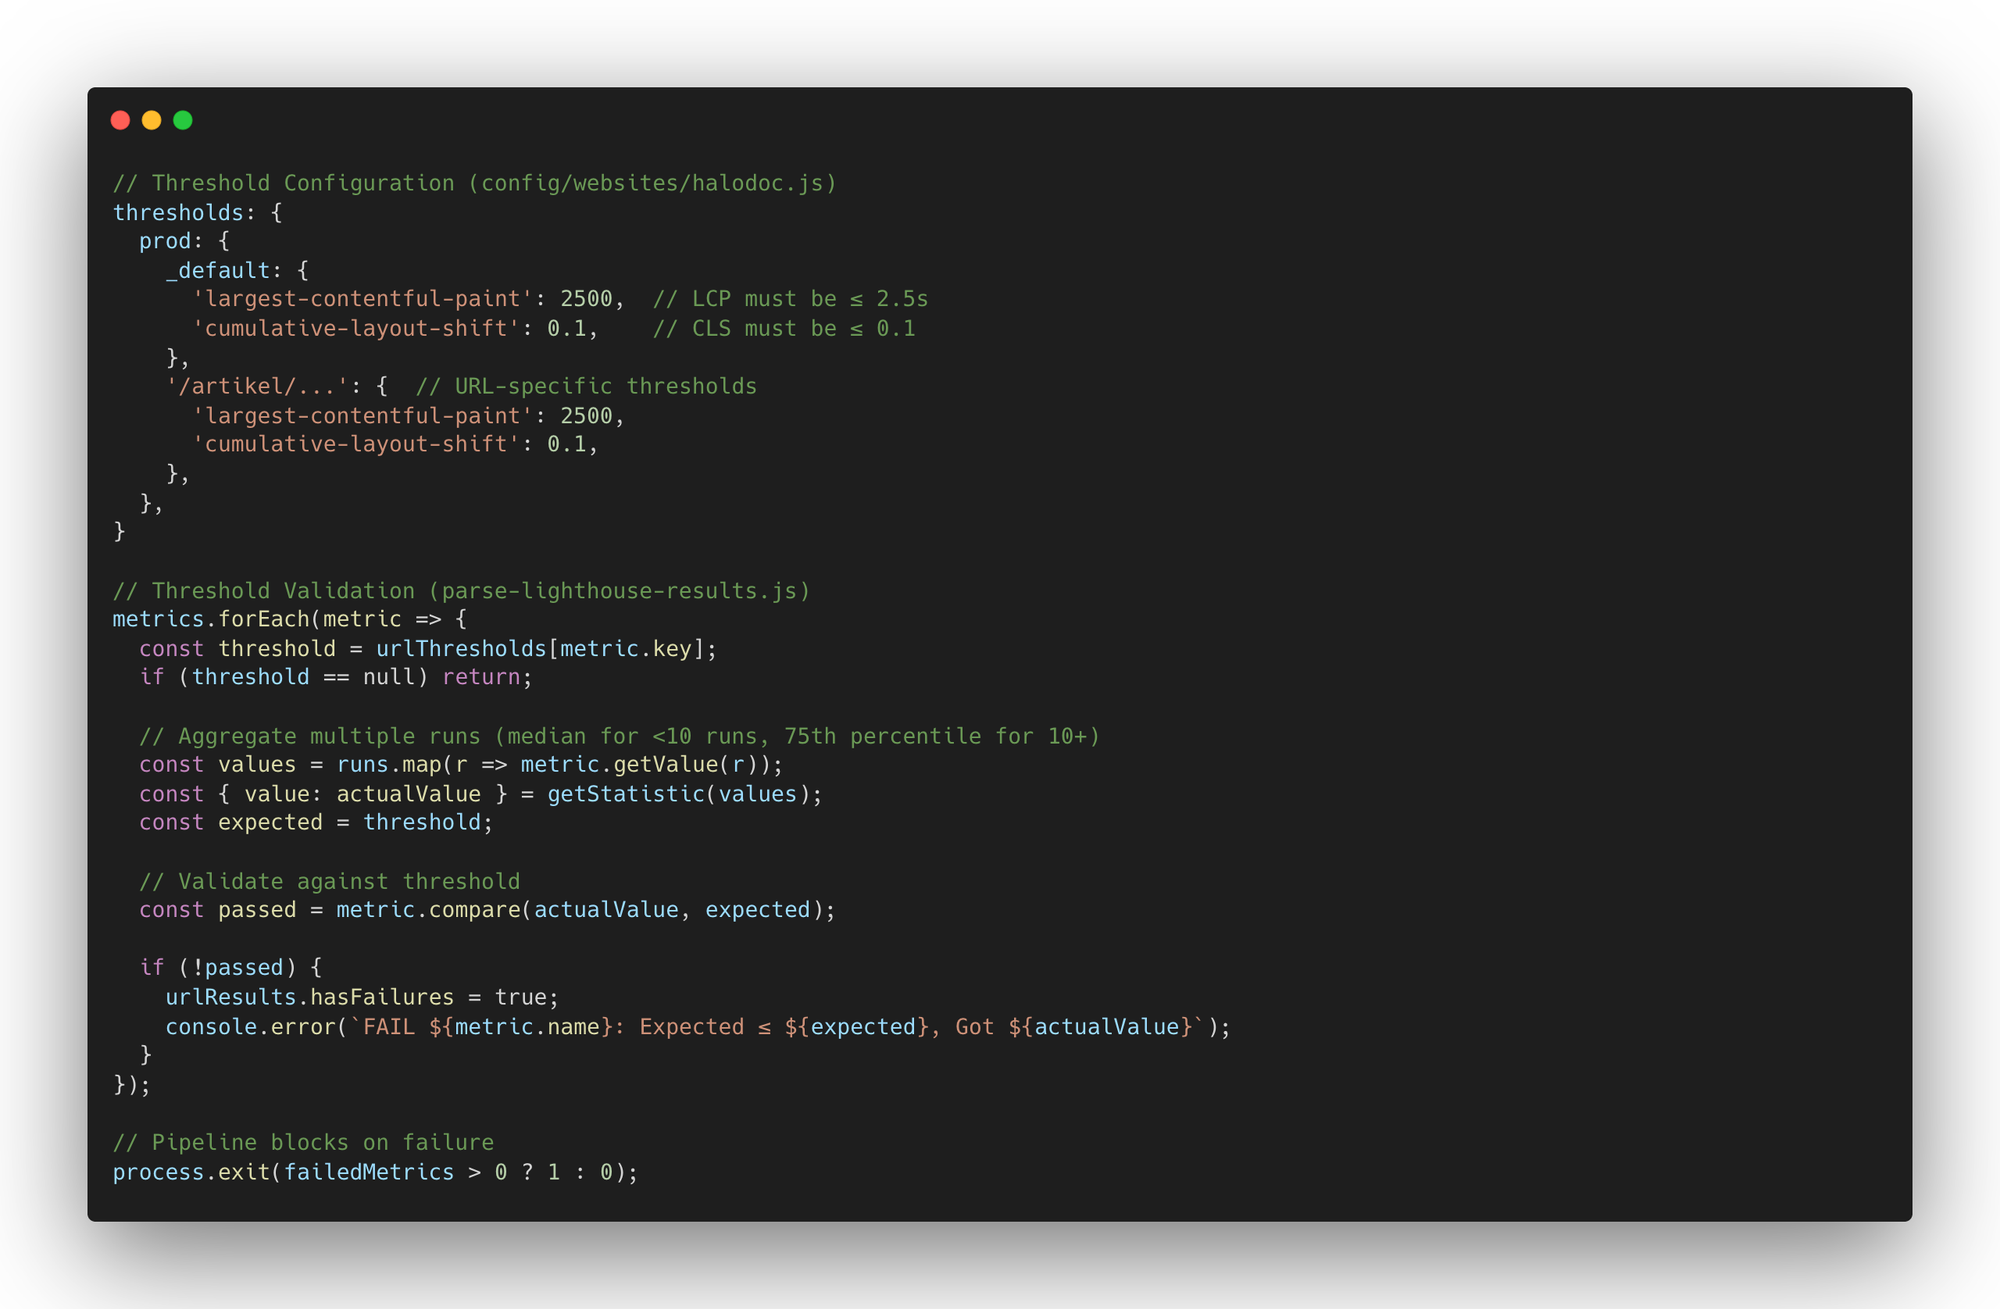
In a nutshell, above code explains how Lighthouse results turn into a merge decision.
Key Design Decisions & Trade-offs
This system deliberately trades a bit of orchestration complexity for faster, more reliable signals at MR time.
Execution Model: Serial Lighthouse CI vs Parallel Programmatic Lighthouse
- Lighthouse CI was initially considered due to its simplicity, but its sequential execution model made it unsuitable for merge-request pipelines involving multiple URLs and repeated runs. Execution times increased linearly and quickly exceeded acceptable CI deployment time limits.
- However, using Lighthouse library programmatically via a test execution framework enabled parallel execution with isolated worker processes, allowing us to keep runtimes predictable while still running multiple iterations per URL. The additional orchestration complexity was an acceptable trade-off to make performance validation viable as a blocking pre-deployment check.
Test Environment: Local Container vs Stage and Production
- Testing against production or staging environments was intentionally avoided for merge-request validation. Production pipeline testing surfaces issues only after deployment, often requiring rollbacks, while shared staging environments make performance attribution unreliable due to the presence of unrelated changes.
- Running Lighthouse against containerised merge-request builds ensured isolation and enabled environment-scoped, delta-based evaluation, where relative change mattered more than absolute values. Although this setup does not exactly mirror production conditions, it reliably surfaced regressions introduced by the merge request.
- The test execution framework remains generic and can also be used to run performance tests against staging or production via a standalone Jenkins job, without coupling those workflows to the deployment pipeline.
Trigger and Sampling Strategy
- Performance validation runs only on merge requests targeting the master branch, ensuring checks apply to production-ready code without the overhead of testing every commit deployed to every branch.
- Multiple Lighthouse runs are aggregated per URL to reduce variance. When 10+ runs are configured, the 75th percentile is used to guard against occasional outliers while still being strict on consistently slow runs. However, the default remains the median of 5 runs, which provides a stable signal without significantly increasing CI execution time.
Observed Outcome
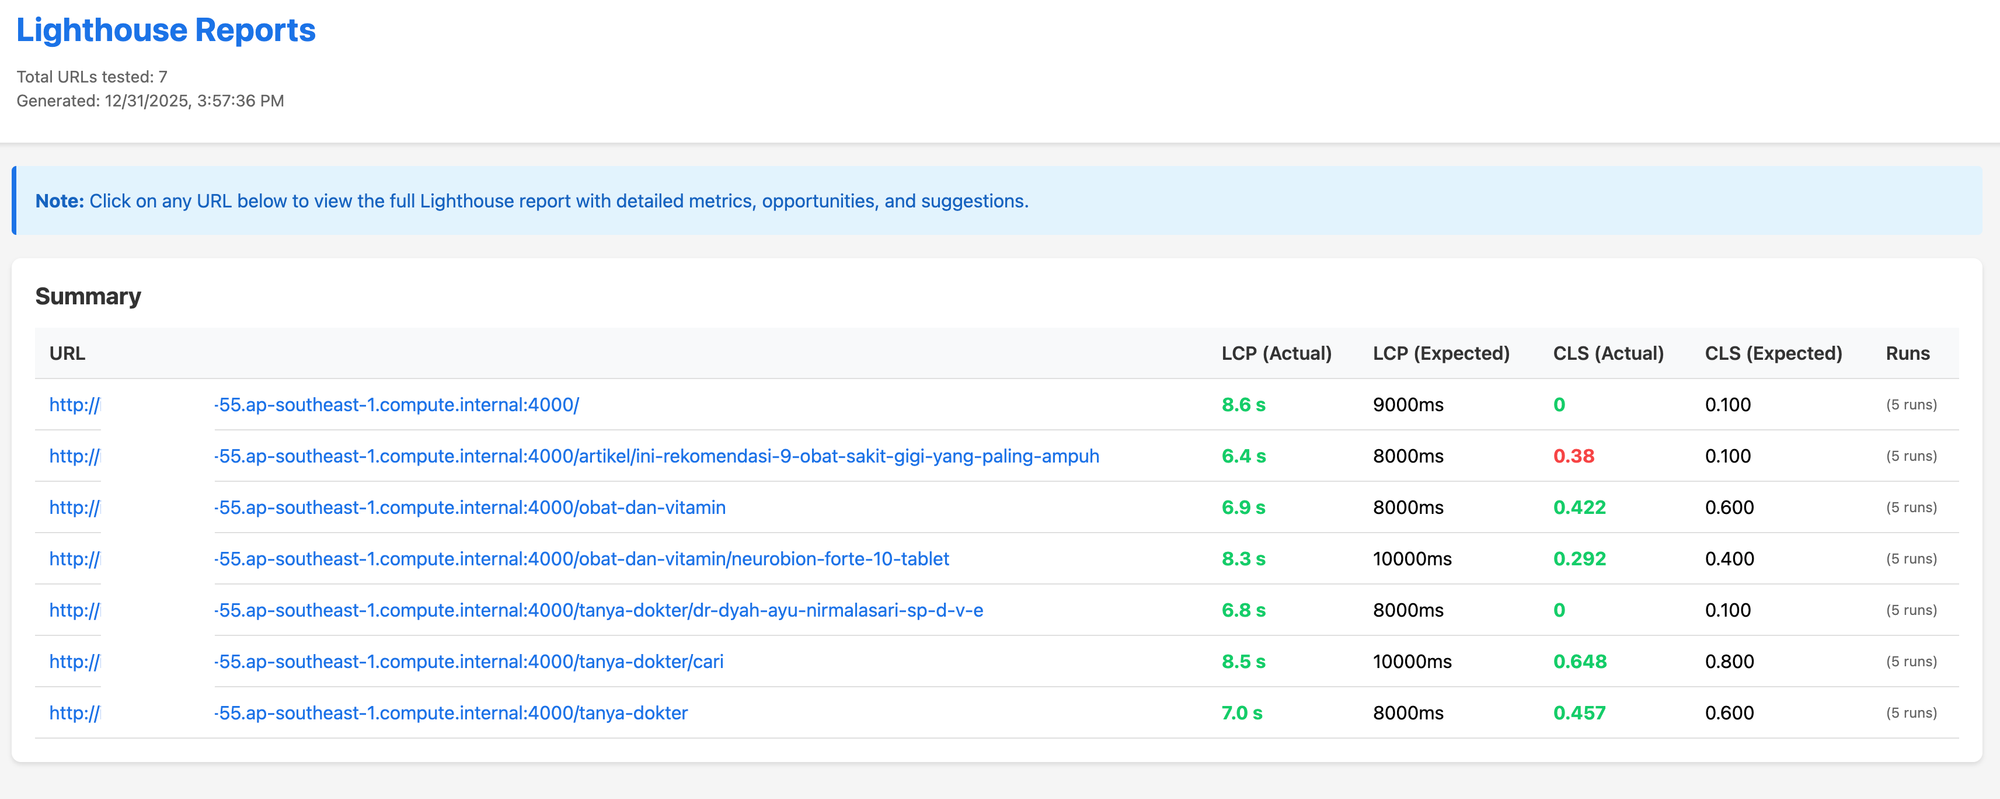
Post rollout, a merge request introduced a CLS regression on a high-traffic article page, which was automatically detected in the MR pipeline and blocked before the deployment pipeline is run.
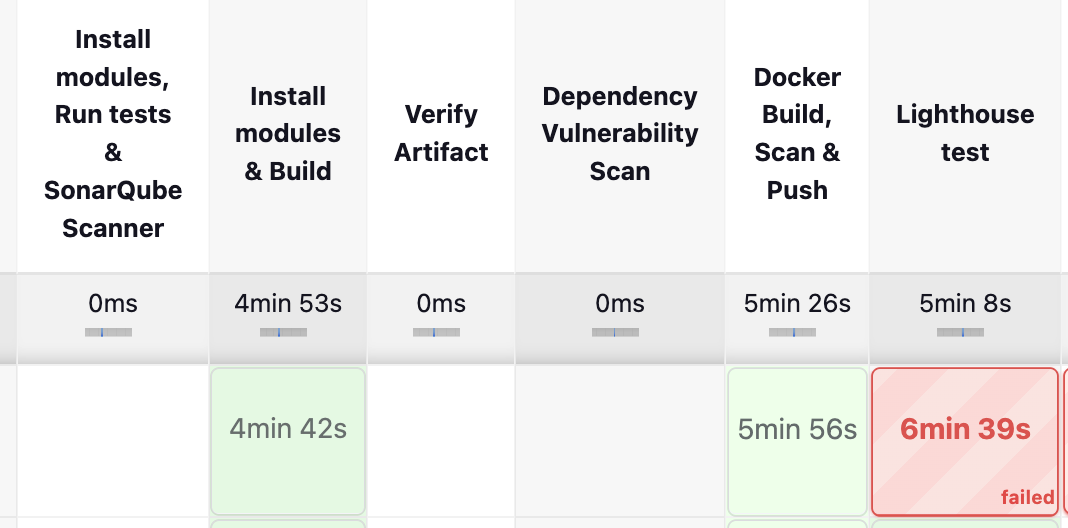
In this case, CLS jumped from our baseline of 0.1 to 0.38, which is above our MR threshold and would hurt user experience.
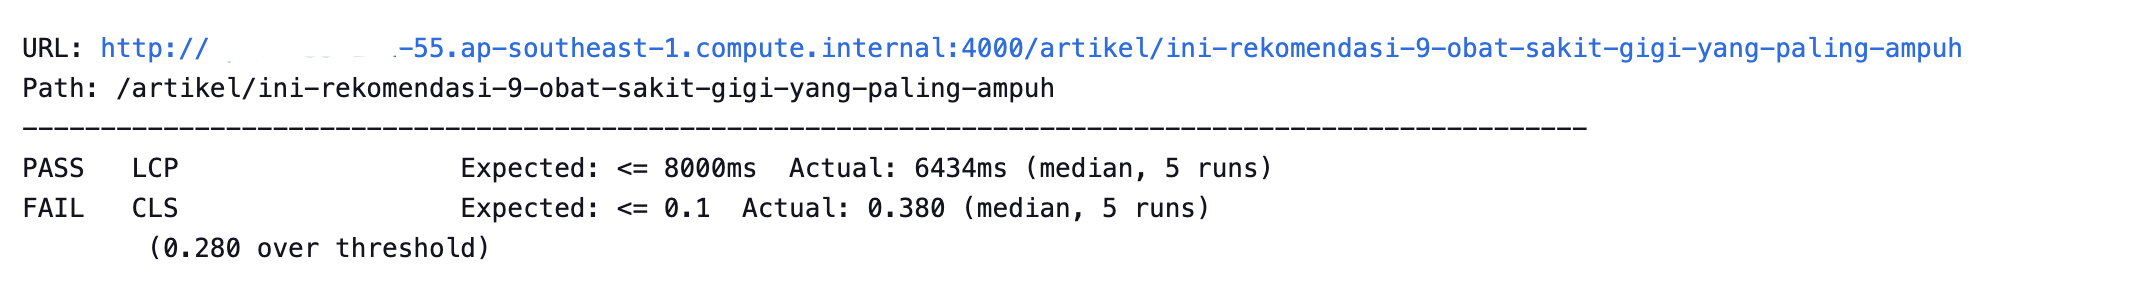
The consolidated performance report, while providing the overall results, also highlights the exact URL and metric that violated the configured threshold.
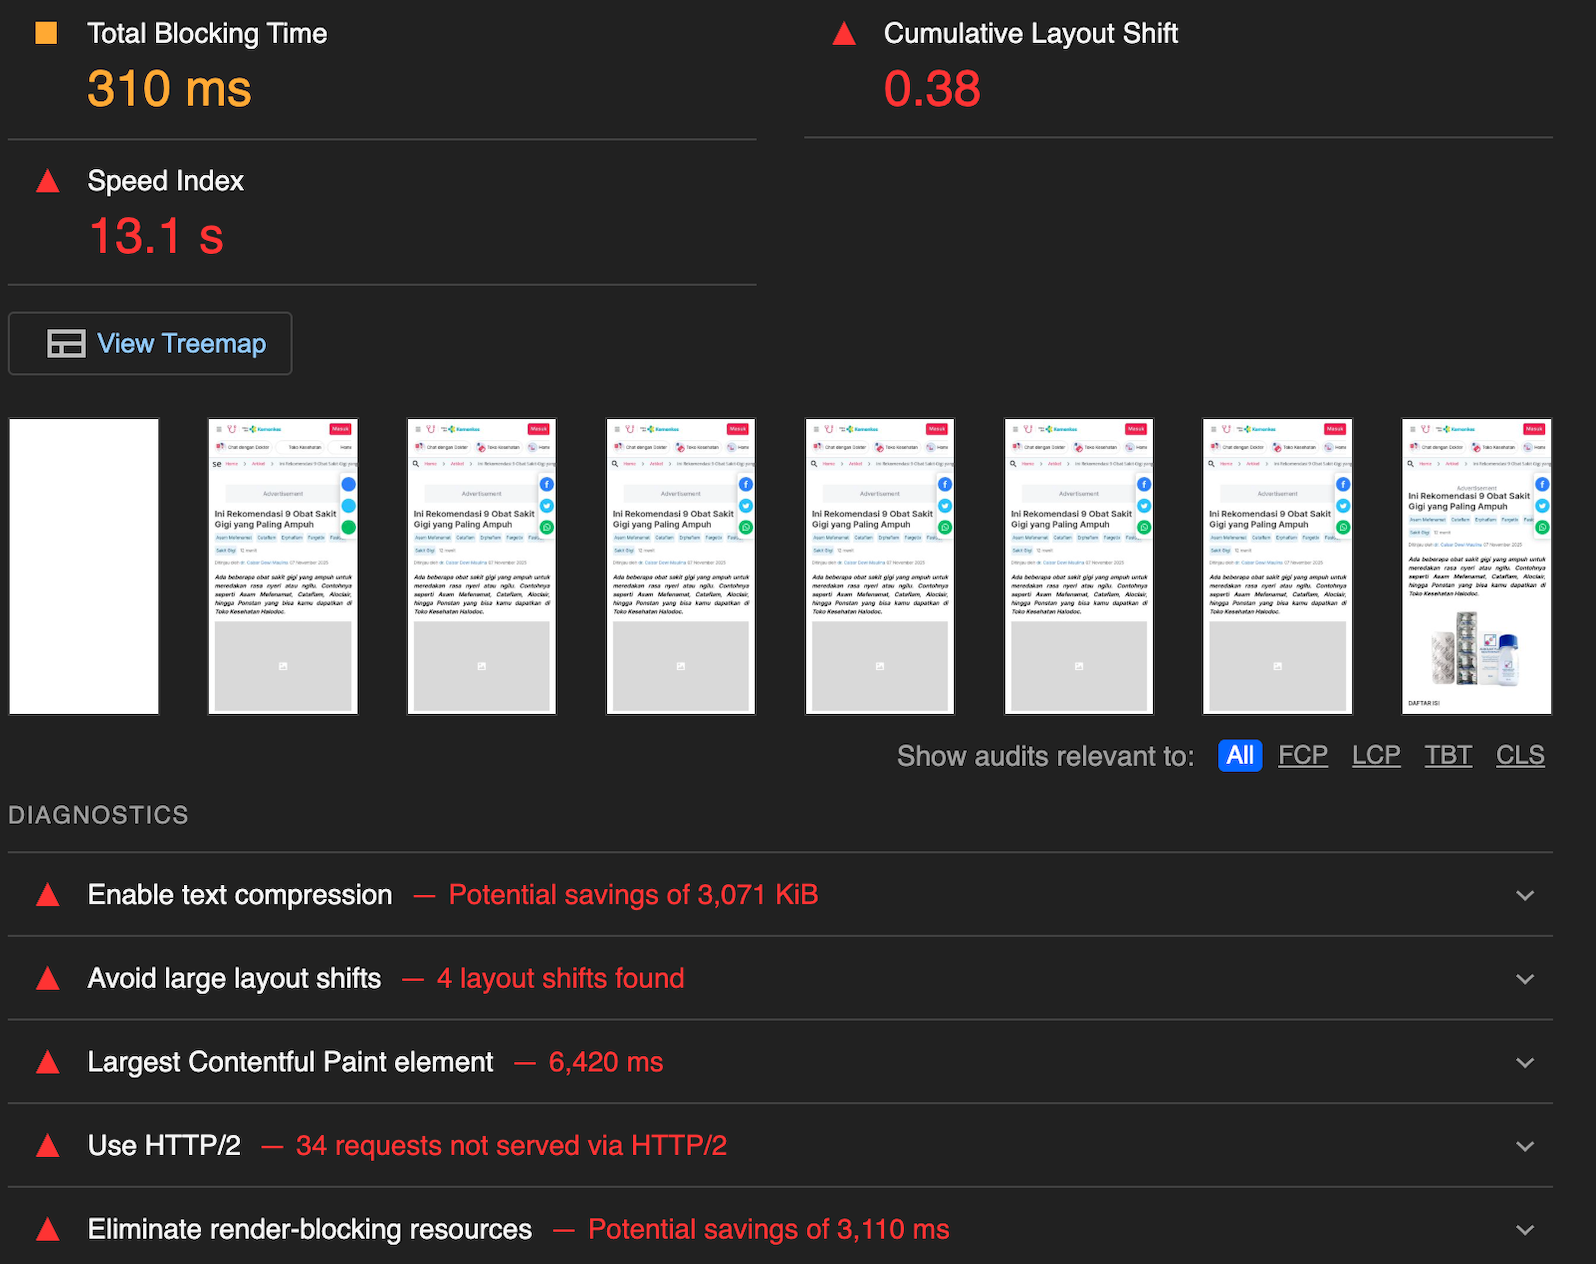
The individual Lighthouse report provides actionable diagnostics and recommendations to help identify the root cause of the CLS regression from the previous baseline of 0.1. In this case, Lighthouse flagged late-loading web fonts and image lazy-loading behaviour as contributors to the CLS spike.
After the developer applies the fix and pushes the updated changes, the Lighthouse test is automatically triggered again as part of the MR pipeline and passes successfully, since the CLS value is now reflected below the configured threshold.
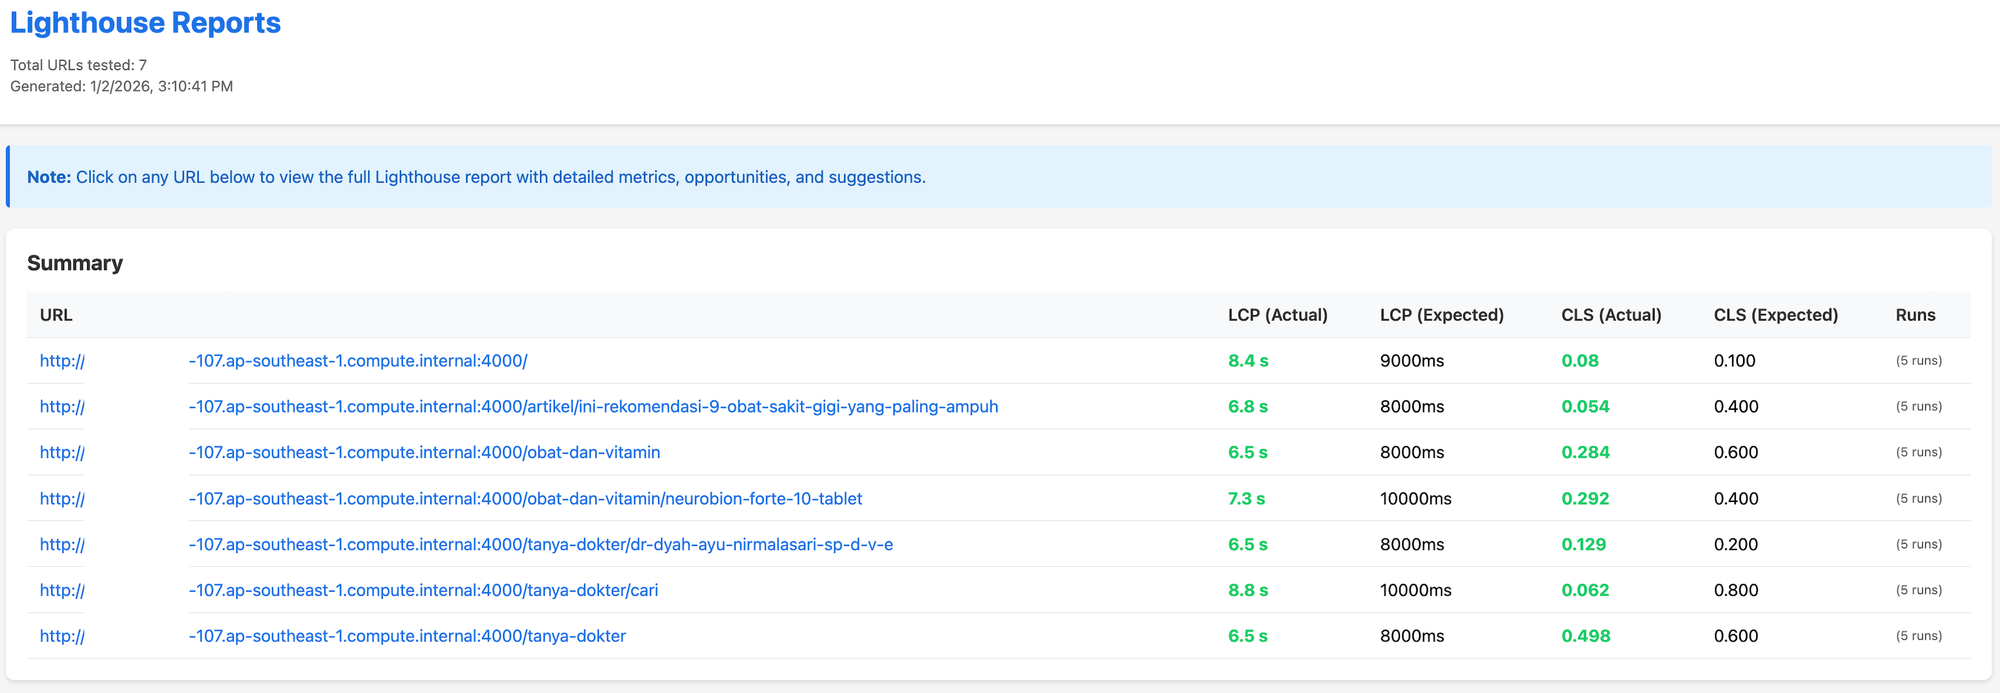
Once the MR pipeline passes, this allows the merge action to be enabled and allows the deployment pipeline to be triggered once the merge is accepted.
Future Improvements
- Smarter URL selection
Today, the set of high-traffic URLs is static and pre-determined manually based on traffic and feature, at that point of time. Going forward, this can be made dynamic by automatically selecting URLs based on real usage and traffic trends. - Adaptive performance thresholds
Current thresholds are static and environment-based. Future iterations can compare results against historical baselines and recent performance trends, allowing thresholds to adjust over time. - Historical visibility
Each merge request is evaluated in isolation today. Persisting results over time would enable trend analysis, regression tracking, and long-term performance insights.
Conclusion
By integrating automated web performance validation directly into the merge-request pipeline, we made performance a deployment requirement rather than a post-release concern, similar to how we already treat test coverage and security scanning. This reduced reliance on manual testing, improved attribution to individual code changes, and ensured performance regressions are caught early—before they impact users.
Over time, this extensible framework allows performance signals, baselines, and coverage to evolve without changing how teams work day to day. As performance expectations grow, it provides a foundation to continuously raise the bar while keeping developer feedback fast, actionable, and reliable.
Collectively, this enables:
- Automated Lighthouse checks on critical URLs per MR
- Threshold-based Core Web Vitals gating merges
- Parallel & retried execution to keep CI fast and stable
- Sanitised, shareable reports as build artifacts for devs and reviewers.
References


Join us
Scalability, reliability, and maintainability are the three pillars that govern what we build at Halodoc Tech. We are actively looking for engineers at all levels, and if solving hard problems with challenging requirements is your forte, please reach out to us with your resume at careers.india@halodoc.com.
About Halodoc
Halodoc is the number one all-around healthcare application in Indonesia. Our mission is to simplify and deliver quality healthcare across Indonesia, from Sabang to Merauke.
Since 2016, Halodoc has been improving health literacy in Indonesia by providing user-friendly healthcare communication, education, and information (KIE). In parallel, our ecosystem has expanded to offer a range of services that facilitate convenient access to healthcare, starting with Homecare by Halodoc as a preventive care feature that allows users to conduct health tests privately and securely from the comfort of their homes; My Insurance, which allows users to access the benefits of cashless outpatient services in a more seamless way; Chat with Doctor, which allows users to consult with over 20,000 licensed physicians via chat, video or voice call; and Health Store features that allow users to purchase medicines, supplements and various health products from our network of over 4,900 trusted partner pharmacies. To deliver holistic health solutions in a fully digital way, Halodoc offers Digital Clinic services, including Haloskin, a trusted dermatology care platform guided by experienced dermatologists.
We are proud to be trusted by global and regional investors, including the Bill & Melinda Gates Foundation, Singtel, UOB Ventures, Allianz, GoJek, Astra, Temasek, and many more. With over USD 100 million raised to date, including our recent Series D, our team is committed to building the best personalized healthcare solutions — and we remain steadfast in our journey to simplify healthcare for all Indonesians.