Real-time monitoring for core web vitals with GA4, GTM & BigQuery
In today's fast-paced web world, speed has become essential. Users expect snappy experiences. So optimising Core Web Vitals (CWVs) is crucial for user experience, SEO and ultimately, conversions. But how do you know if your optimisations are working in real time?
Previously, I have also discussed about monitoring web performance using WebpageTest. For more information, please refer to this blog.
This blog focuses on real-time monitoring of CWVs using Google Analytics 4 (GA4) and Google Tag Manager (GTM). Before I begin, let's understand why we needed to set this up if we already have WebpageTest performance monitoring dashboards.
It all started when we began enhancing the Interaction to Next Paint (INP) metric value. Starting March 12, 2024, INP will replace First Input Delay (FID) as one of the core web vital metrics. Therefore, improving this metric became crucial for enhancing user experience and SEO. Currently, with tools like WebpageTest, we can't measure the INP value for a page or find the element that's causing it. There are some tools like Google's Search Console, PageSpeed Insights and Chrome User Experience Report (CrUX), with the help of which we can see the CWVs values for real users. But we can't rely on these tools alone as:
- They report the CWV metric values on monthly basis (last 28 days data), which means after making the changes, we need to wait longer to see the results.
- They can tell the metric values but can't tell why
With this setup we can send additional data that can help us to debug.
Now let's look into how we did it.
There are three parts to this whole flow:
- Capturing the CWVs metric values
- GTM setup to push the metric values to GA4
- BigQuery export setup to visualise the results
Capturing the CWVs metric values
To capture the CWVs metric values, we used an open-source library called web-vital. This library has APIs to capture the CWVs values including the INP.
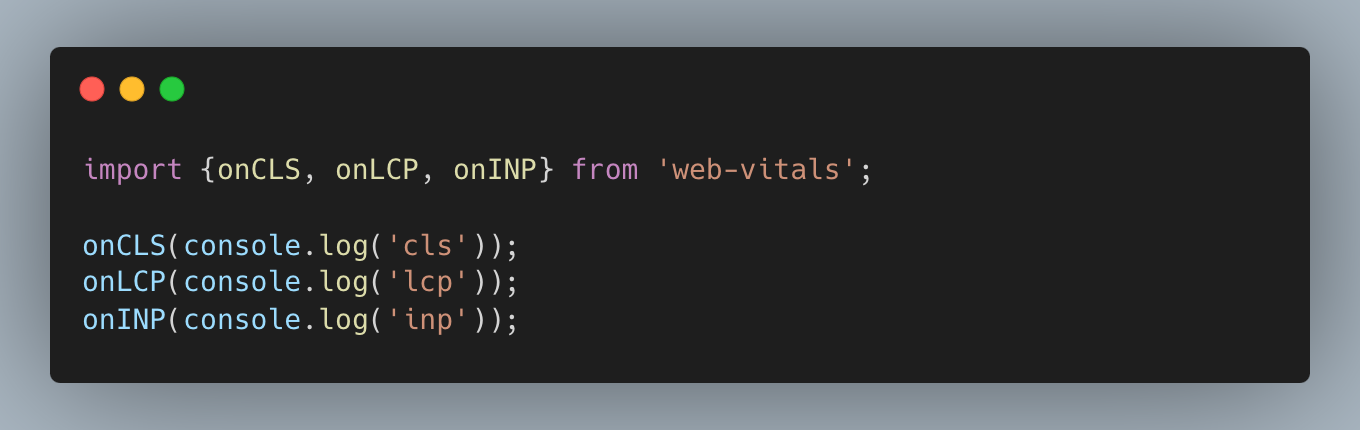
It also has an attribution build, which contains additional attribution properties. They can help in identifying the element responsible for the value. These metric values and other attribution properties can be pushed to GA4 via GTM.
GTM setup to push the metric values to GA4
The GTM setup is responsible for loading the web-vital library and pushing the metric values to Google Analytics 4.
Steps for GTM setup
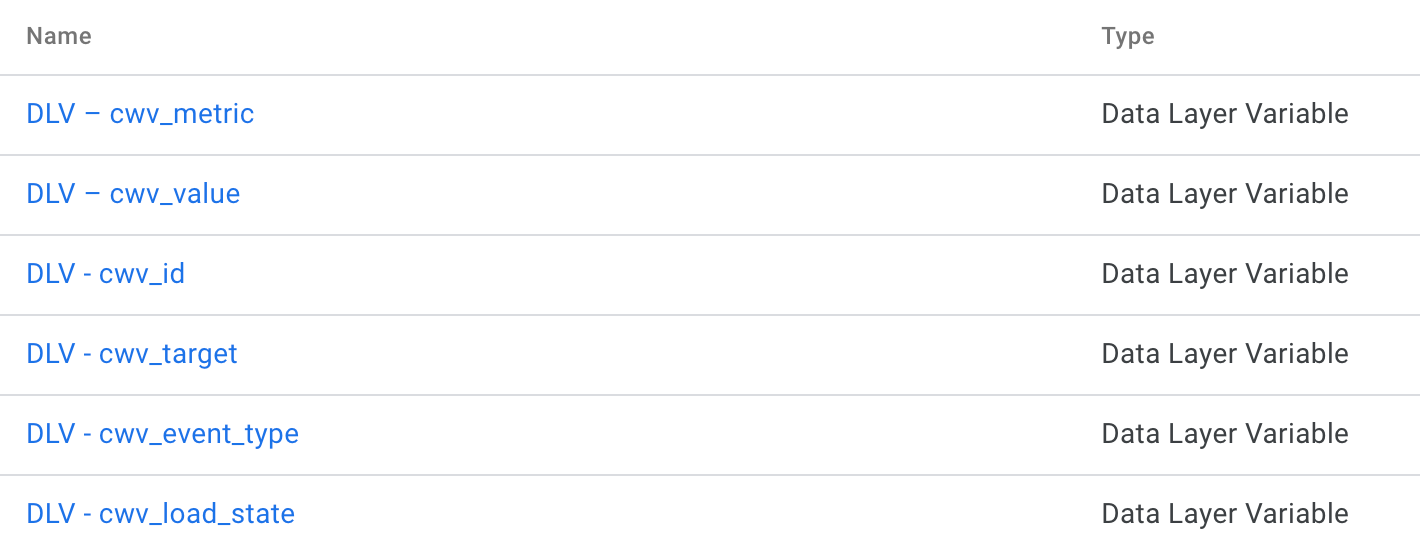
- Variable Creation
Create data layer variables to use in the new tag below. These are going to help us in mapping the metric values or other attribution properties.
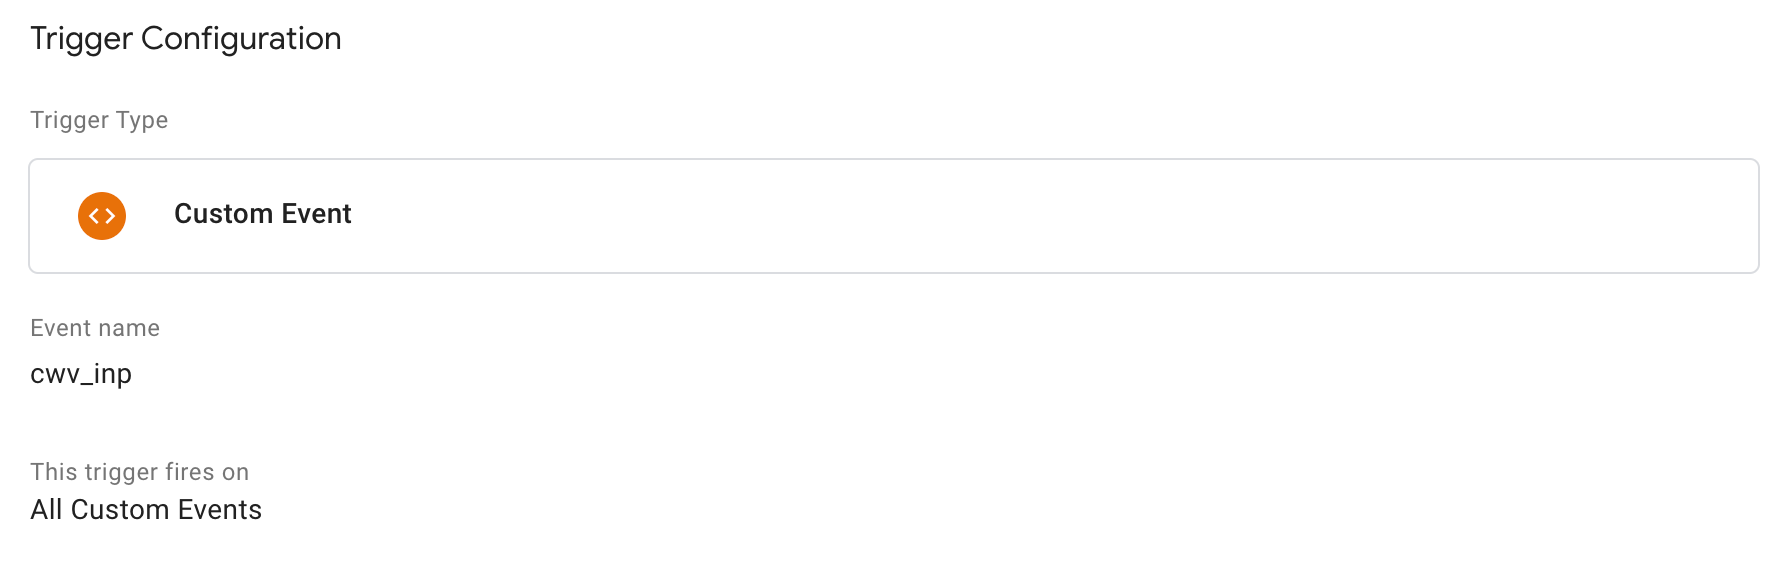
- Trigger Creation
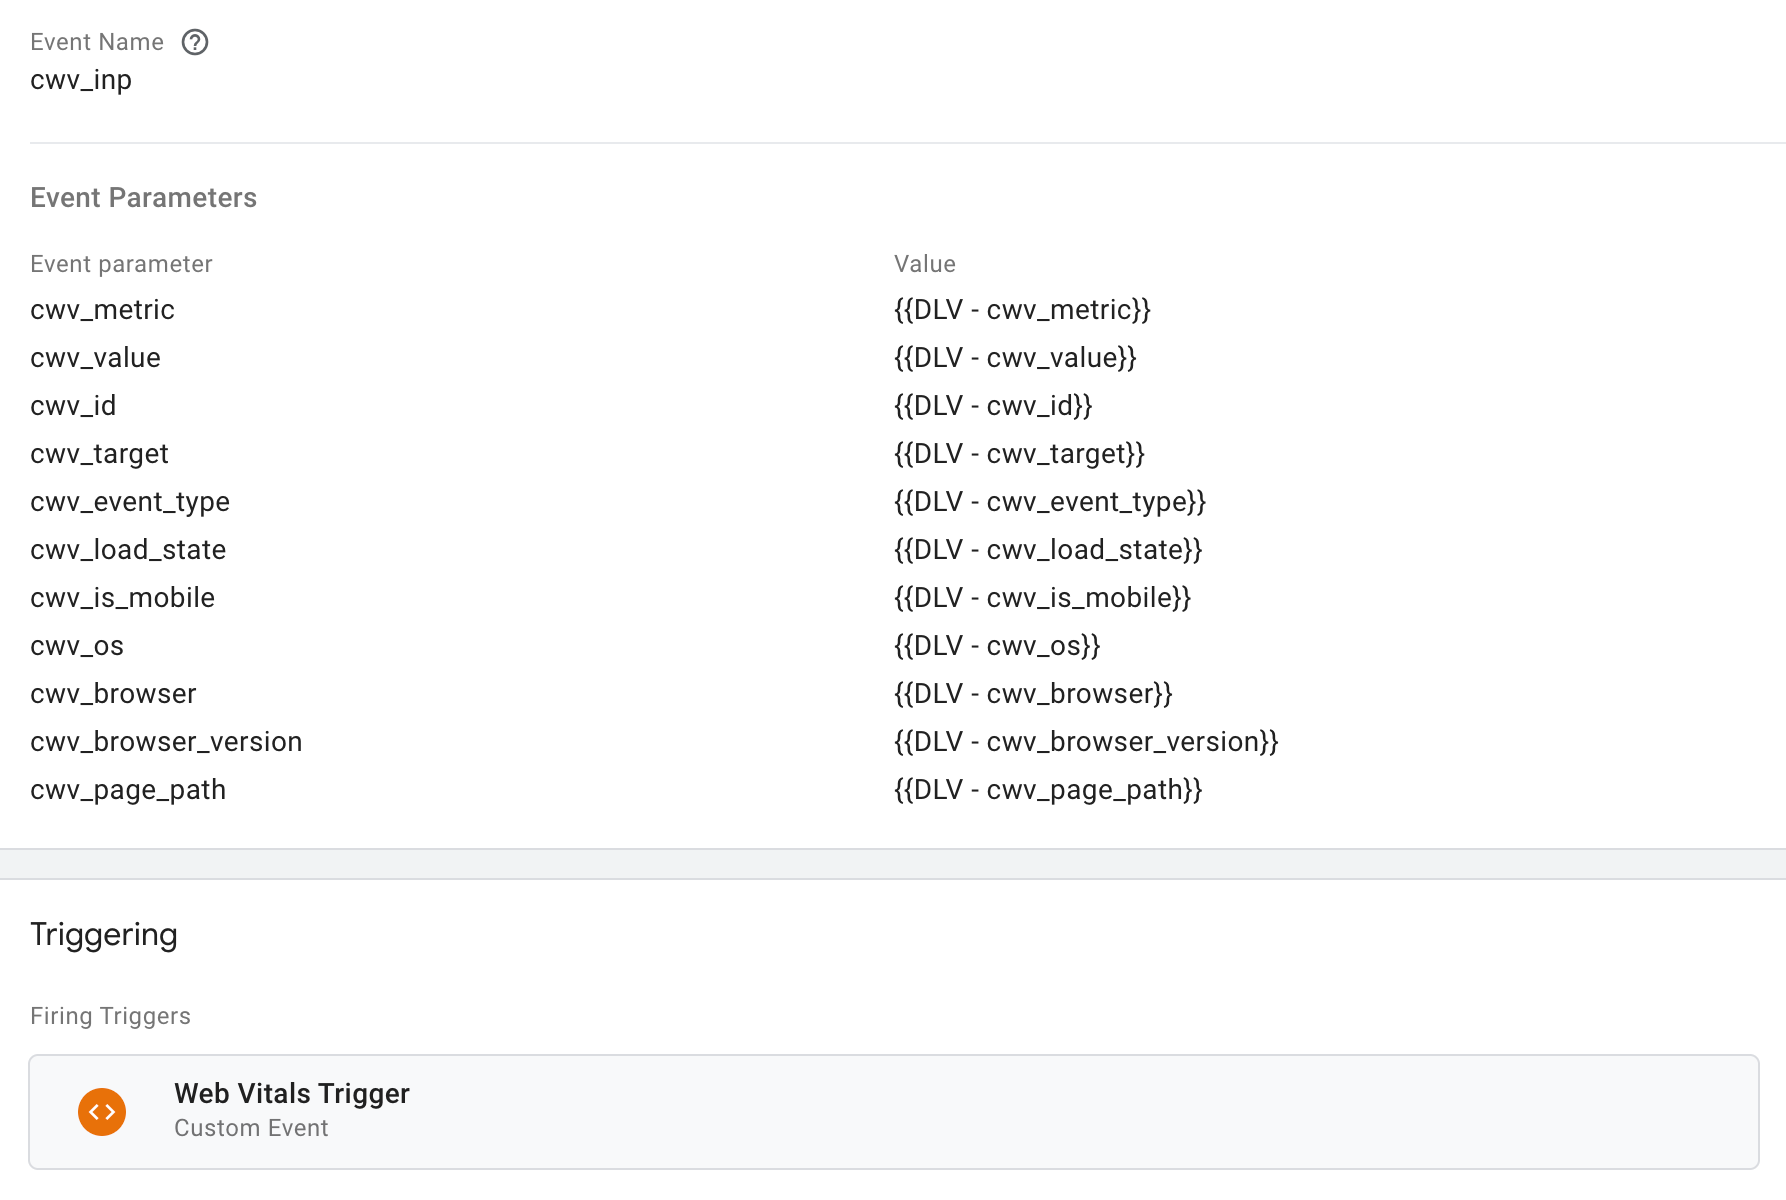
Create a trigger of type Custom Event and event name cwv_inp.
- Tag Creation
Two tags are created, one of type custom HTML & other of type GA4 Event. The custom HTML tag is created to load the web-vital library in the application via GTM and send the data to GA4. This is not a mandatory step. The can be done in the application directly as well.
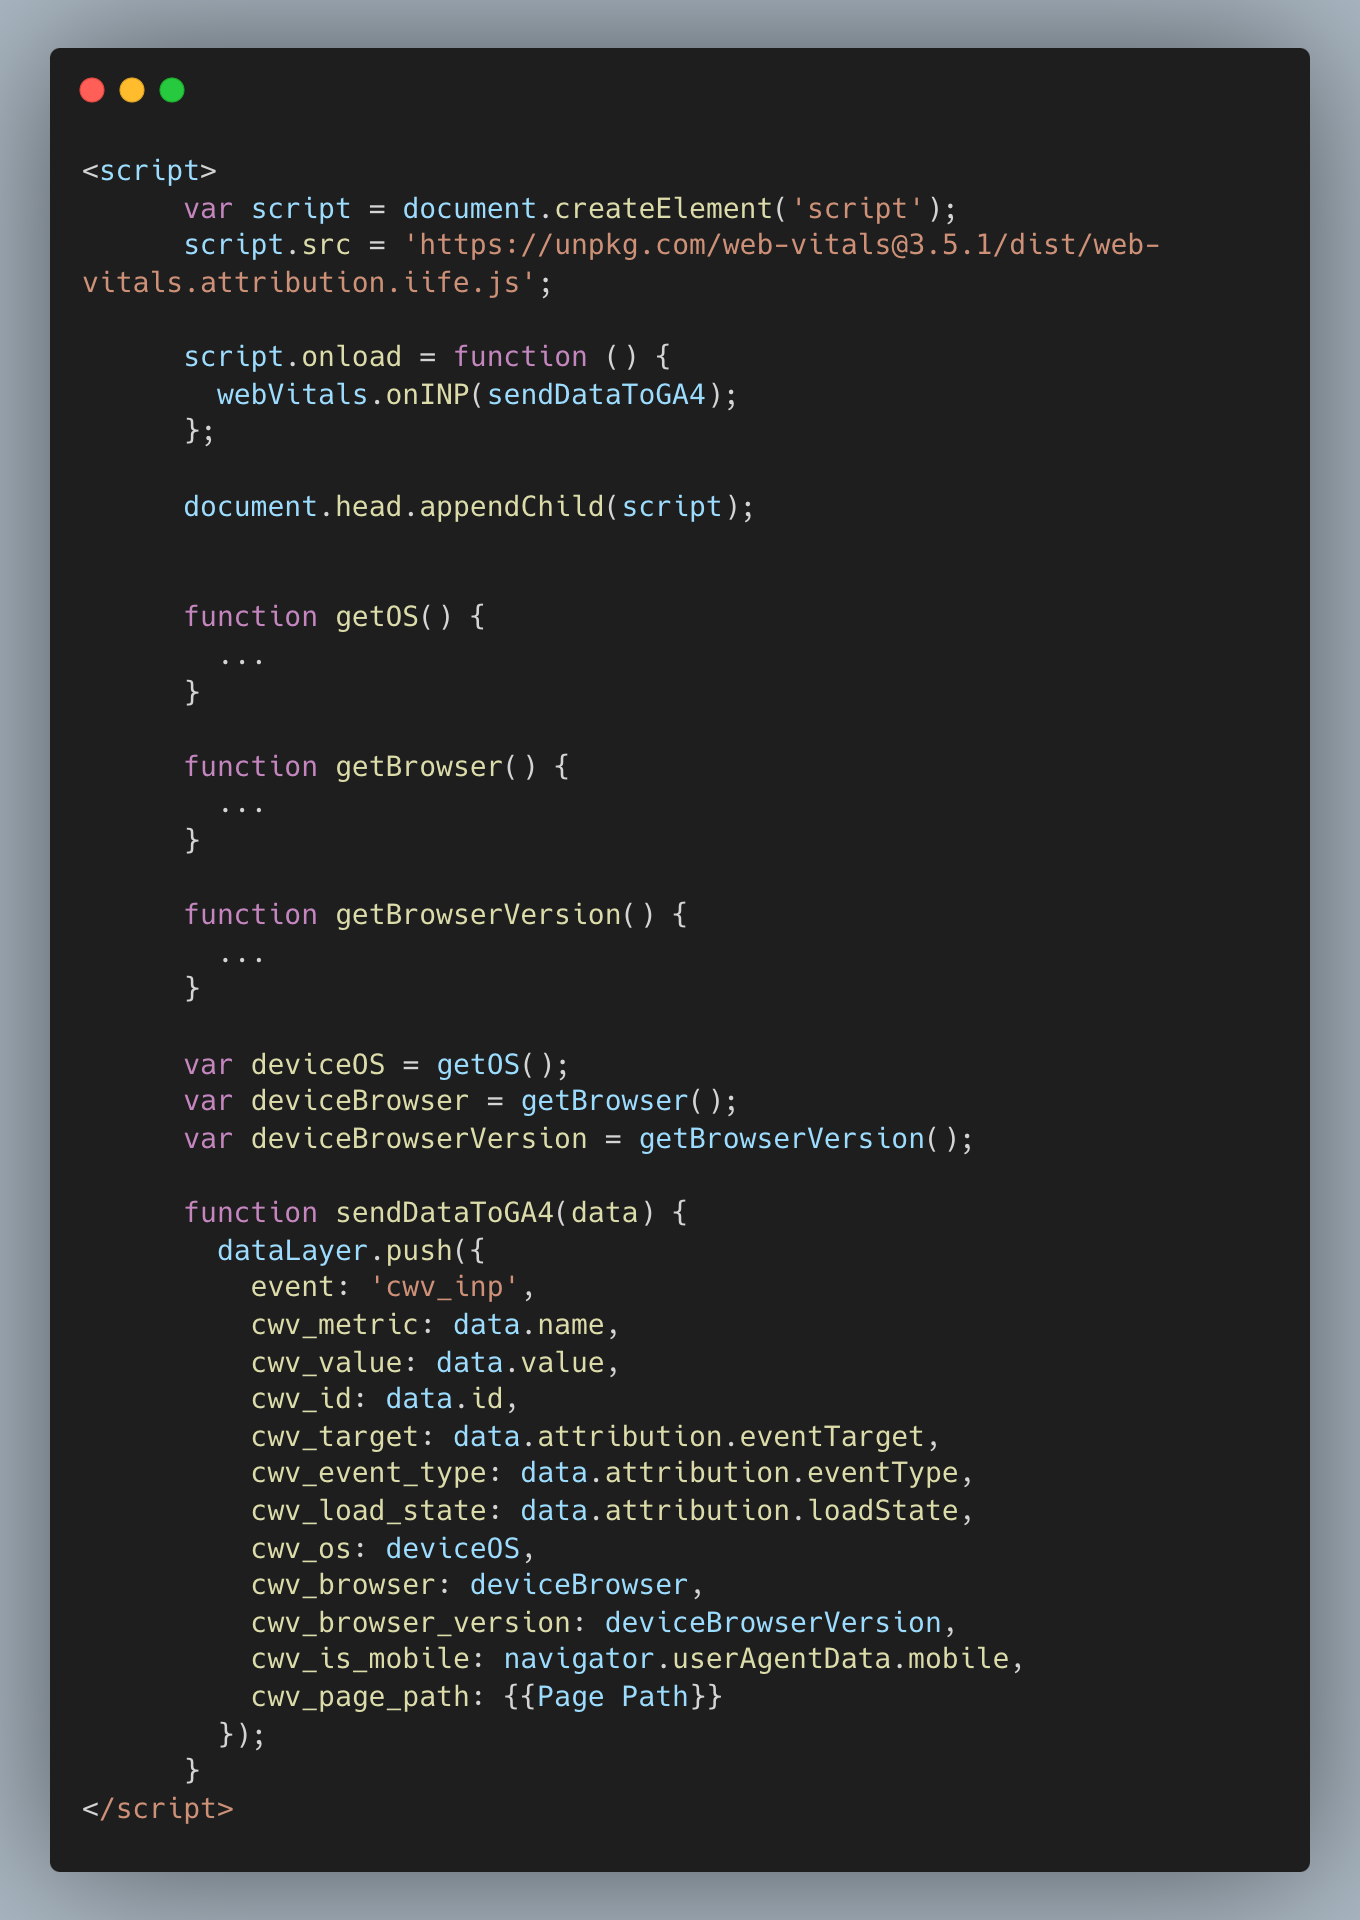
The second tag is created to capture the event parameters for the cwv_inp event. The trigger for this will be the one that we created above.
After this, now we are good to publish the changes in GTM.
BigQuery export setup
BigQuery is a cloud data warehouse that enables running super-fast queries on large datasets. The data received in GA4 is insufficient, hence, we utilize the BigQuery exporting option. With BigQuery, we can export session and hit data from a Universal Analytics reporting View, allowing us to run custom queries against that data.
In our case, we aimed to filter metric data similarly to Google Search Console, focusing on the 75th percentile value for the metric.
Google Analytics provides an option to export data to BigQuery, which can be done continuously throughout the day or once per day.
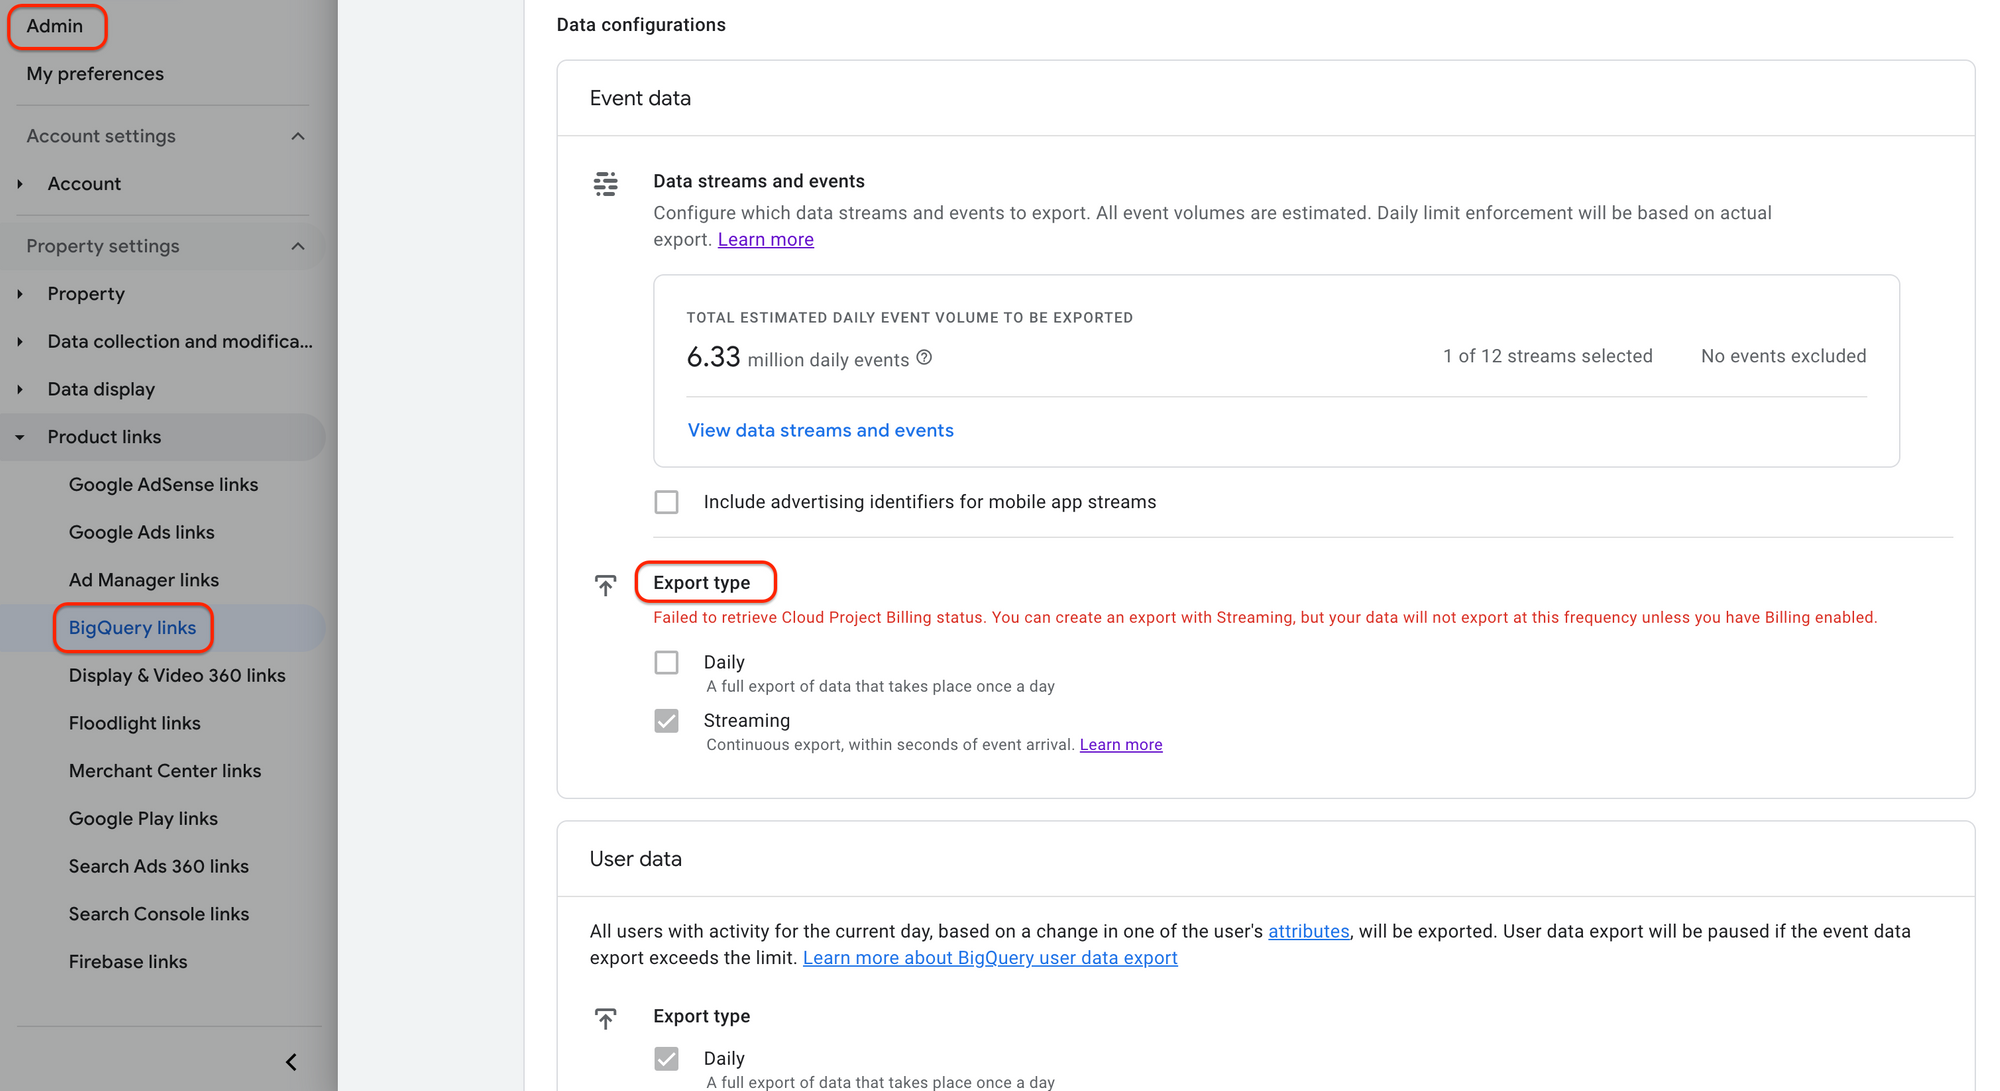
For more detail on how to setup the BigQuery export, please refer this detailed guide.
Once the setup is done, the SQL queries can be run to filter the datasets.
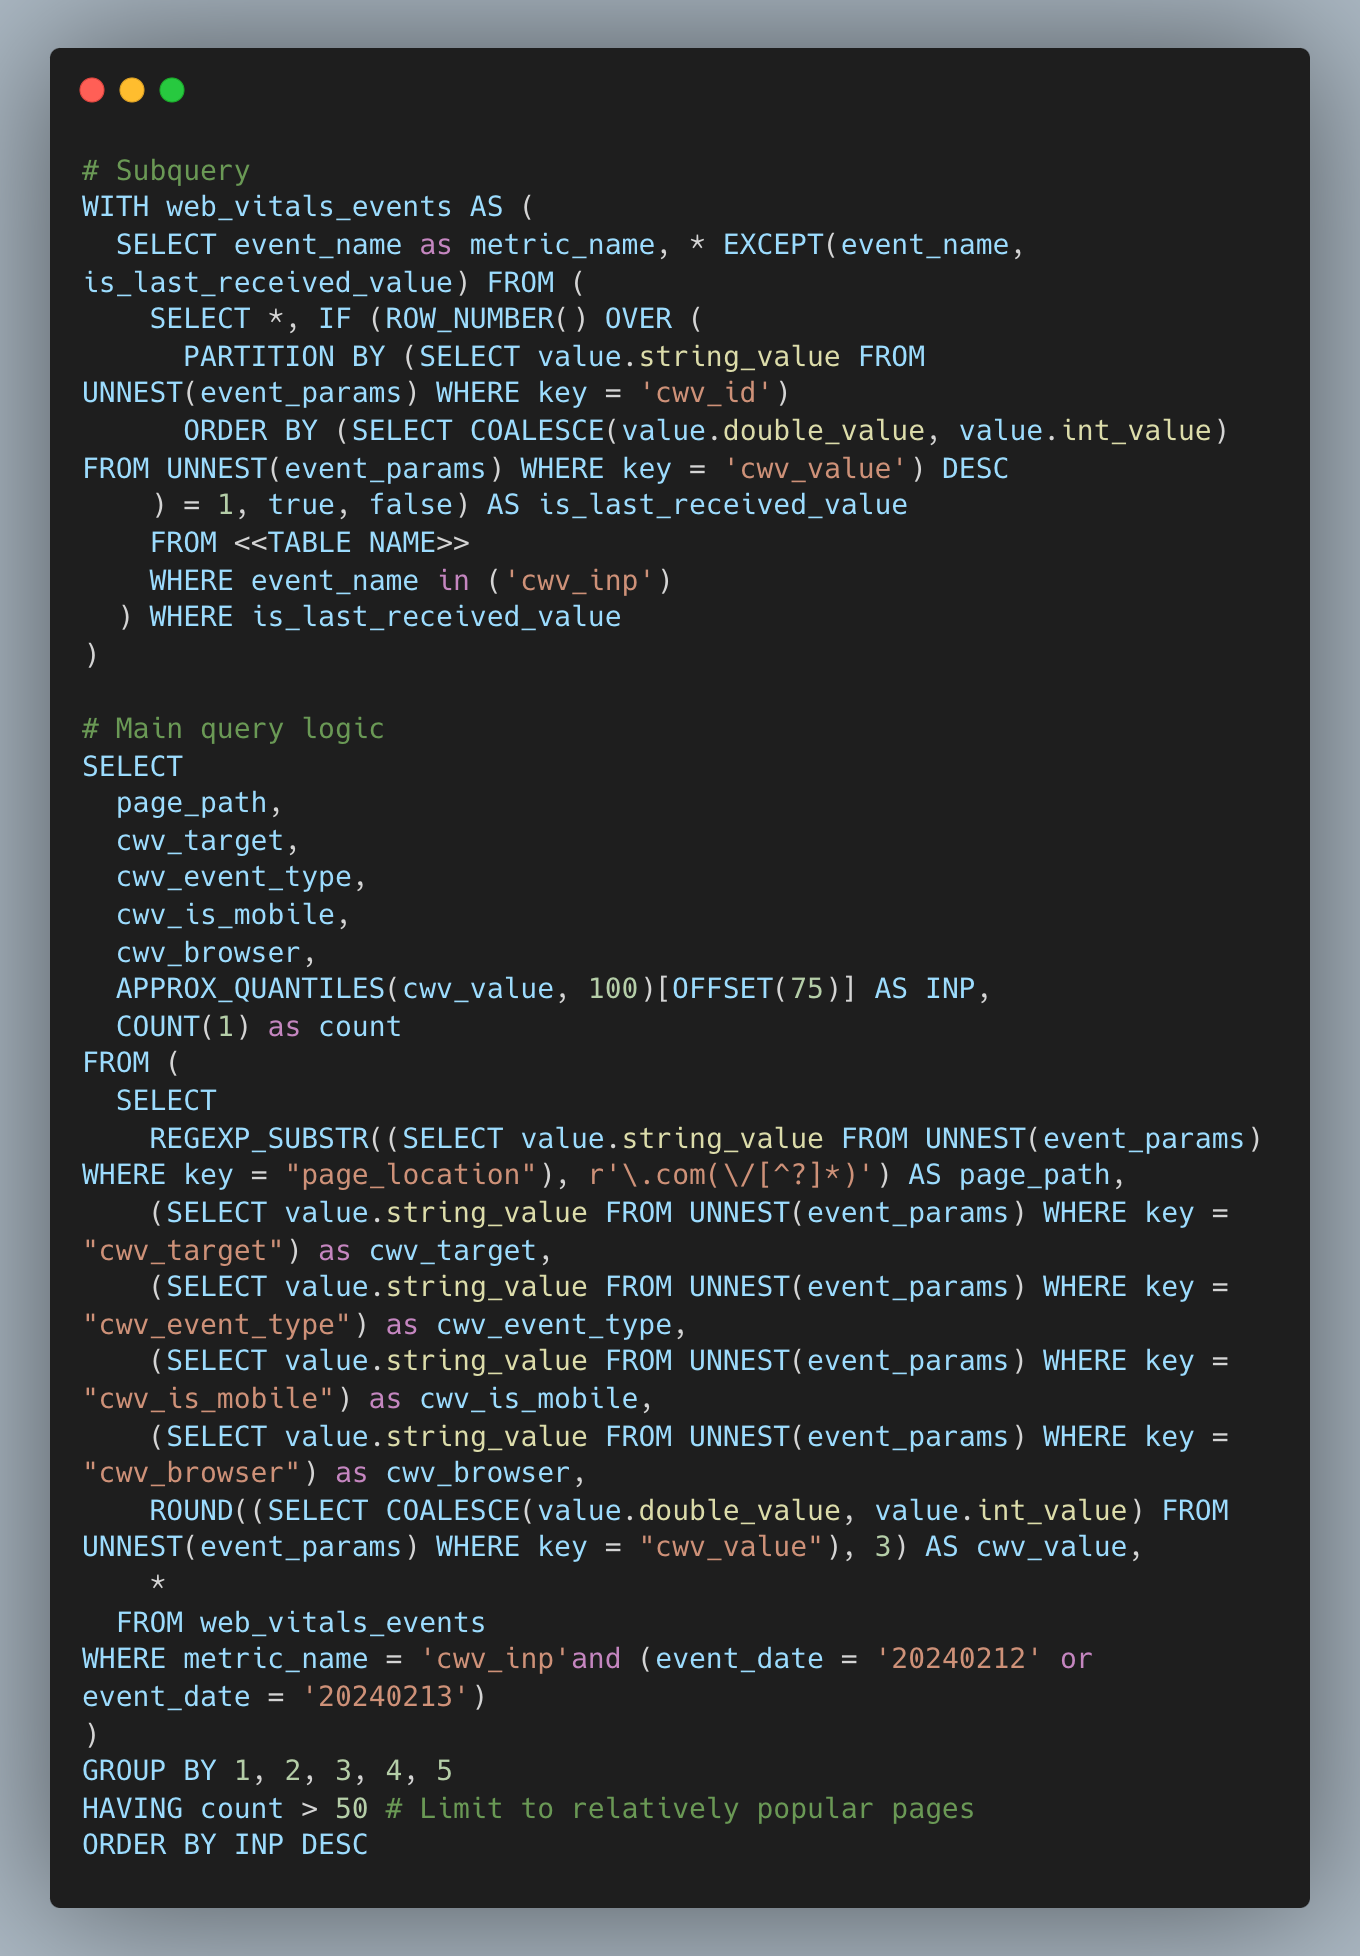
This query analyses INP (Interaction to Next Paint) data from Google Analytics 4 for Feb 12th & 13th. It:
- Gets latest INP values: Filters to the most recent event for each page using
is_last_received_value. - Extracts page details: Isolates relevant info like page path, device, and browser.
- Calculates 75th percentile INP: Groups by page characteristics and finds the INP value representing the slowest 25% of user experiences.
- Focuses on popular pages: Only considers pages with at least 50 visits.
- Sorts by slowest INP: Orders results by the page's 75th percentile INP, prioritising performance bottlenecks.
Essentially, it identifies which pages have the slowest user interactions within the given timeframe, focusing on pages with at least 50 visits (count > 50) for reliable insights.
The result of the query can also be exported as a CSV file for more analysis
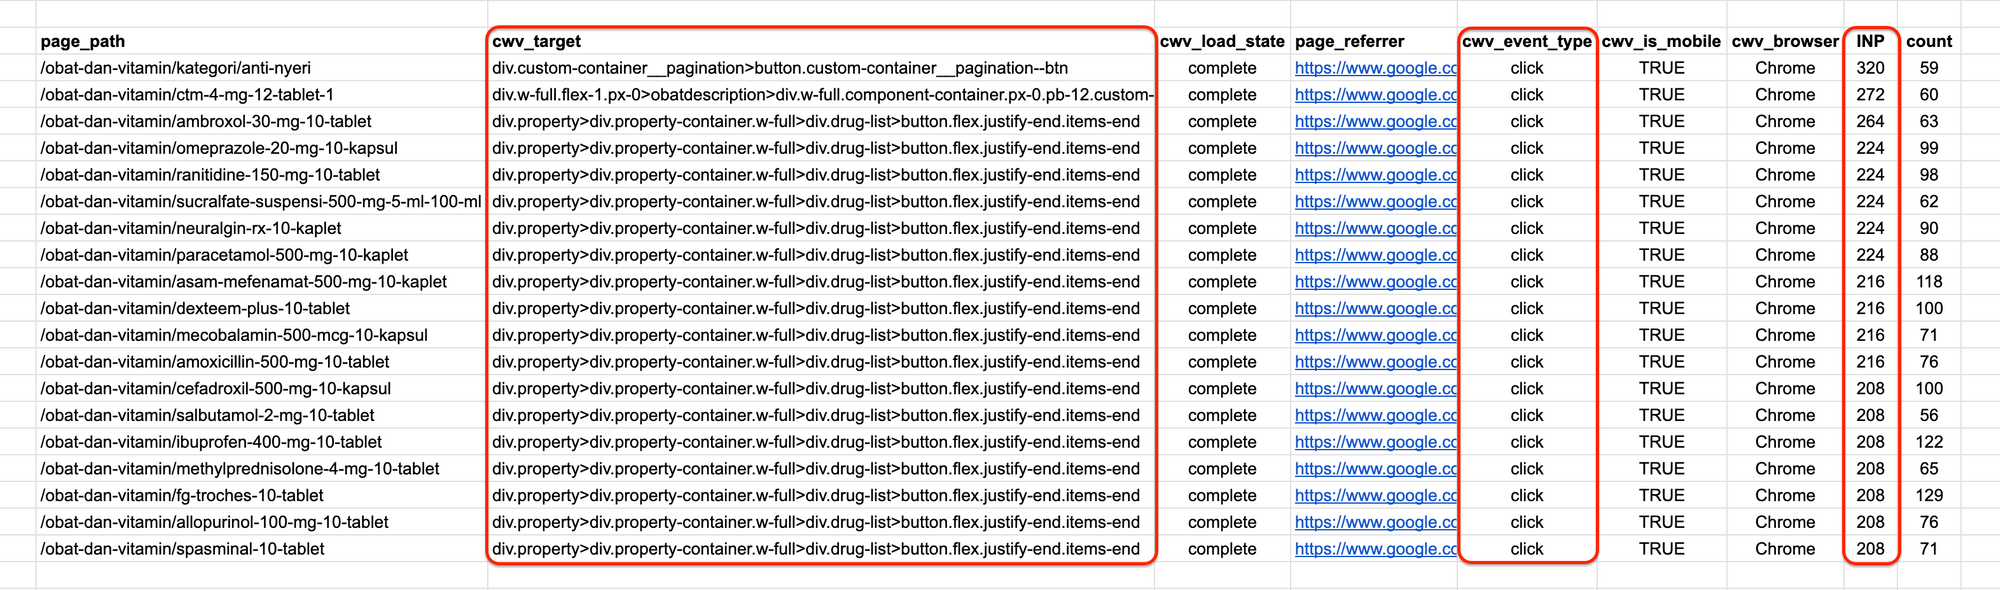
This CSV file contains the target element for a page, responsible for the INP value. With this report file, we can specifically focus on the identified target element and event type, enabling us to debug further and understand the cause of the higher INP value.
BigQuery sandbox
For the above setup, BigQuery can be used without enabling billing, albeit with some limitations. You can leverage BigQuery Sandbox for this purpose, which is a BigQuery-specific initiative designed to provide easy access without requiring credit card information. For more details on how to enable the BigQuery sandbox, please refer to this resource.
Avoid running the SQL query on the entire dataset. Instead, run the query for specific dates to prevent exhausting the quota prematurely.
Conclusion
While tools like WebpageTest and Lighthouse offer valuable insights, they lack real-time INP monitoring and detailed attribution data. This setup enables real-time tracking of INP and other CWVs, identification of problematic elements, and deeper insights into user experience bottlenecks, empowering data-driven optimisation decisions. As a result, it has helped us identify issues early with more detailed insights, eliminating the need to wait for a month to see updates on Google Search Console.
References
Join Us
Scalability, reliability and maintainability are the three pillars that govern what we build at Halodoc Tech. We are actively looking for engineers at all levels and if solving hard problems with challenging requirements is your forte, please reach out to us with your resume at careers.india@halodoc.com.
About Halodoc
Halodoc is the number 1 all around Healthcare application in Indonesia. Our mission is to simplify and bring quality healthcare across Indonesia, from Sabang to Merauke. We connect 20,000+ doctors with patients in need through our Tele-consultation service. We partner with 3500+ pharmacies in 100+ cities to bring medicine to your doorstep. We've also partnered with Indonesia's largest lab provider to provide lab home services, and to top it off we have recently launched a premium appointment service that partners with 500+ hospitals that allow patients to book a doctor appointment inside our application. We are extremely fortunate to be trusted by our investors, such as the Bill & Melinda Gates Foundation, Singtel, UOB Ventures, Allianz, GoJek, Astra, Temasek, and many more. We recently closed our Series D round and in total have raised around USD$100+ million for our mission. Our team works tirelessly to make sure that we create the best healthcare solution personalised for all of our patient's needs, and are continuously on a path to simplify healthcare for Indonesia.