
Performance Testing Using "JMeter"
Now-a-days performance testing is critical because the way organisations' needs are changing. Performance Testing provides relevant information regarding a product’s responsiveness, stability, and scalability to the concerned stakeholders. It also uncovers what needs to be fine-tuned before the product enters the market by analyzing factors like response time and potential mishaps. It allows organizations to proactively identify and manage bottlenecks, bugs, etc.
What is Performance Testing ?
It is a non-functional software testing technique that determines how the stability, speed, scalability, and responsiveness of an application holds up under a given workload.
Types Of Performance Testing:
There are 5 main types of performance testing.
- Load Testing
- Capacity Testing
- Volume Testing
- Stress Testing
- Soak Testing
Load Testing: Confirms that the system can handle the required number of users and still operate at a high level of performance. This ensures that there is no day to day issues in performance. Load Test of Apis are great example of performance testing. APIs are the foundation of software businesses. Since they’re consumed by multiple parties, they have a variable load that can be difficult to predict, and downtime can be extremely costly. Rising user expectations means that APIs must be extremely performant and should not become a bottleneck for the web, mobile, or third-party applications consuming them.Load testing is a great way to minimise performance risks, because it ensures an API can handle an expected load. By simulating traffic to an API in development, businesses can identify bottlenecks before they reach production environments. How to Analyse Api which requires performance Testing and how much load we need to setUp, you can refer this blog Performance Testing and Right Sizing
Capacity Testing: Tests how many users the system can handle before performance dips below acceptable levels. By testing a software’s capacity it helps developers anticipate issues in terms of scalability and future user-base growth.
Volume Testing: Checks that the software can handle and process a large amount of data at once without breaking, slowing down, or losing any information.
Stress Testing: Intentionally tries to break the software by simulating a number of users that greatly exceeds expectations.
Soak Testing: Simulates high traffic for an extended period of time. Checks the software’s ability to tolerate extended periods of high traffic.Free Health check up from Halodoc app is a good example of a soak test in the real world, when sudden spike in user traffic on the Halodoc website/Apis arise.
Why JMeter for Performance Testing ?
JMeter is open source tool and simple to use. By using JMeter we can simply analyze how much load a website can hold. it can be used to test the performance of both static resources such as JavaScript and HTML, as well as dynamic resources, such as JSP, Servlets, and AJAX. JMeter provides a variety of graphical analyses of performance reports.These are the main features of JMeter.
Features Of JMeter
- It is open source software for testing and also free of cost.
- It is a completely multithreading framework that allows concurrent sampling by many threads.
- It has a simple GUI. So, that user can use it easily. Hence, the user can run on any platform
- It is Platform independent.
- It has full Swing and lightweight component support.
- Users can also generate a test plan by using a text editor.
- Users can customize JMeter as per the requirement. Hence, Save the effort of executing test cases manually.
- It is also known as all in one tool, We can do both functional and non-functional testing by using the JMeter tool.
- It supports various protocols like HTTP, FTP, SOAP, JDBC, JMS, and LDAP. We can also use the tool for testing the performance of your database.
Some common performance bottlenecks are,
- CPU utilization
- Memory utilization
- Operating System limitations
- Disk usage
- Network utilization
Let’s take a deep dive into JMeter:
Here first we will tell how to start JMeter and we will take one Api as example and do performance testing of the same and generate report using JMeter. you can refer this to know more about API.
Steps to start JMeter:
- Install the latest 64-bit JRE or JDK. This is needed as JMeter is a pure Java application.
- The latest version of JMeter is Apache JMeter 5.5. You can download it here https://jmeter.apache.org/download_jmeter.cgi
- Unzip the zip/tar file into the directory where you want JMeter to be installed.
- To start JMeter go to /bin directory
- For Mac/Linux/Unix: ./jmeter.sh
- For Windows: jmeter.bat
JMeter Elements:
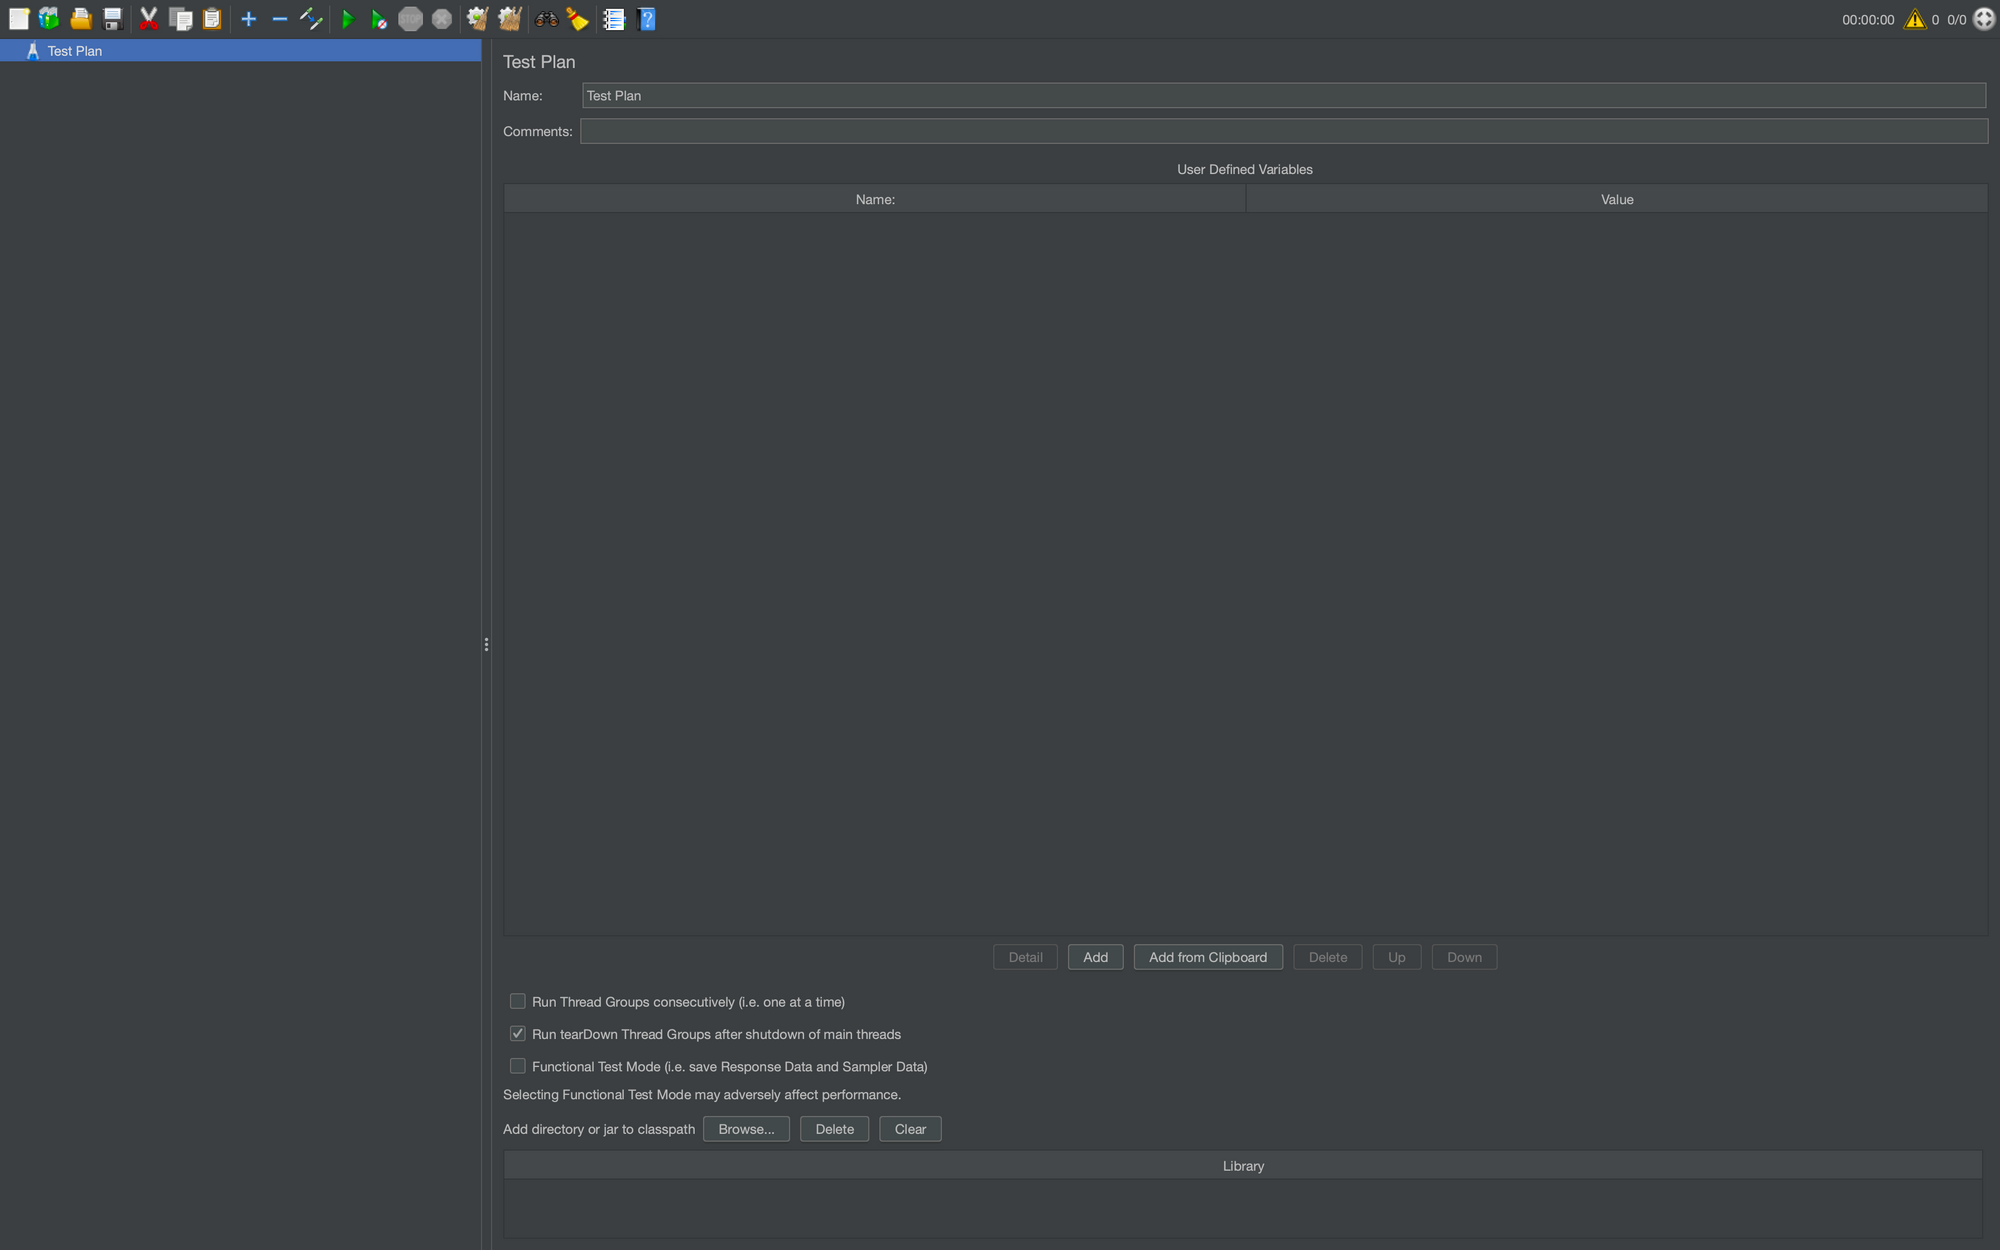
JMeter Test Plan: A test plan describes a series of steps JMeter will execute when run. A complete test plan will consist of one or more Thread Groups, Logic Controllers, Sample Generating Controllers, Listeners, Timers, Assertions, and Configuration Elements.
Thread Group: Thread Groups is a collection of Threads. Each thread represents one user using the application under test. Basically, each Thread simulates one real user request to the server.
For example, if you set the number of threads as 100. JMeter will create and simulate 100 user requests to the server under test.
How to add ThreadGroup: Right Click on Test Plan-> Hover over Threads(Users)-> Click Thread Group
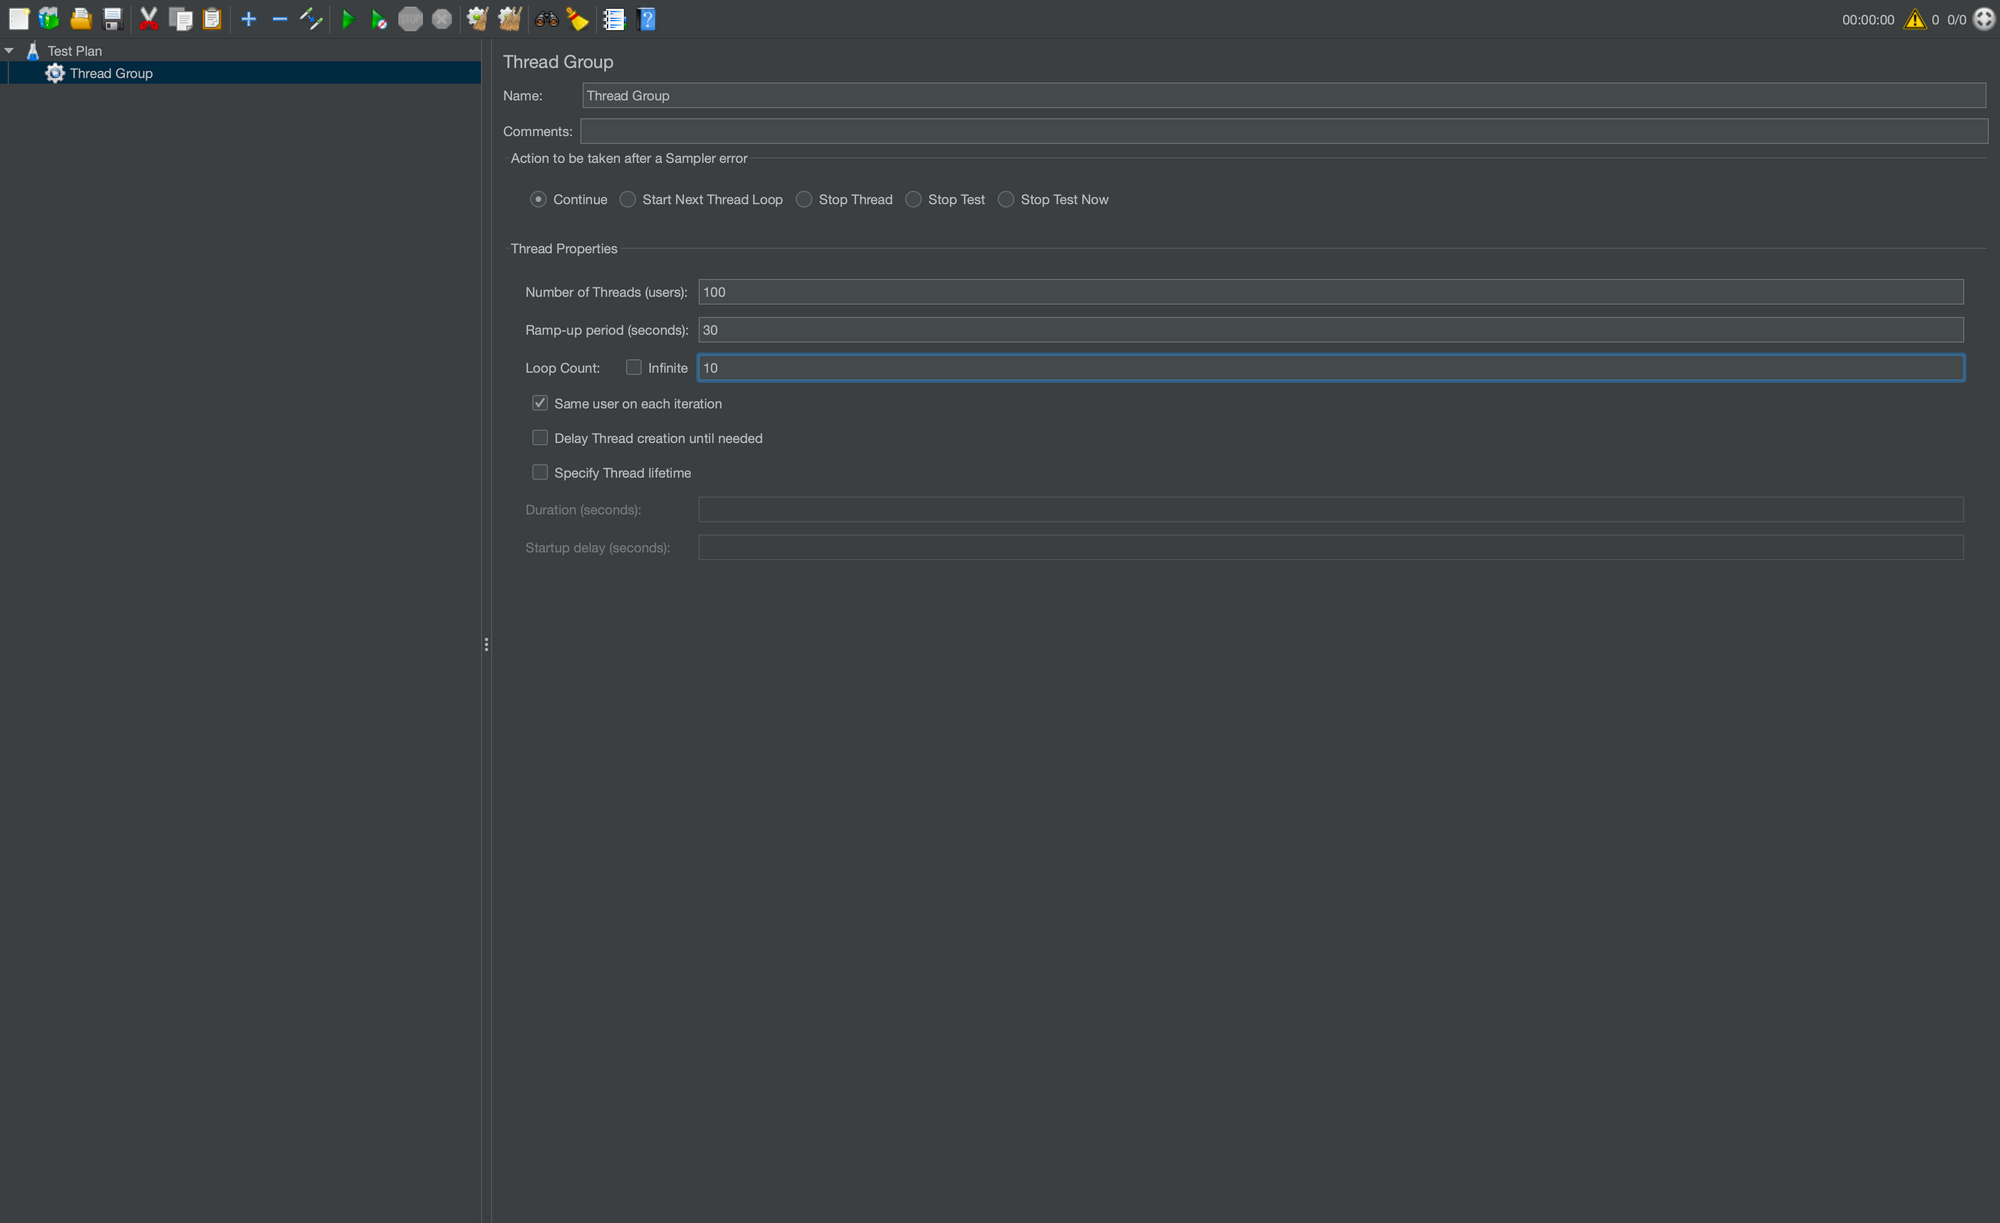
Let’s explore the Thread Group options:
- Number Of Threads: It represents the total number of virtual users performing the test script execution.
- Ramp-Up Period (in seconds): It tells JMeter how long it takes to reach the full number of threads. For example, if you have 100 users with a ramp-up period of 30 seconds, JMeter will take 30 seconds to get all 100 threads running.
- Loop Count: It is the number of executions for the script. For example, if the loop count is 10 and the number of threads is 100 then the script will run 1000 times. If the loop count is set “forever” then new threads will keep starting until the tests are stopped.
Samplers: Samplers allow JMeter to send different types of requests to a server.
How to add Samplers: Right Click on Thread Group -> Hover over Add -> Hover Over Sampler -> Click on the required Sampler(HTTP Request)
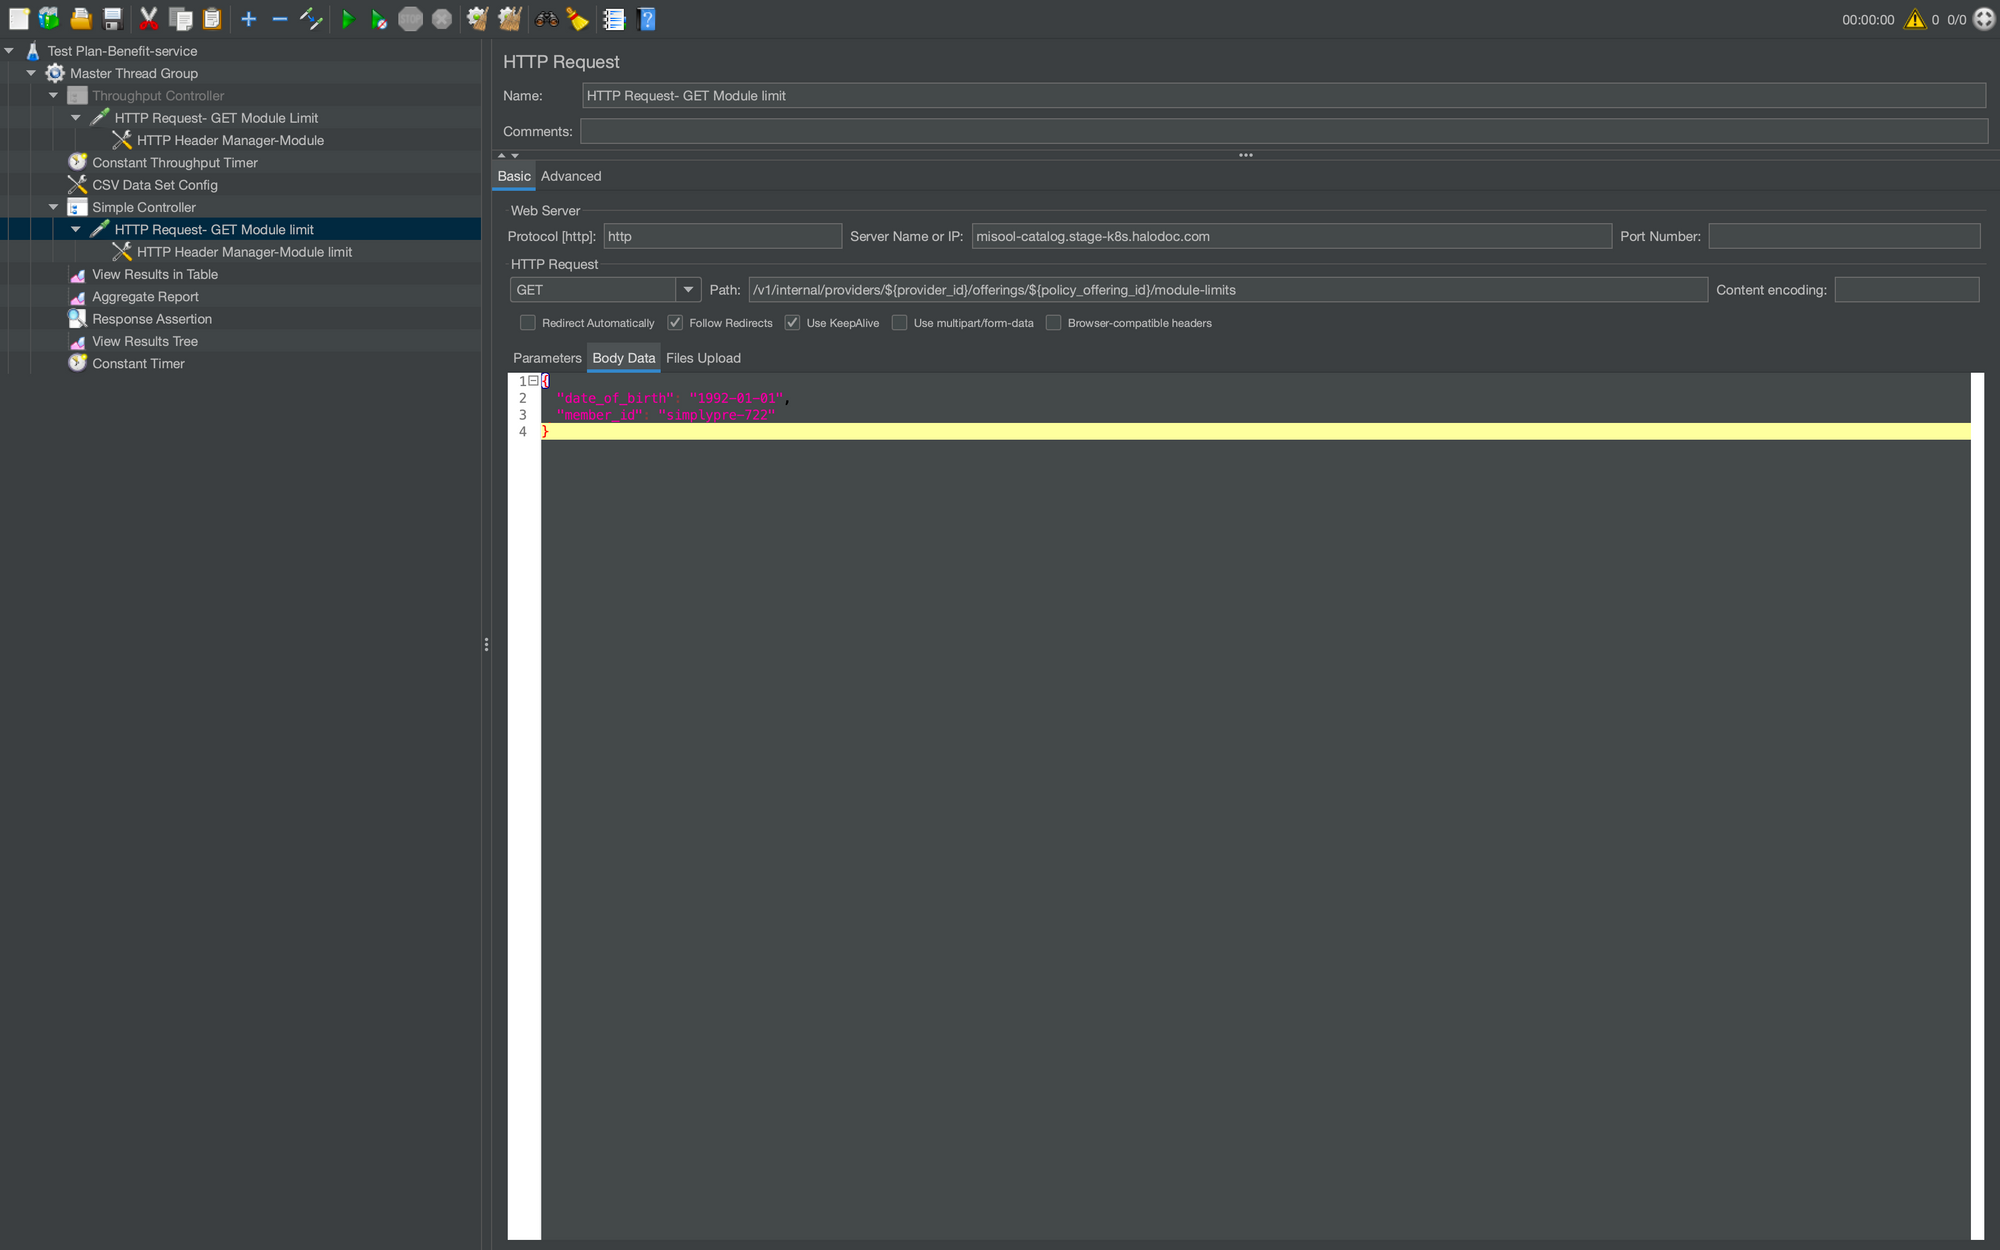
Name: Any logical name in order to distinguish your request.
Protocol: It mentions the protocol used for example HTTP or HTTPS.
Server Name: This is the domain name of the server
Method: Any of the methods such as GET, PUT, POST, DELETE, etc may be selected from the drop-down.
Path: This is the path of the resource. For example “/v1/internal/providers/${provider_id}/offerings/${policy_offering_id}/module-limits”.
here, ${provider_id}/${policy_offering_id} is used for taking dynamic test data from CSV data file.
Parameters: Any parameters that are required to be passed will be added in this section.
Body Data: This comes into the picture if any JSON, XML, etc needs to be passed in the request. That is added to Body Data.
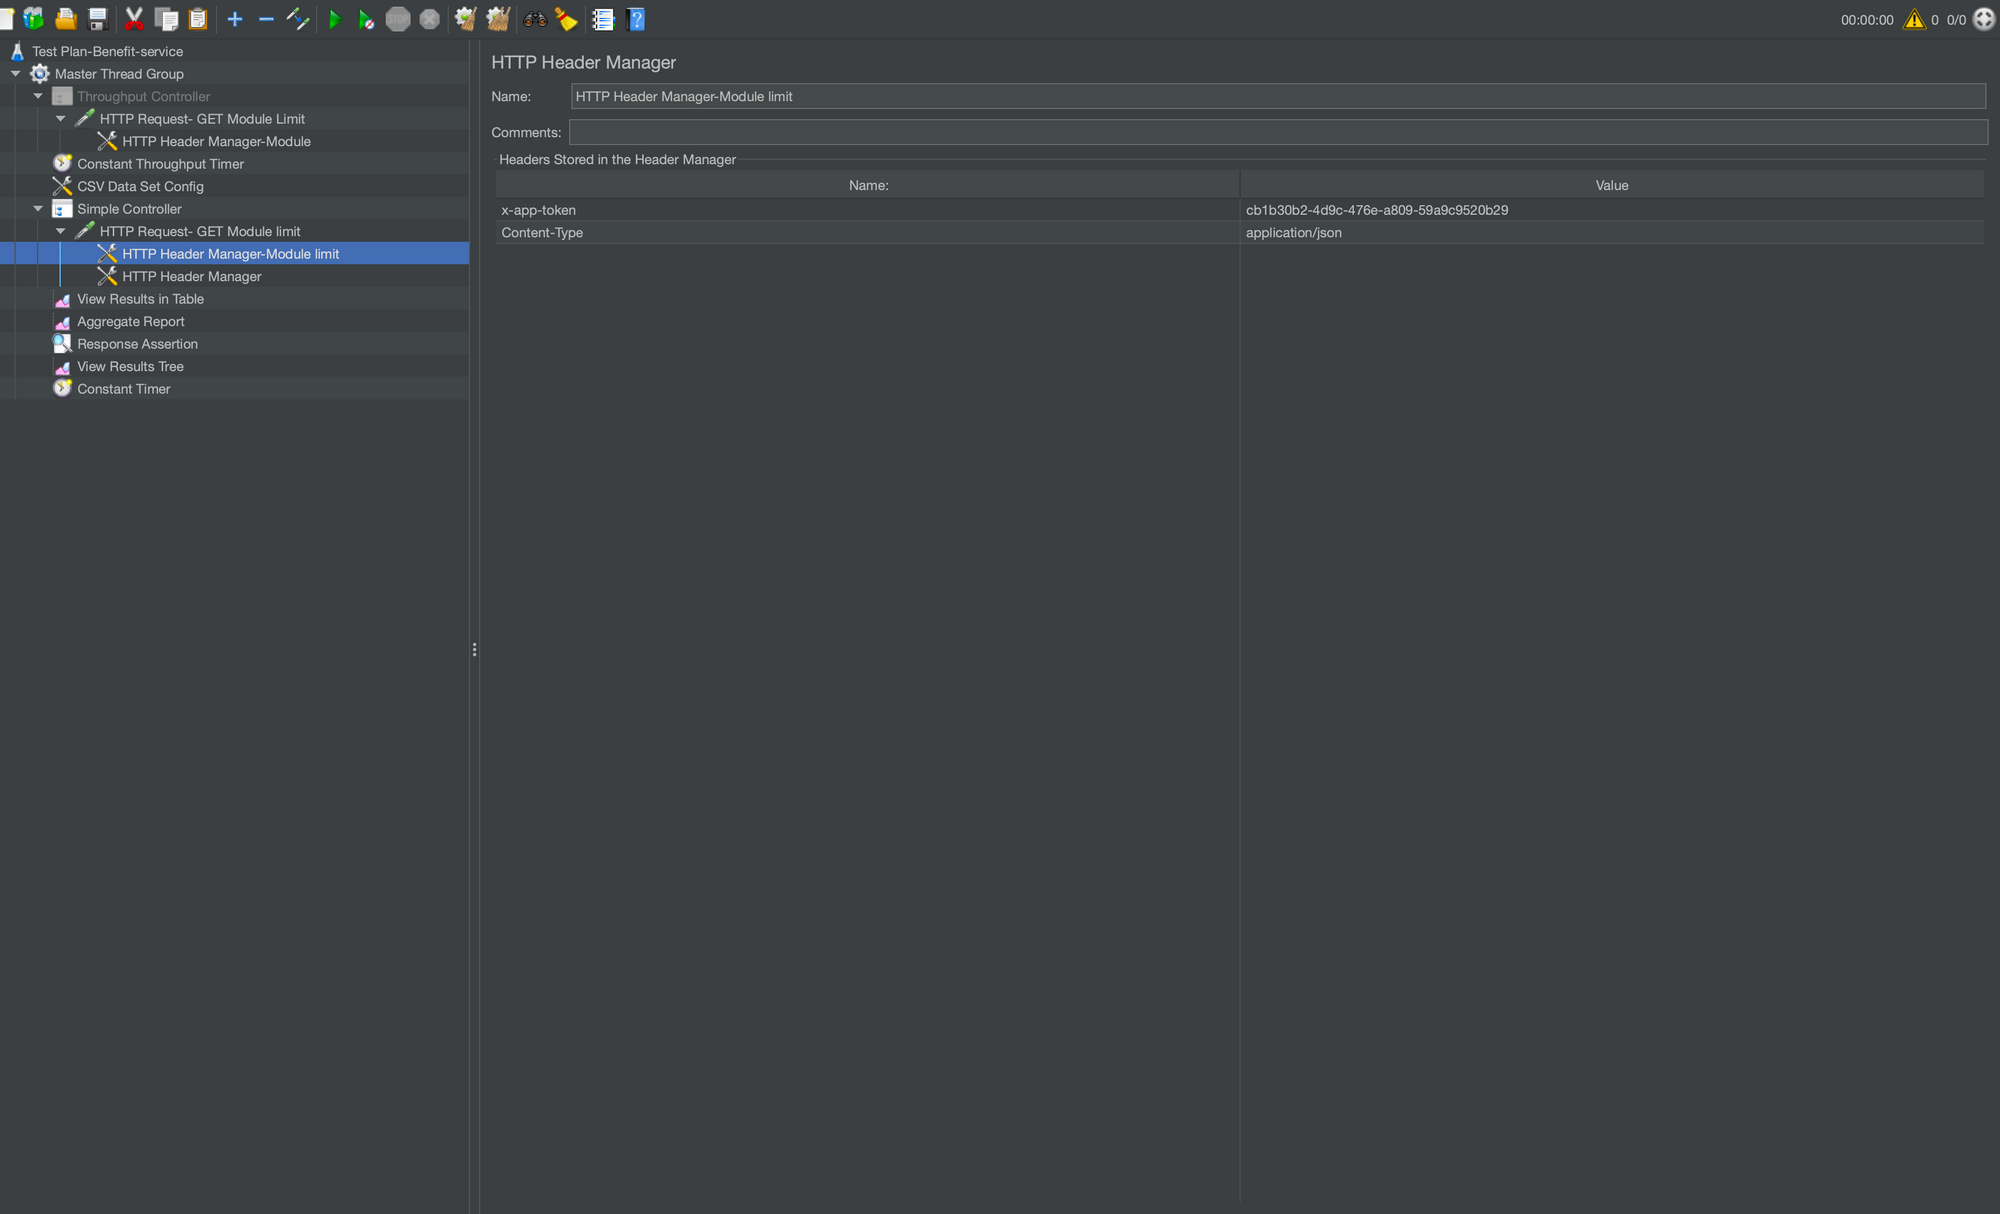
HTTP Header Manager: If you are going to send multiple requests to the same web server, consider using an HTTP Header Manager Configuration Element so you do not have to enter the same information for each HTTP Request. For example you can add app-token, content-type etc.
How to add : Right Click on either of Test Plan/Thread Group/Logic Controller -> Hover over Add -> Hover Over Config Element -> Click on the HTTP Header Manager
Logic Controllers: Logic Controllers will decide “When & How” to send a request to a server.We can use multiple logic controller based on our request configuration.
How to add: Right Click on Thread Group -> Hover over Add -> Hover Over Logic Controllers -> Click on the required Logic Controllers(Throughput Controller)
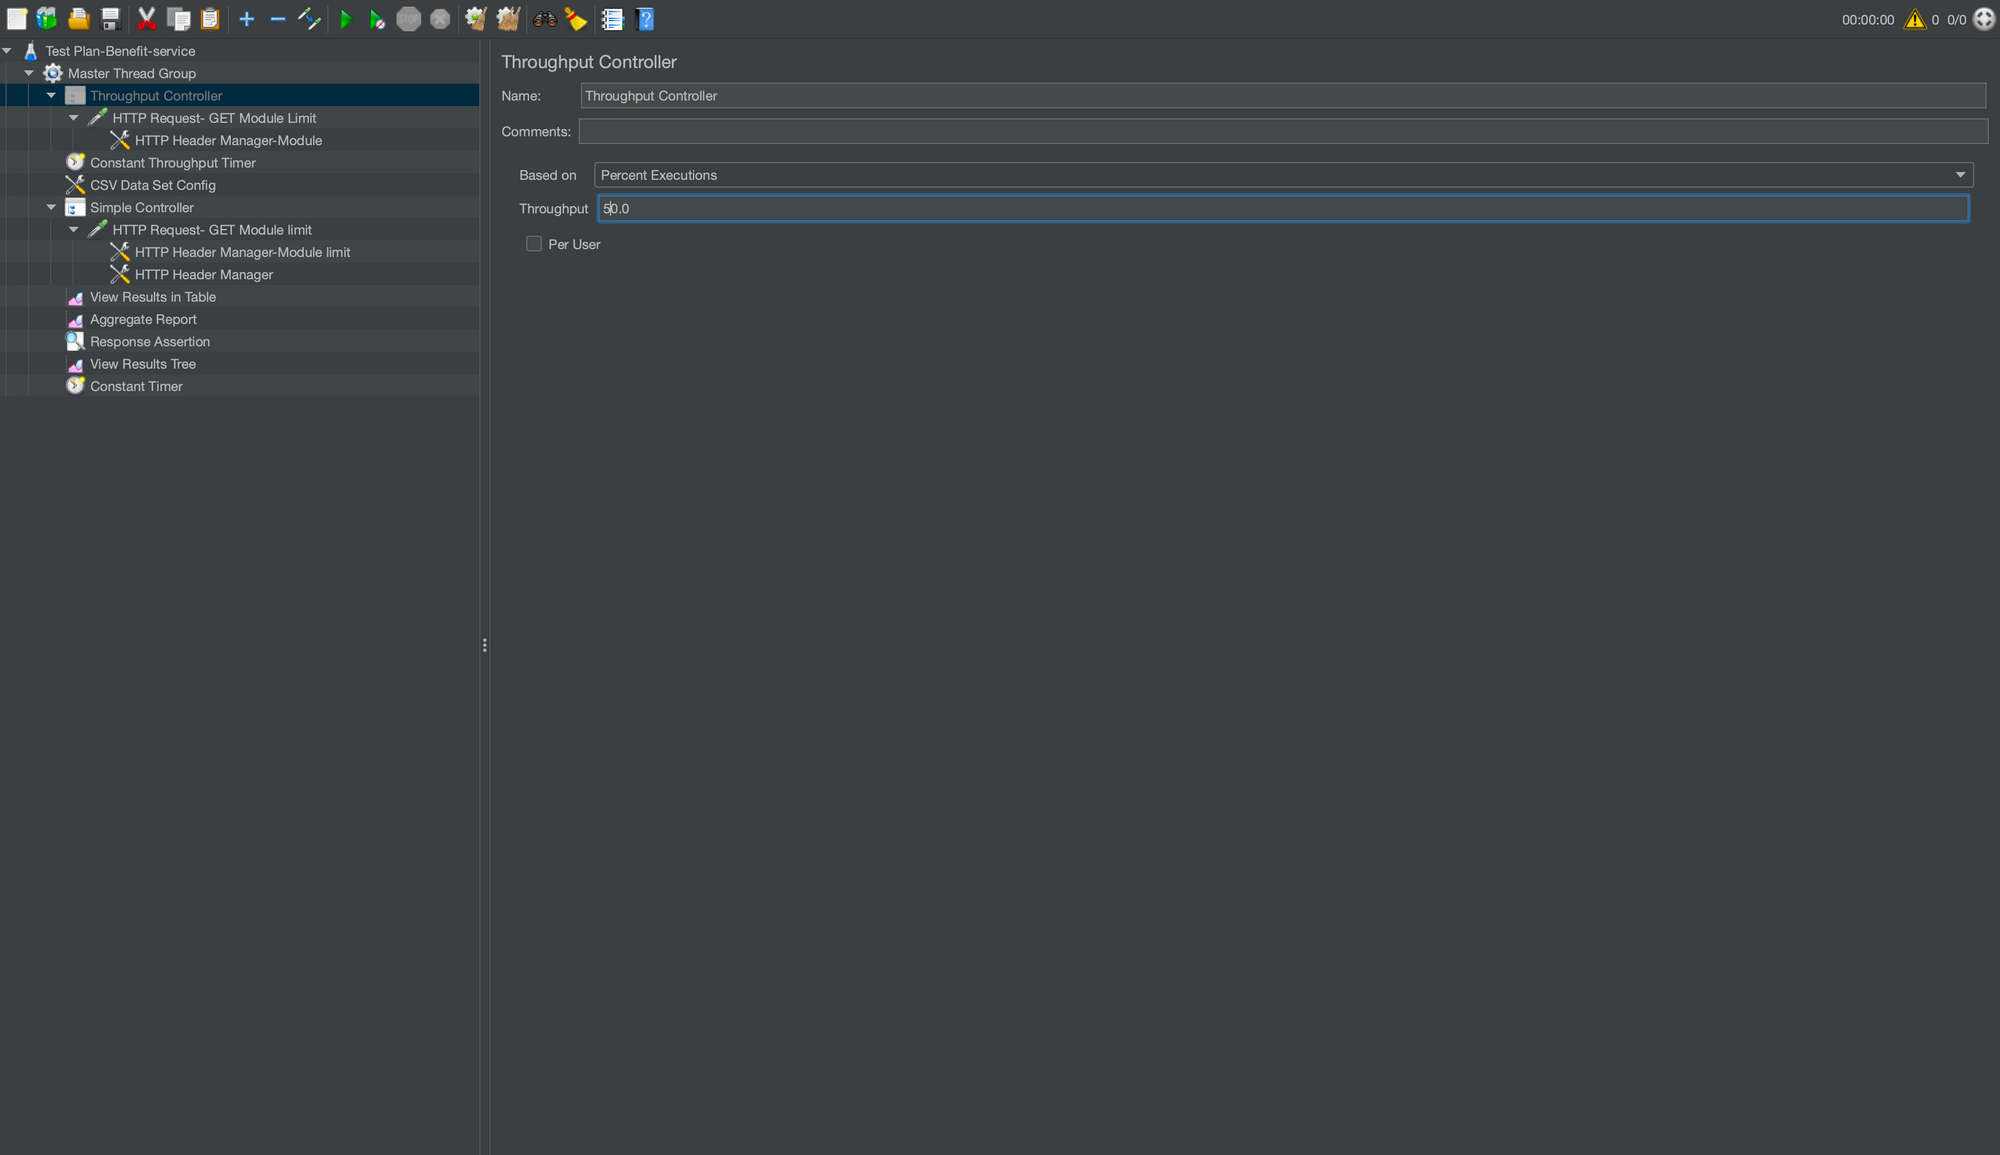
Throughput Controller: Throughput controller basically controls the execution amount for its child requests. For example, in a script where a request is going to be called 100 times in total, it can be reduced up to 50 times with a throughput controller that has a 50% execution parameter.
Assertions: An assertion in JMeter is used to validate the response of the request that you have sent to the server.we can add different type of assertions as Response code,Text Response,Response message etc and according to that we can set pattern to test data.
How to add Assertions: Right Click on either of Test Plan/Thread Group -> Hover over Add -> Hover Over Add element-> Click on theAssertion Assertions
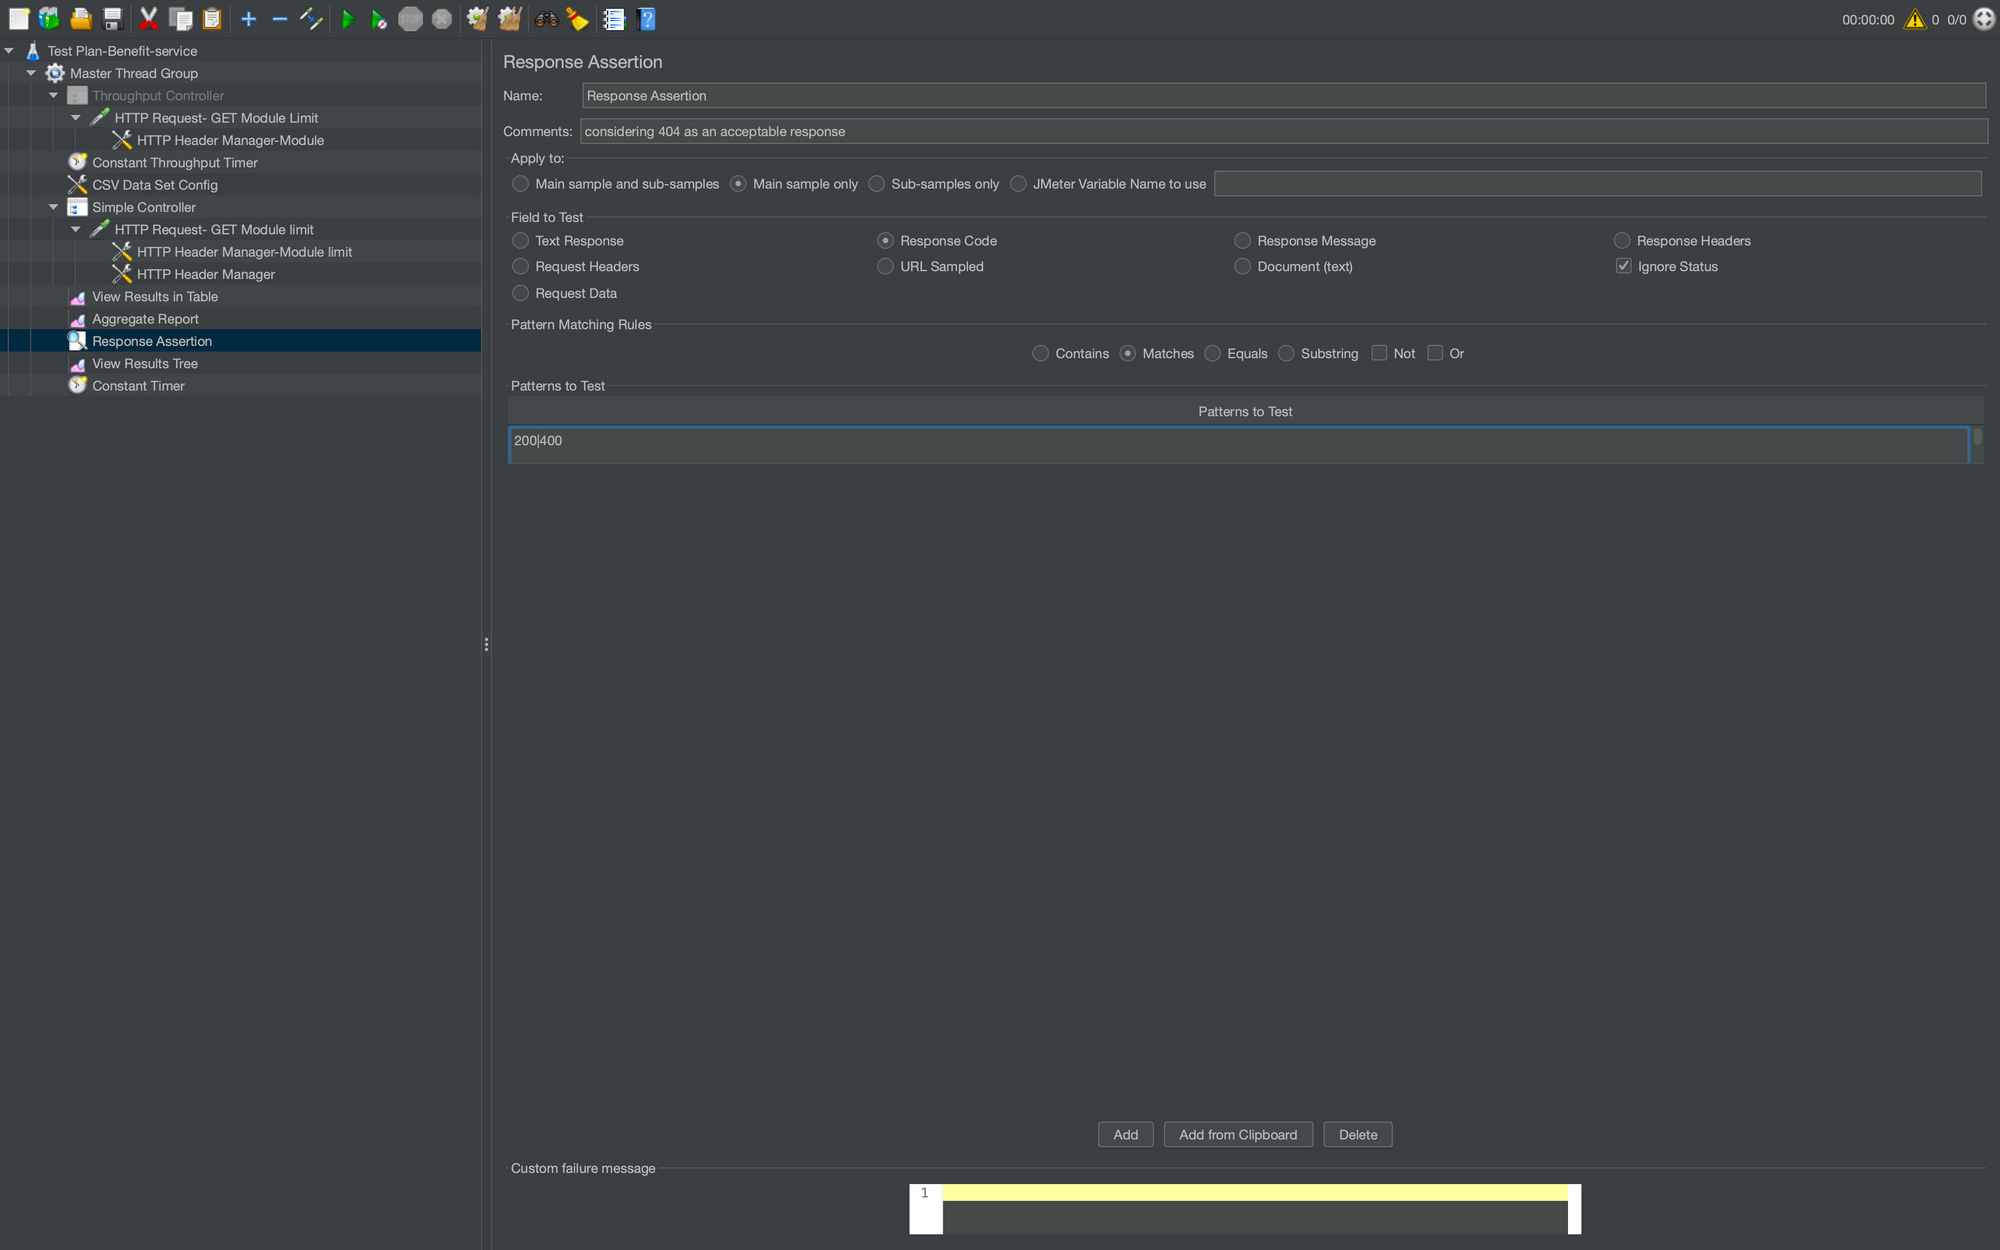
Here we have set Assertion as Response Code and pattern value as 200 or 400 means it pass test cases if response code is 200/400 else it comes under failed cases.
Timers: Timers allow JMeter to delay between each request that a thread makes. A timer can solve the server overload problem.
How to add Timer: Right Click on Thread Group -> Hover over Add -> Hover Over Timer -> Click on the required Timer

Here Constant Timer delays each user request for the same amount of time. If there are no timers, JMeter will send the next request in fractions of seconds.
Configuration Elements: Configuration Element enables us to declare variables, so Samplers can use data through these variables.
How to add a Config element: Right Click on either of Test Plan/Thread Group/Logic Controller -> Hover over Add -> Hover Over Config Element -> Click on the required Config Element
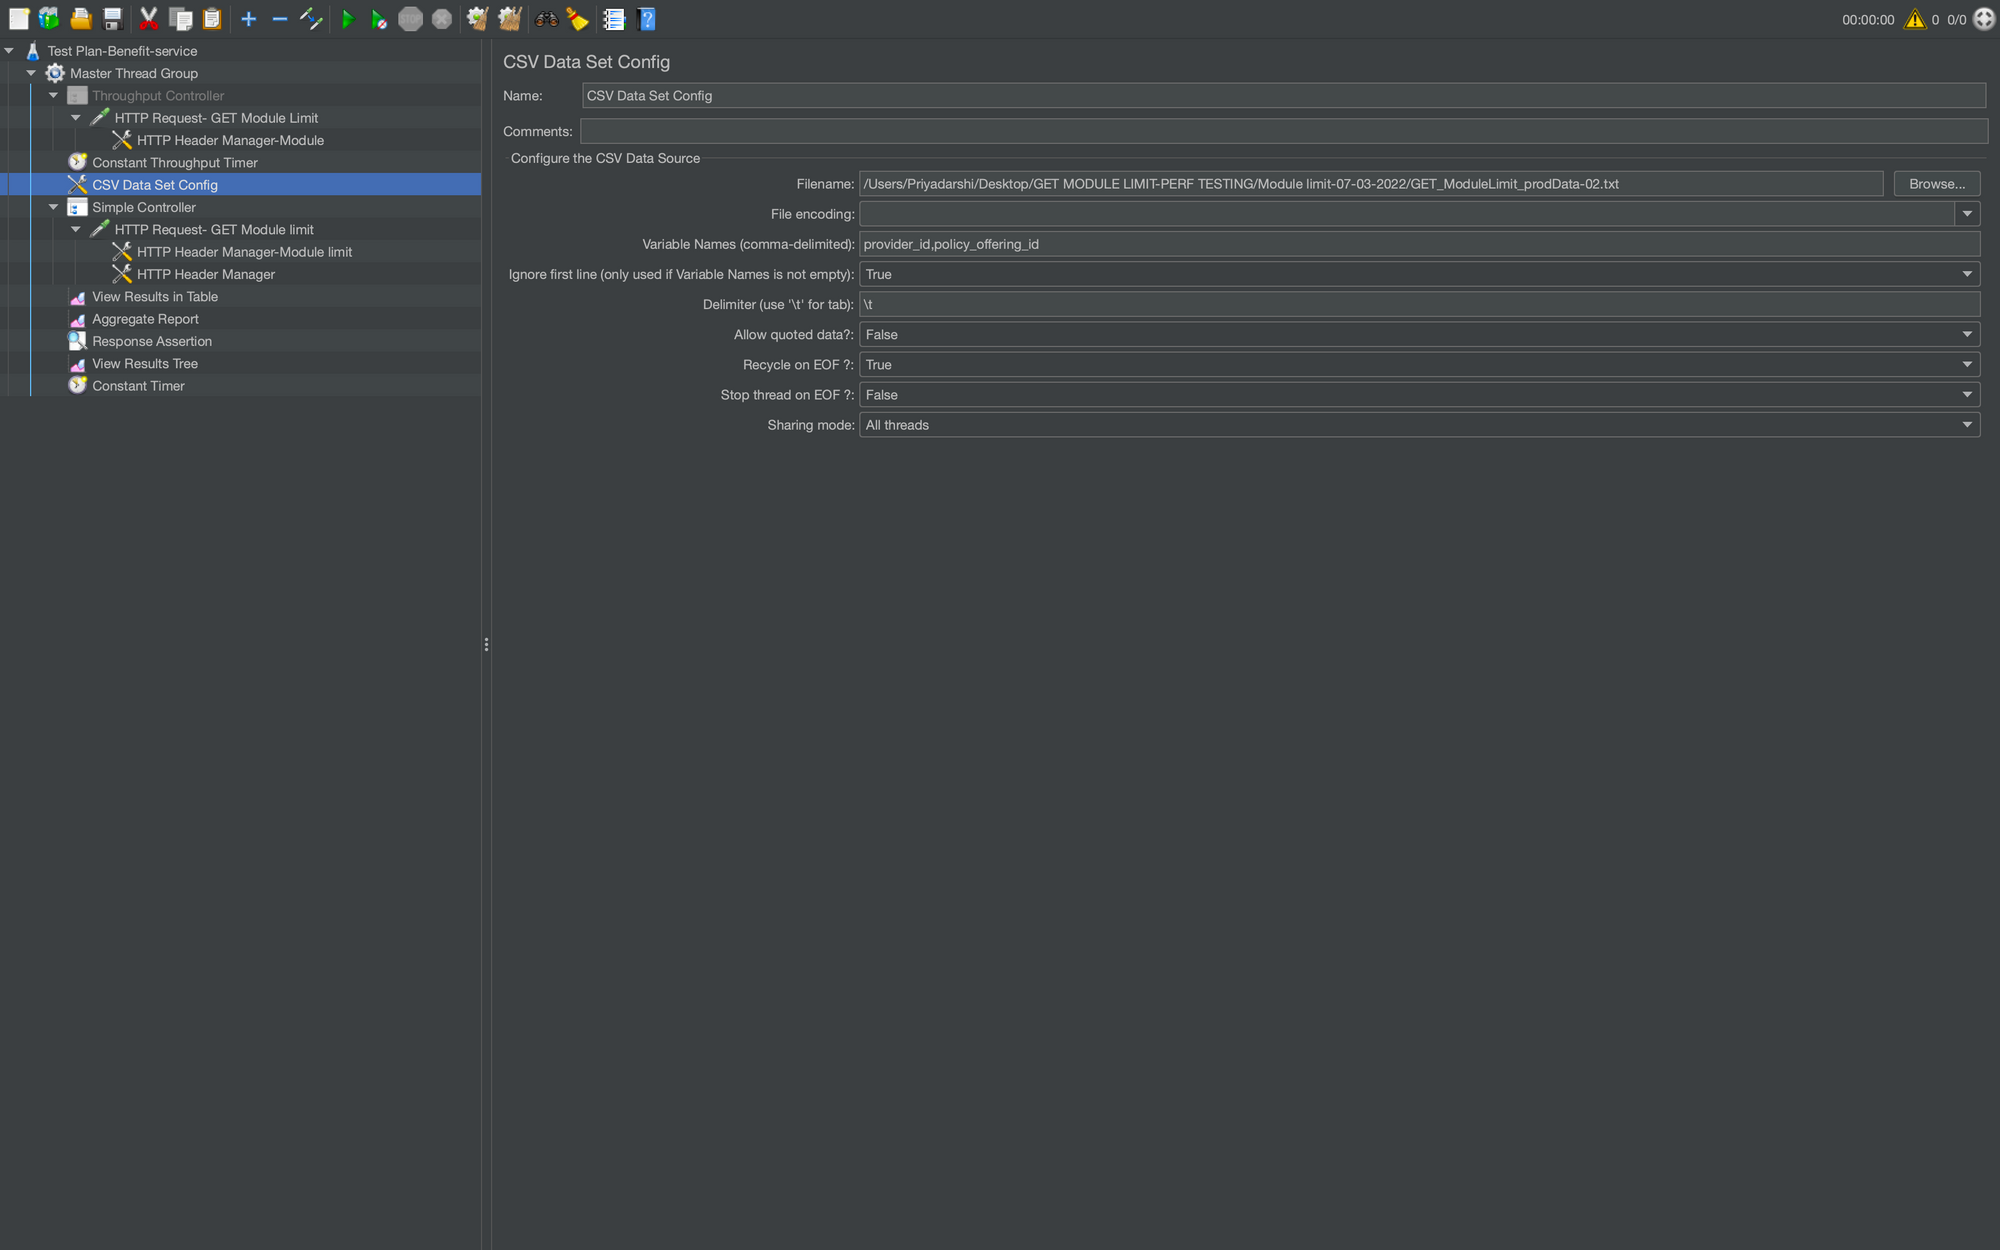
CSV Data Set Config: CSV Data Set Config element is used to read data from a text or CSV format file. For Example, If you need to perform a load test of a login scenario with 100 unique users. Prepare the data in a CSV file with 100 user records with username and password, and you can use this file data in every thread through variables in your requests/samplers by using this configuration element.
Let’s take a look at how the CSV Data Set is configured:
- Filename: the path to the CSV file containing the data,
- File Encoding: can be UTF-8 for example. The character encoding affects how the file is read,
- Variable Names: comma-delimited list of names, should be the equal number of names than columns in the CSV file. Example: login, password.
- Recycle on EOF: true by default, should JMeter restart from the beginning when the End Of File is reached.
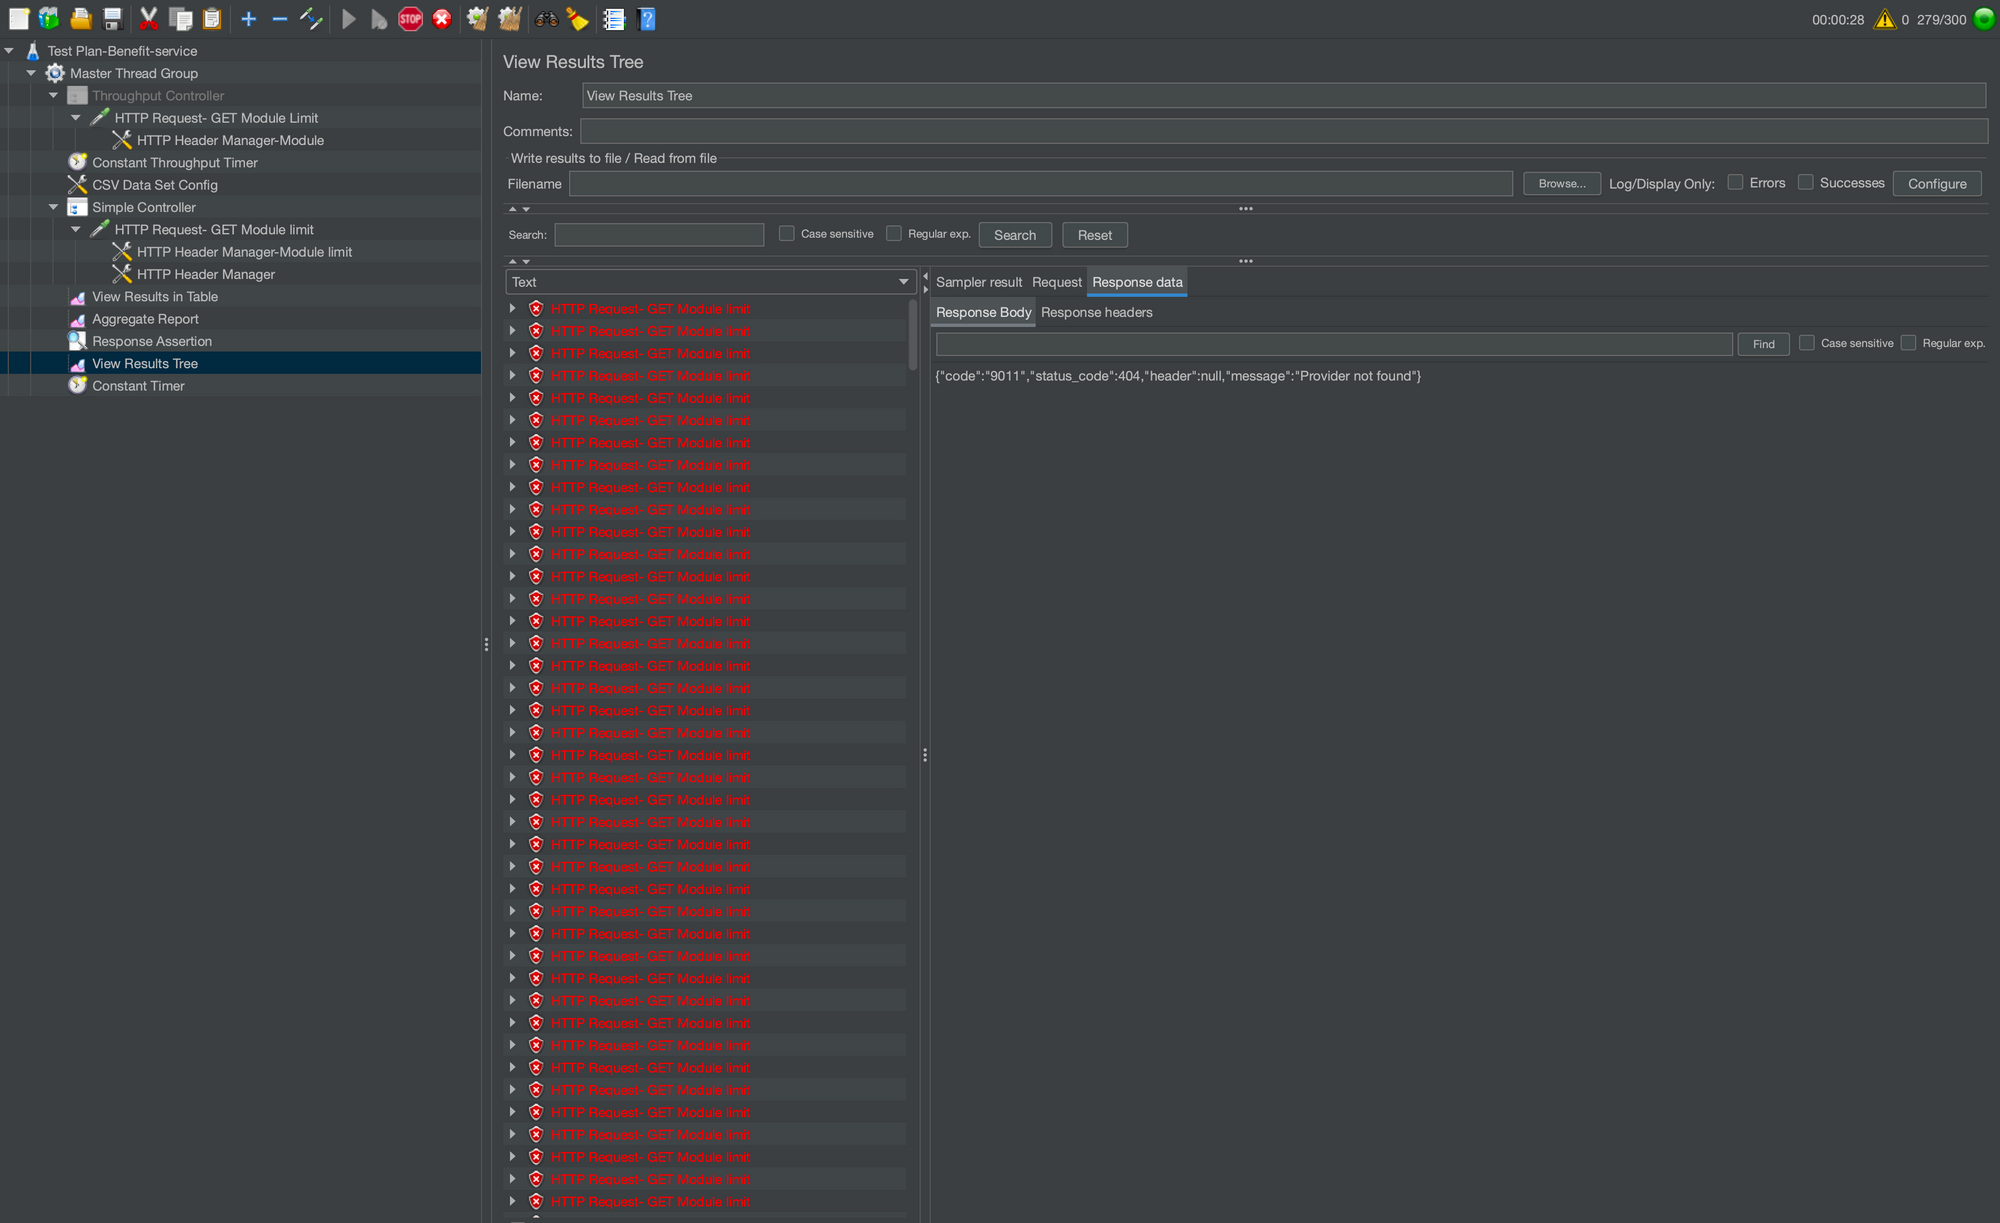
Listeners: Shows the results of the test execution. They can show results in a different format such as a tree, table, graph or log file. Listeners can be added anywhere in the test, including directly under the test plan. They will collect data only from elements at or below their level.
For example, if we add a Listener to a Thread Group, they only collect information specific to that Thread Group. If you have 3 Thread Groups and a listener attached to each one, those three listeners will show three different sets of data.
How to add a Listener: Right Click on Test plan -> Hover over Add -> Hover Over Listener -> Click on the required Listener
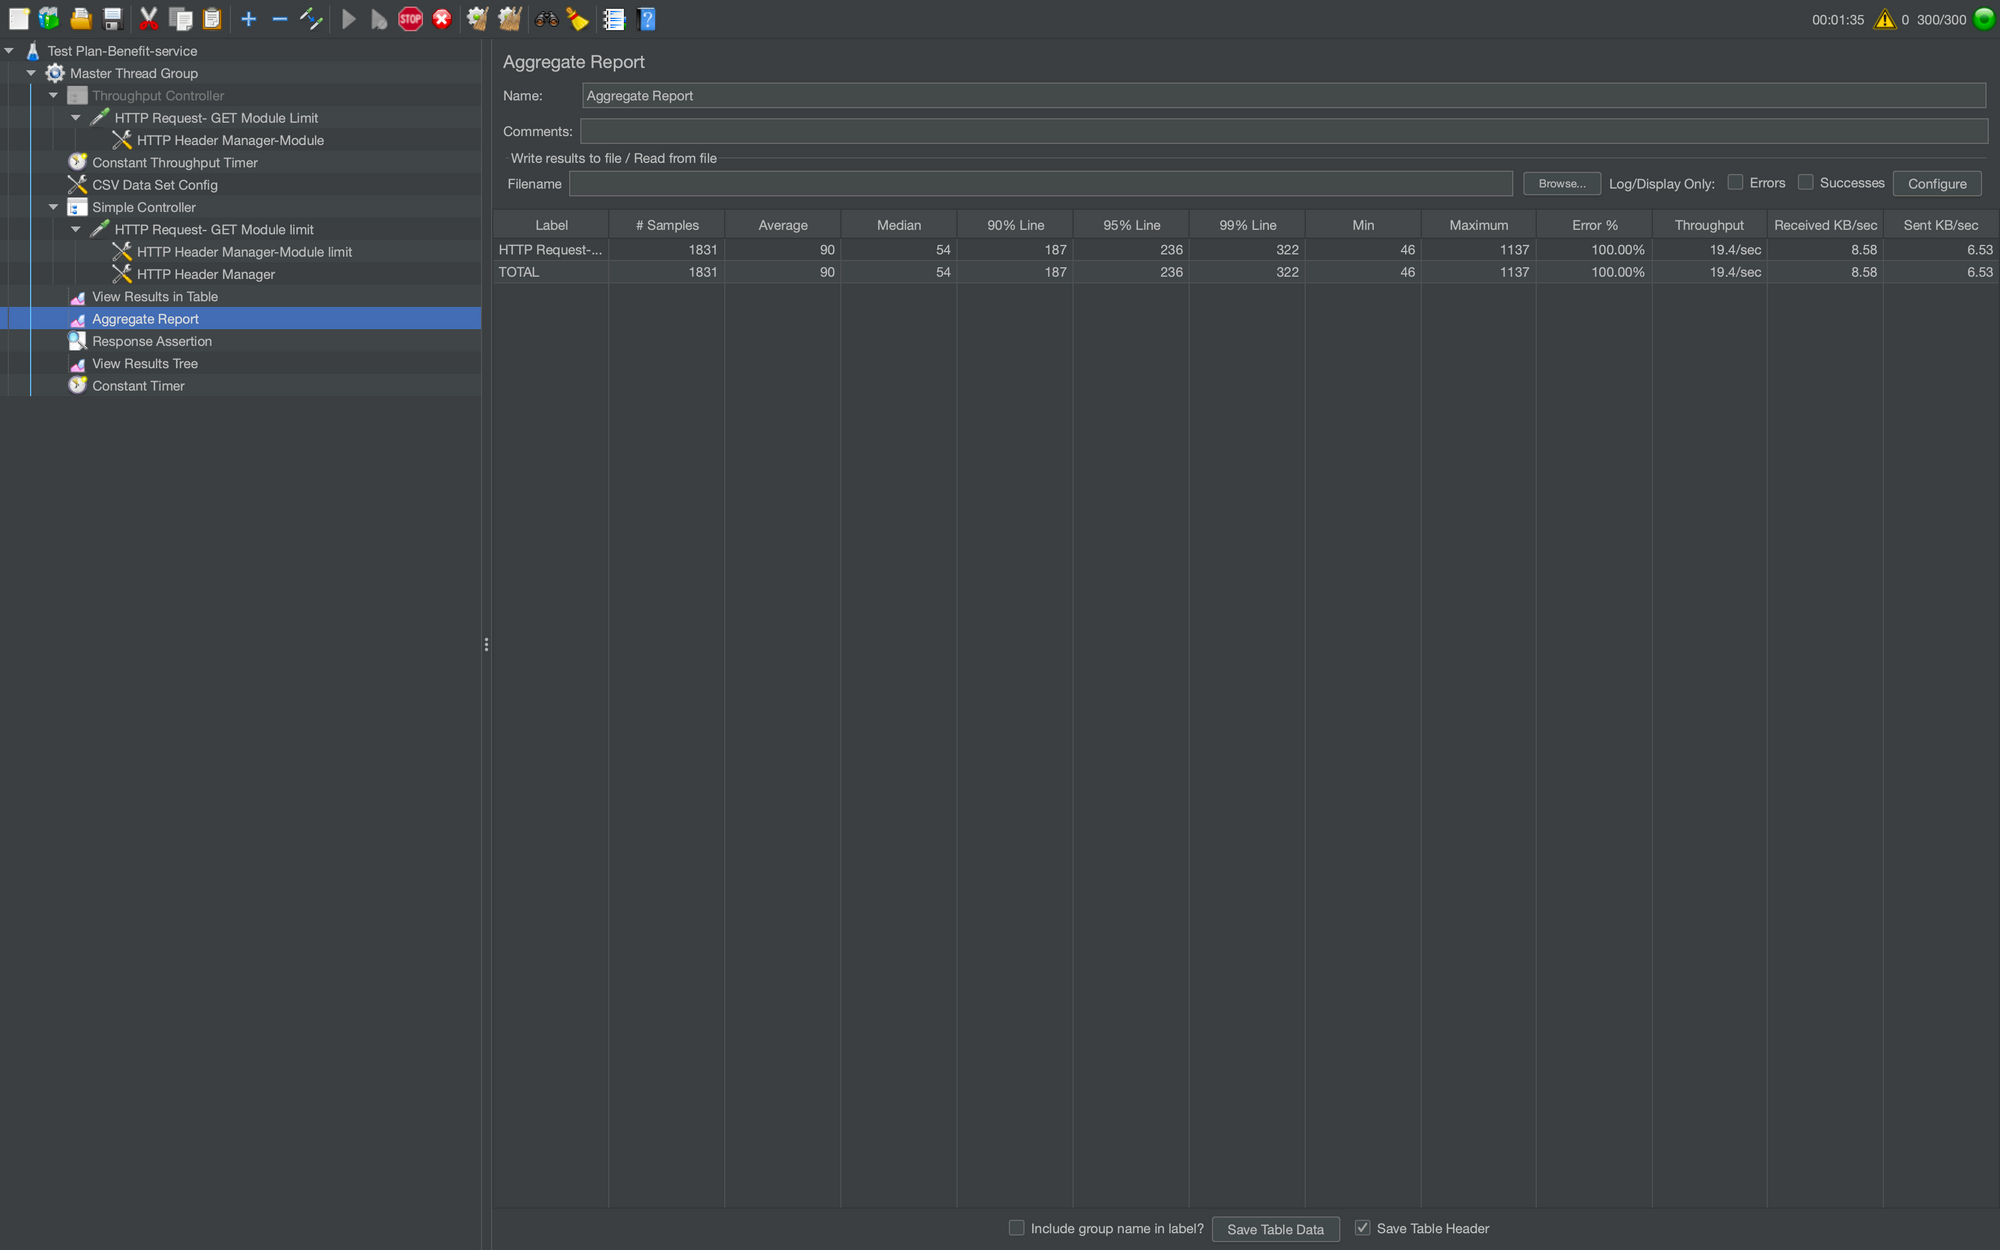
Test Report: It shows test report in which we can see the details about performance Testing like cpu utilisation, Error %, maximum/minimum/Average time taken by api, throughput, number of requests served in stipulated time etc.
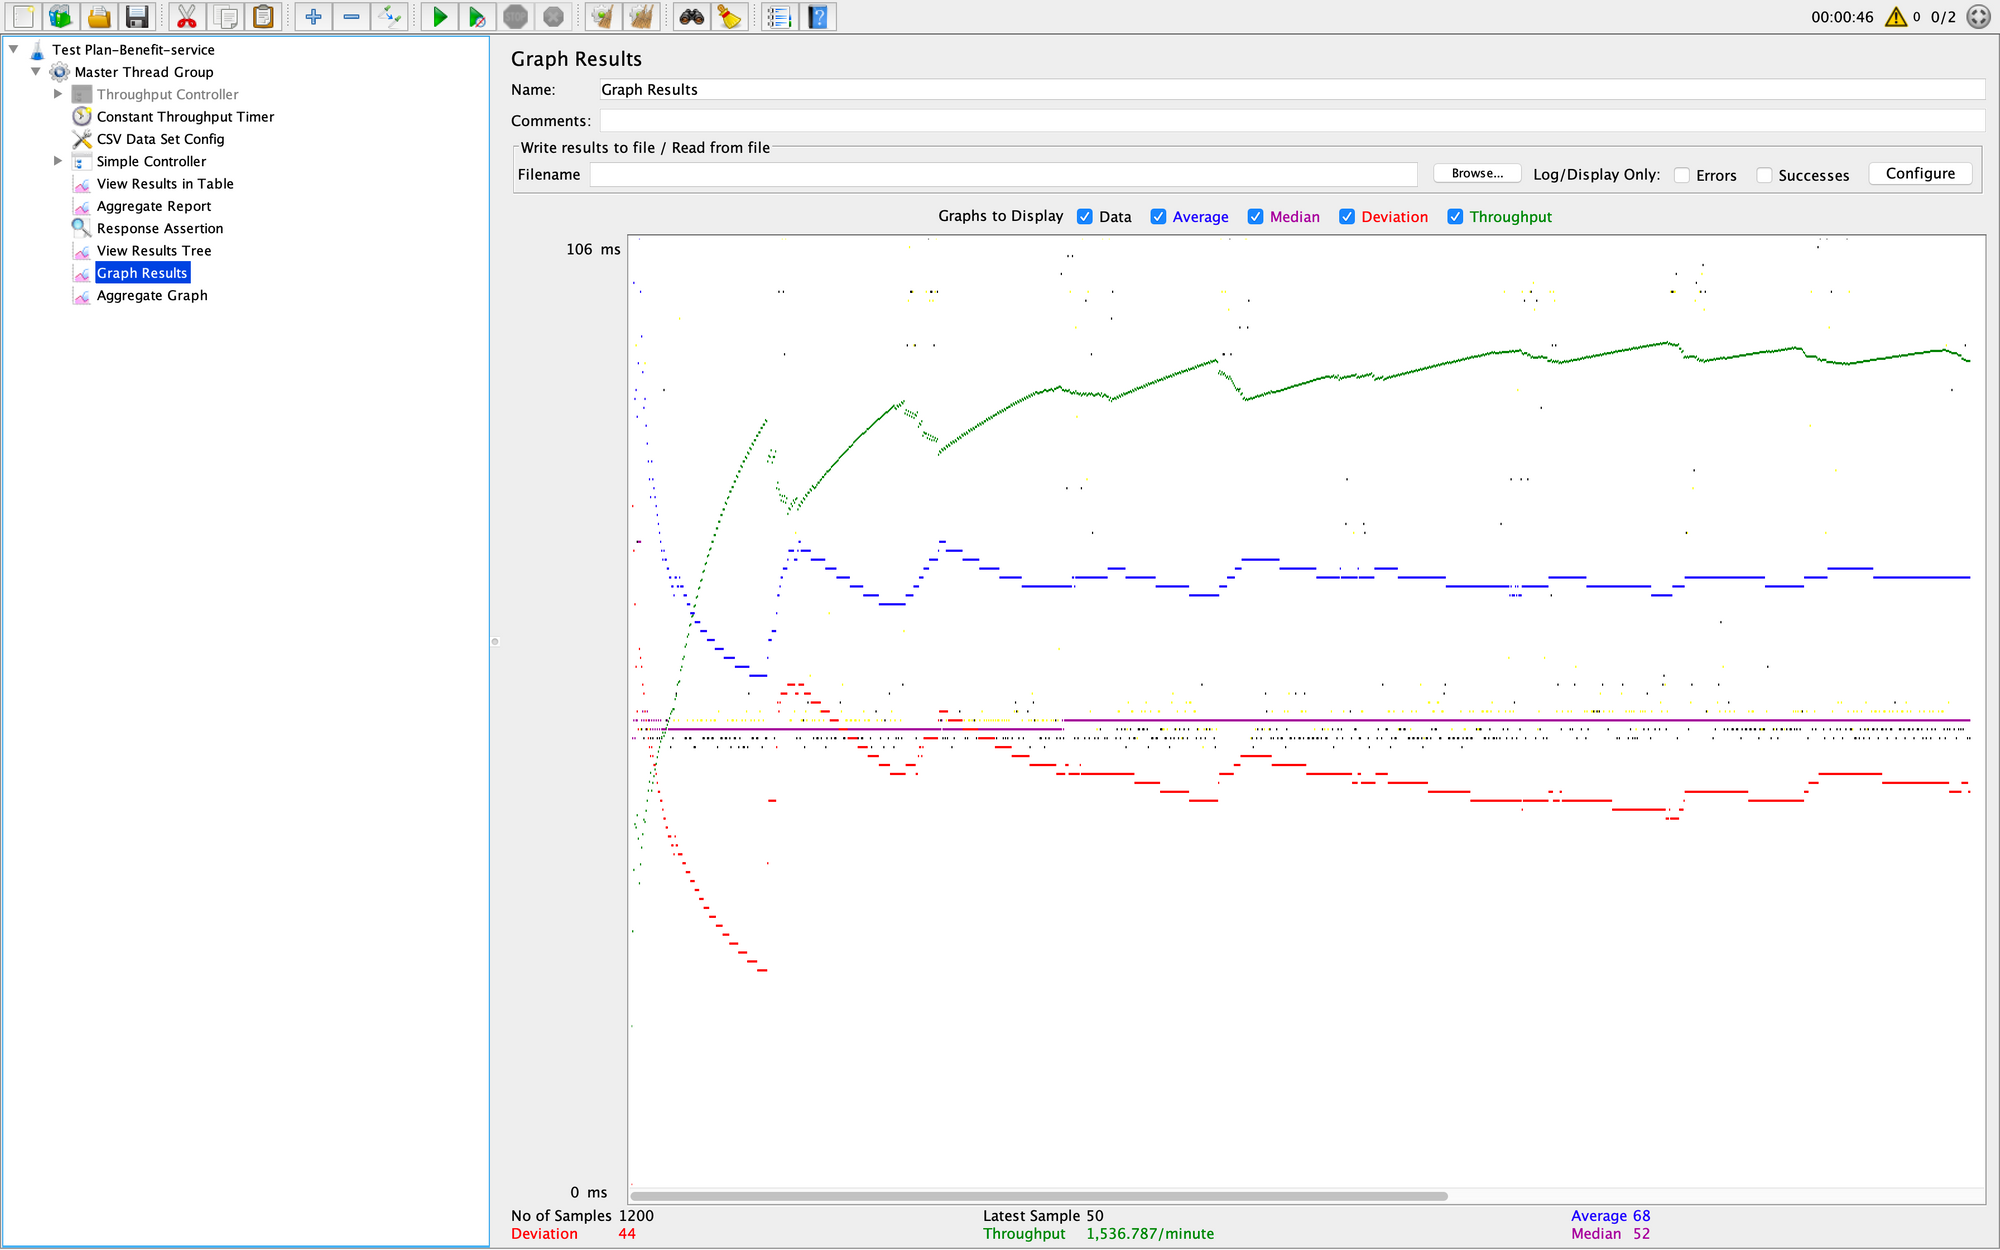
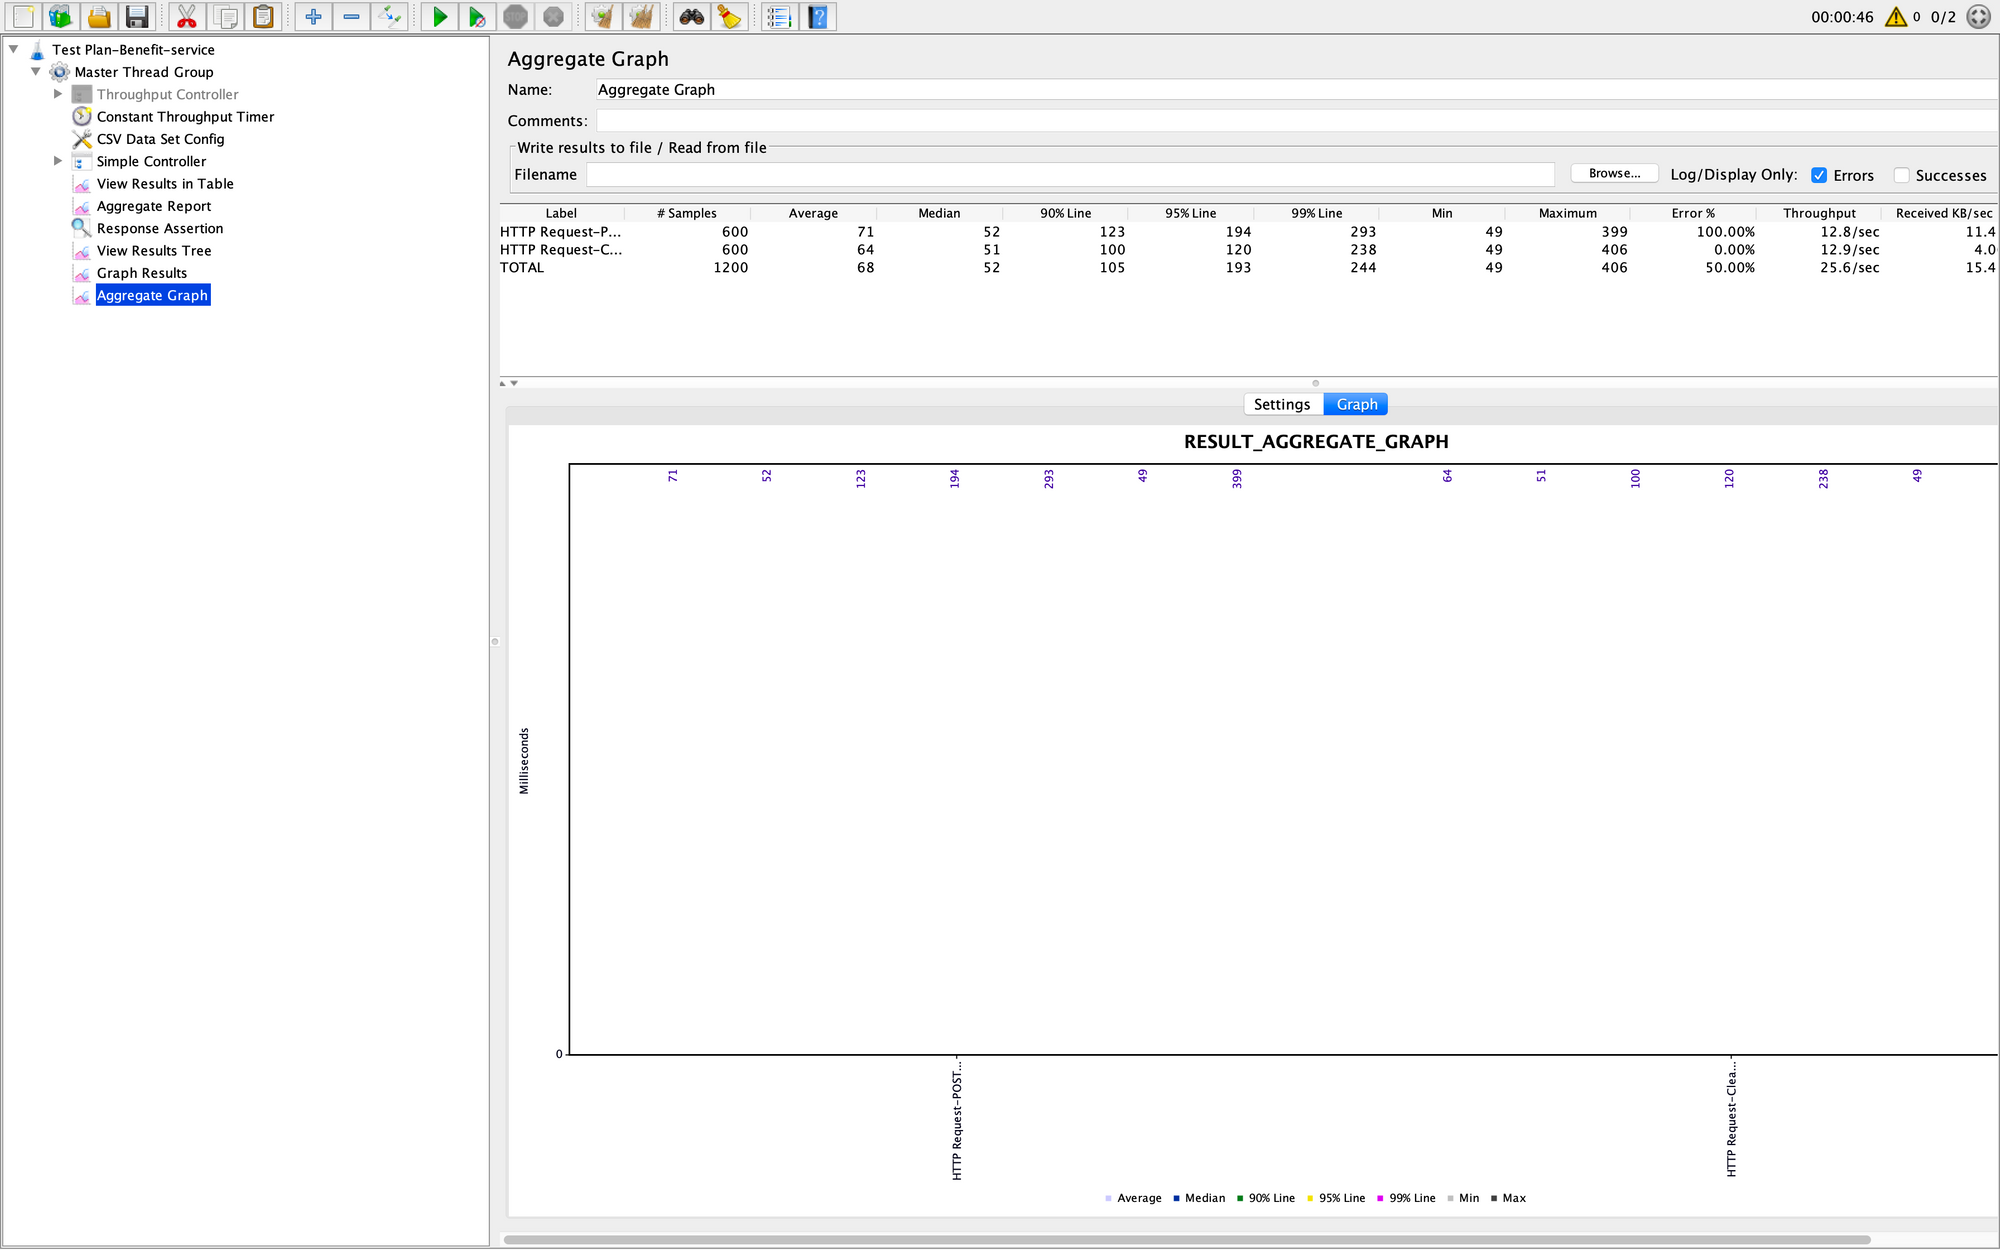
We can store Test Report in multiple format inside JMeter using Listeners. These are the some Test results formats.
a) Aggregate Report
b) Graph Result
c) Aggregate Graph
Conclusion:
By now, You began with learning the basics of Performance Testing and checked its relevance in today's scenario and why JMeter is one of the best tool for Performance Testing. Here, you learned about JMeter and its needs. Finally, you understood the entire process of Performance Testing in JMeter from installing JMeter to Report-generation with a hands-on demo.
References:
Apache JMeter :- https://jmeter.apache.org/
API :- https://aws.amazon.com/what-is/api/
Performance Testing Using Jmeter from Simplilearn video link :-
Join us
Scalability, reliability and maintainability are the three pillars that govern what we build at Halodoc Tech. We are actively looking for engineers at all levels and if solving hard problems with challenging requirements is your forte, please reach out to us with your resumé at careers.india@halodoc.com.
About Halodoc
Halodoc is the number 1 all around Healthcare application in Indonesia. Our mission is to simplify and bring quality healthcare across Indonesia, from Sabang to Merauke.
We connect 20,000+ doctors with patients in need through our Tele-consultation service. We partner with 1500+ pharmacies in 50 cities to bring medicine to your doorstep. We've also partnered with Indonesia's largest lab provider to provide lab home services, and to top it off we have recently launched a premium appointment service that partners with 500+ hospitals that allows patients to book a doctor appointment inside our application.
We are extremely fortunate to be trusted by our investors, such as the Bill & Melinda Gates foundation, Singtel, UOB Ventures, Allianz, Gojek and many more. We recently closed our Series B round and In total have raised USD$100million for our mission.
Our team work tirelessly to make sure that we create the best healthcare solution personalised for all of our patient's needs, and are continuously on a path to simplify healthcare for Indonesia.
Recommended for you
 Prasanna Gholap