
Kubernetes Pod Optimization For Java Services
This article describes how we reduced the total cost of K8s cluster nodes by optimising Kubernetes (K8s) pods by tuning the JVM parameters and container specifications.
Pod optimization is effectively handling same load using least no of pods with each pod using least amount of resources. This can be achieved by tuning container helm configurations and JVM parameters
Before digging into pod optimization, let's become familiar with the Java memory model and the Kubernetes (K8s) Horizontal Pod Autoscaler (HPA), since this will help us comprehend the points that follow.
JAVA Memory Model
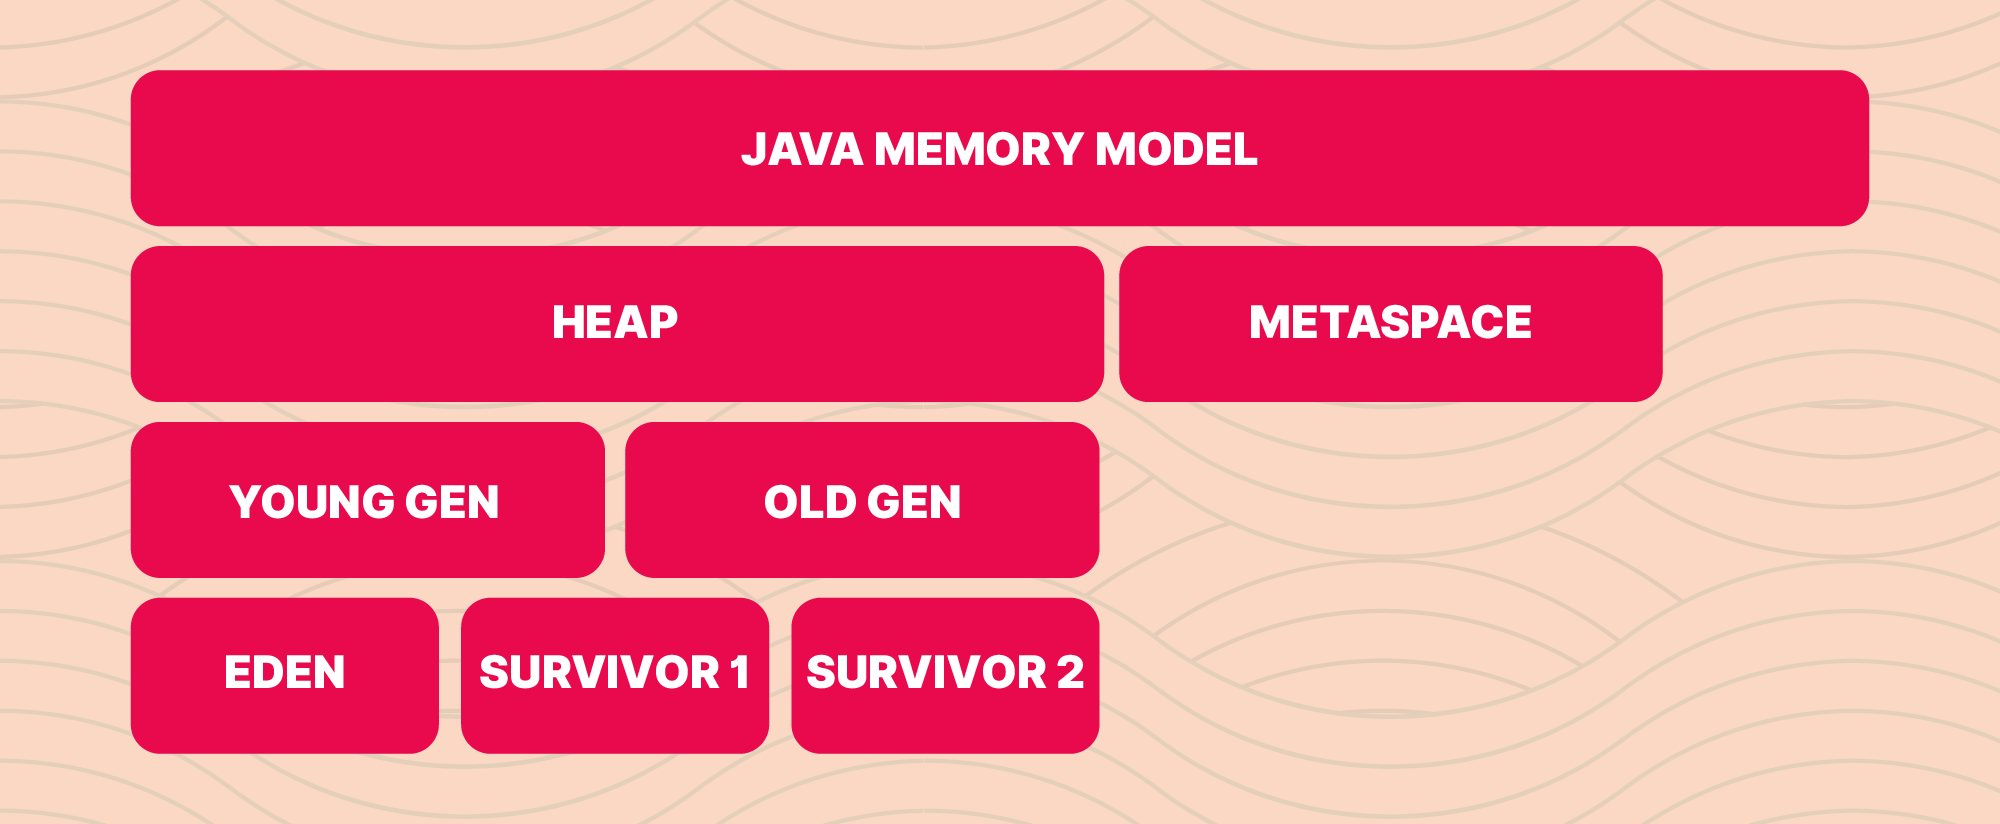
Heap: Java objects and classes dynamically allocate memory at runtime using heap space. In the heap area, new objects are constantly produced, and references to those items are kept in the stack memory.
Younger Generation: This memory has been allocated for all new objects. The trash collection starts whenever this RAM is full. This is named as Minor Garbage Collection
- Eden Space: In this area, objects are initially generated.
- SURVIVOR 1: Items in Eden Space that have made it through a few Garbage Collection (GC) cycles will be elevated to S1.
Old Generation: This section is where all the durable items that have endured several rounds of small garbage collection are kept. Garbage collection starts once memory fills up. This is named as Major Garbage Collection.
- SURVIVOR 2: An item will be promoted to survivor 2 if it survives a few GC cycles in survivor 1.
Metaspace: All of the class metadata is kept in a new area called Metaspace, which is created out of native memory and is not contiguous with the Java Heap. The maximum amount of system memory that the Metaspace can use can be restricted using the maxmetasize JVM option.
Kubernetes HPA
The objective of a HorizontalPodAutoscaler in Kubernetes is to automatically scale the workload to match demand by updating a workload resource (such as a Deployment or StatefulSet) on a regular basis.
When the load increases, more Pods are deployed, which is referred to as horizontal scaling. This differs from vertical scaling, which for Kubernetes would include giving the workload's already running Pods greater resources (such as memory or CPU).
The HorizontalPodAutoscaler informs the workload resource (the Deployment, StatefulSet, or other similar resource) to scale back down if the demand drops and the number of Pods is more than the defined minimum.
Horizontal pod autoscaling does not apply to objects that can't be scaled (for example: a DaemonSet.)
Both a controller and a Kubernetes API resource are used to implement the HorizontalPodAutoscaler. The resource dictates how the controller will act. Running within the Kubernetes control plane, the horizontal pod autoscaling controller regularly modifies the target's desired scale (for instance, a deployment) to match observed metrics like average CPU utilisation, average memory utilisation, or any other custom metric you provide.
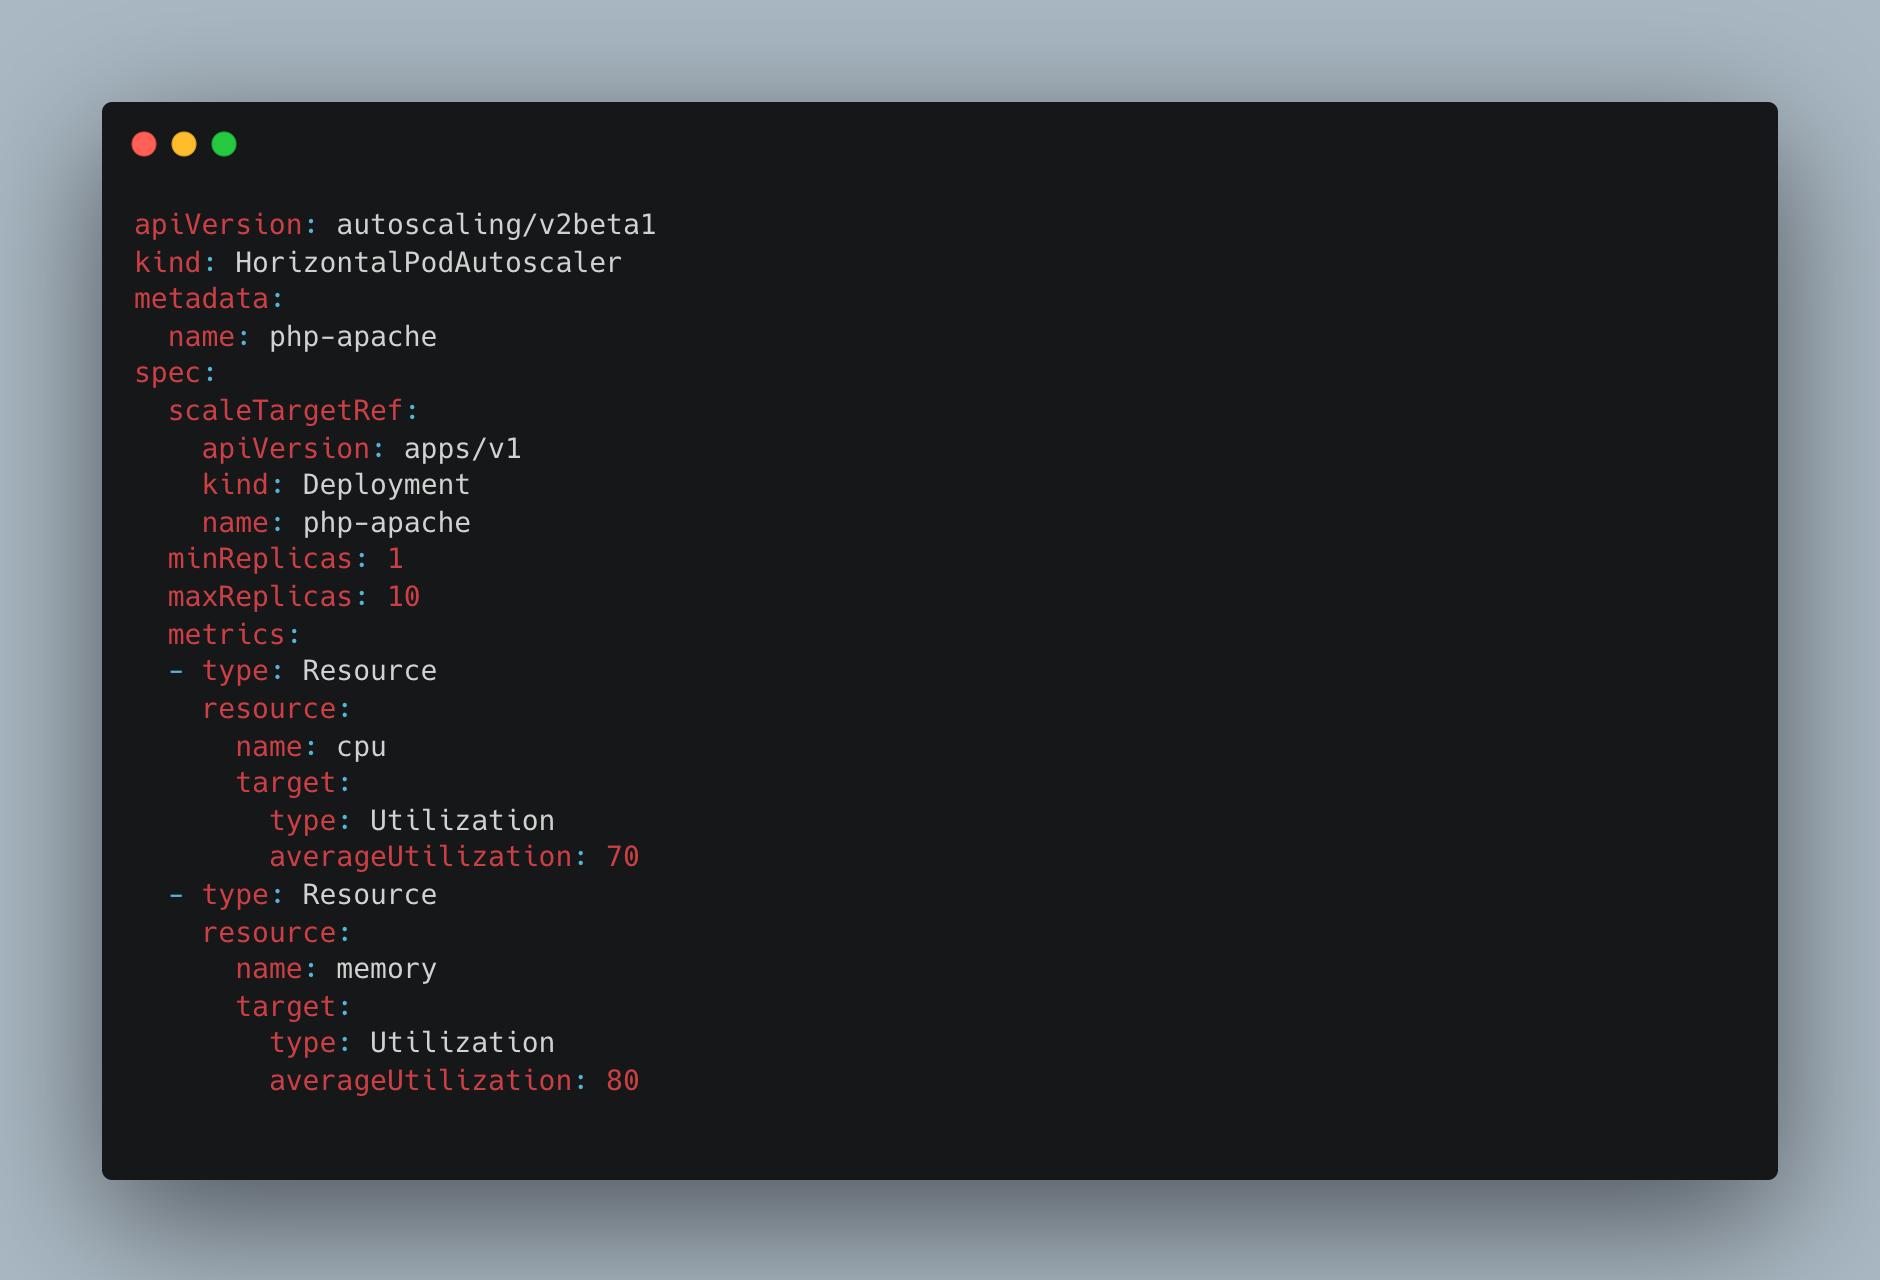
The minimal number of pods to run is specified by minReplicas. The maximum pods the HPA may scale are specified by maxReplicas. The averageUtilization value specifies the threshold value that the HPA must watch for while scaling up or scaling down. The average CPU/Memory Utilization is calculated by HPA on a regular basis and is compared to the averageUtilisation (CPU/Memory) value. HPA will scale down the pods if the estimated value is below the threshold and scale up the pods if it is above the threshold.
Note: The ability to scale up and down based on CPU threshold is more promising than memory threshold since CPU is a resource that can be highly compressible while memory is not highly compressible.
How K8s HPA calculate the resource utilisation of the pods ?
Algorithm details
The HorizontalPodAutoscaler controller, in its simplest form, relies on the relationship between the intended metric value and the existing metric value:
desiredReplicas = ceil[currentReplicas * ( currentMetricValue / desiredMetricValue )]
The number of replicas will double, for instance, if the intended metric value is 100m and the actual value is 200m, since 200.0/ 100.0 == 2.0. The number of copies will be cut in half if the current value is 50m, as 50.0 / 100.0 == 0.5. If the ratio is sufficiently near to 1.0, the control plane forgoes any scaling action (within a globally-configurable tolerance, 0.1 by default).
When targetAverageUtilization is specified, the currentMetricValue is computed by taking the average of the given metric across all Pods in the HorizontalPodAutoscaler's scale target.
The control plane additionally takes into account whether any metrics are missing and how many Pods are prepared before determining the tolerance and final values. All unsuccessful Pods are destroyed, and all Pods with a deletion timestamp set (objects with a deletion timestamp are being shut down / deleted) are ignored.
Pods with missing values will be utilised to modify the final scaling amount. If a specific Pod is lacking metrics, it is saved for later. If a pod hasn't fully initialised or may be unhealthy while scaling on CPU, or if the most recent metric point for the pod occurred before it fully initialised, that pod is also pushed aside.
Why is Pod Optimization necessary ?
The majority of IT firms have switched from monolithic design to micro-service architecture as a best practise. In order to run these services on K8s, we require an increasing number of EC2 instances, which is expensive. As a result, pod optimization enables us to run all of our services efficiently while using the fewest resources possible. This will help in containing resource costs.
Challenges with non-optimised pods:
- Redundant resources
- Inadequate auto scale-up
- Pseudo alerts
- Increased Cost
- Application performance degrade
Halodoc's Approach to Optimising K8s Pods
Step 1 (setting request / limit value):
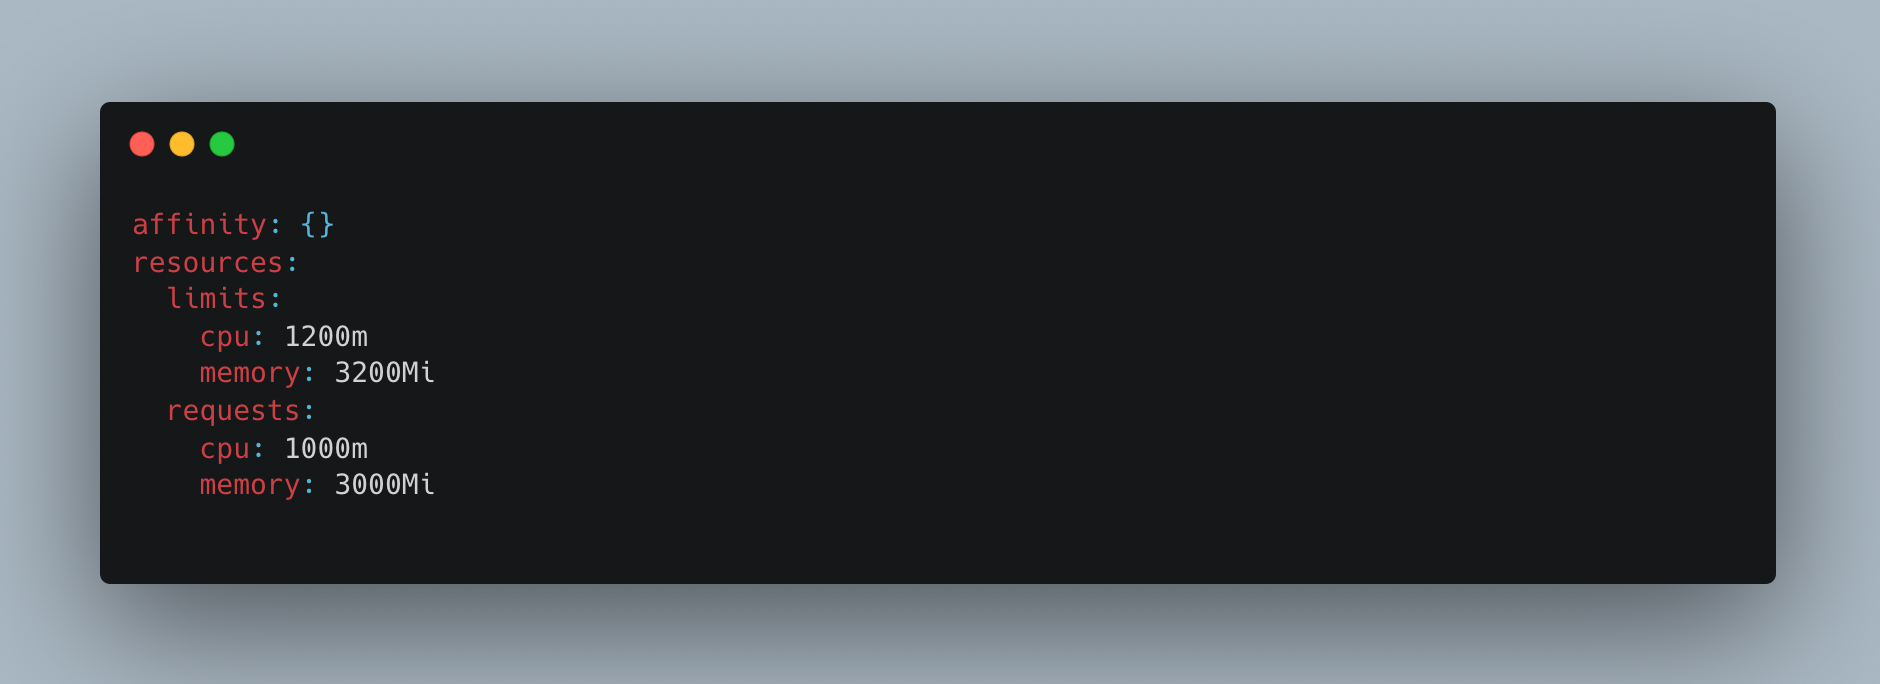
Set request CPU and memory limits in the container specifications. This allows us to limit the operating range of the pod containers.
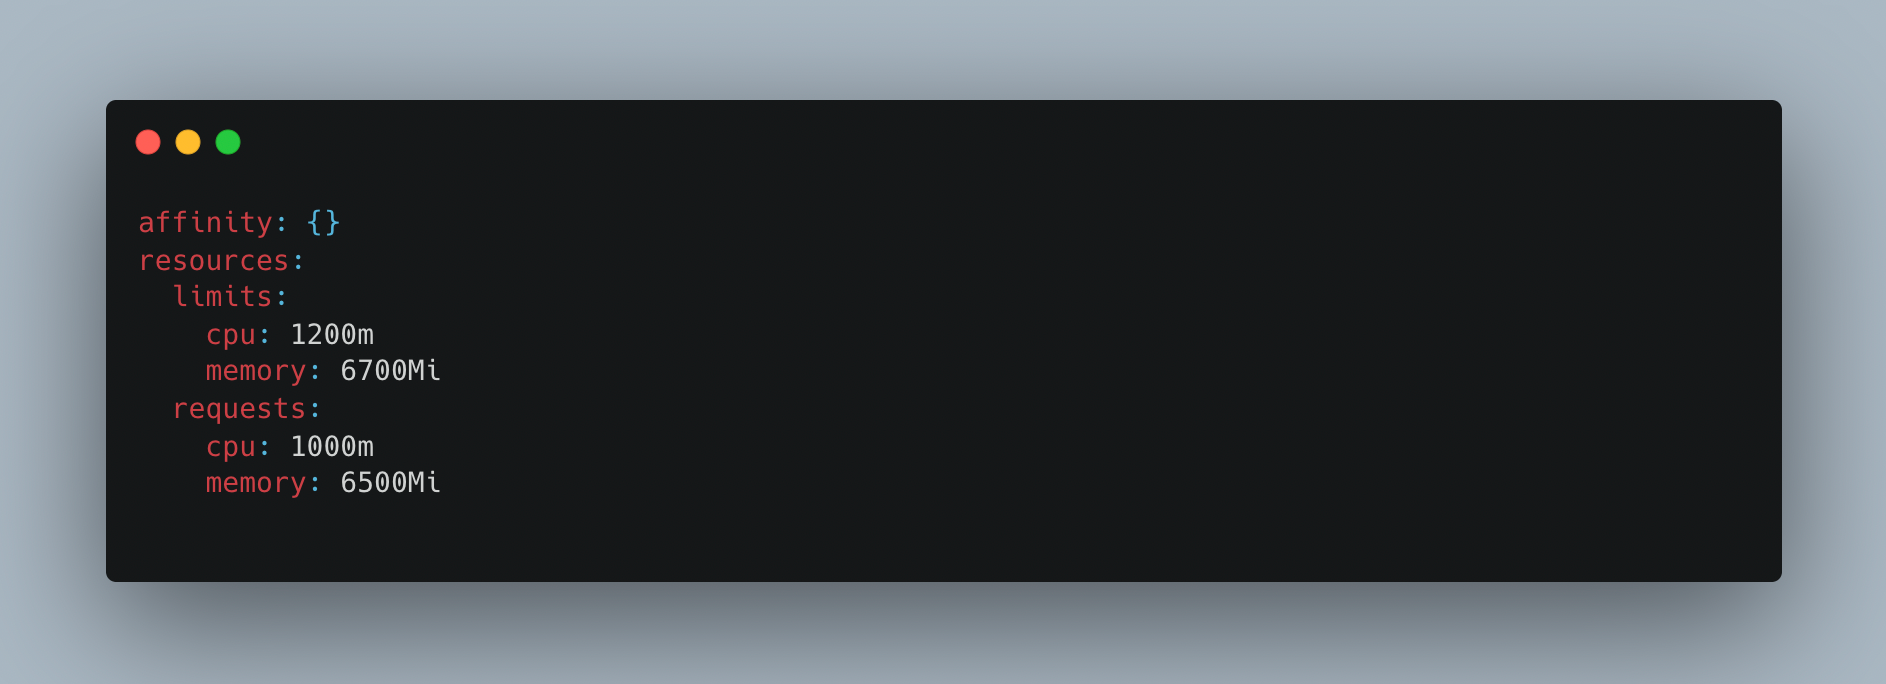
The amount of fixed memory that must be allotted to the container is known as the request cpu/memory. The limit cpu/memory setting controls how much of a resource the container is permitted to use. The used cpu/memory refers to the cpu/memory that the Service Container used to perform its duties.
Request cpu/memory should be greater than cpu/memory used by the service. Since limit cpu/memory allocation depends on the availability of resources on worker node, if resources are not available then pod will be scheduled in different node and pod restarts. This is a contributing factor in the frequent pod restarts.
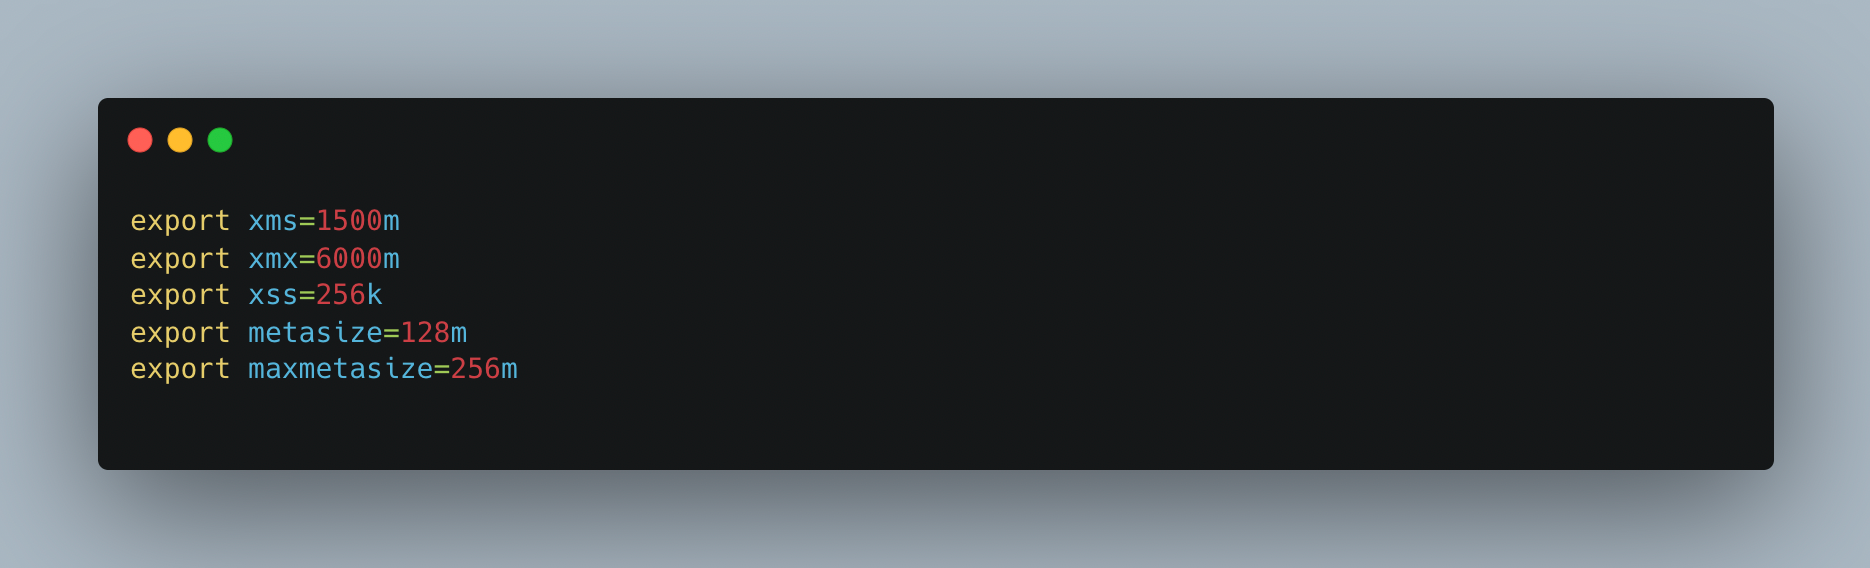
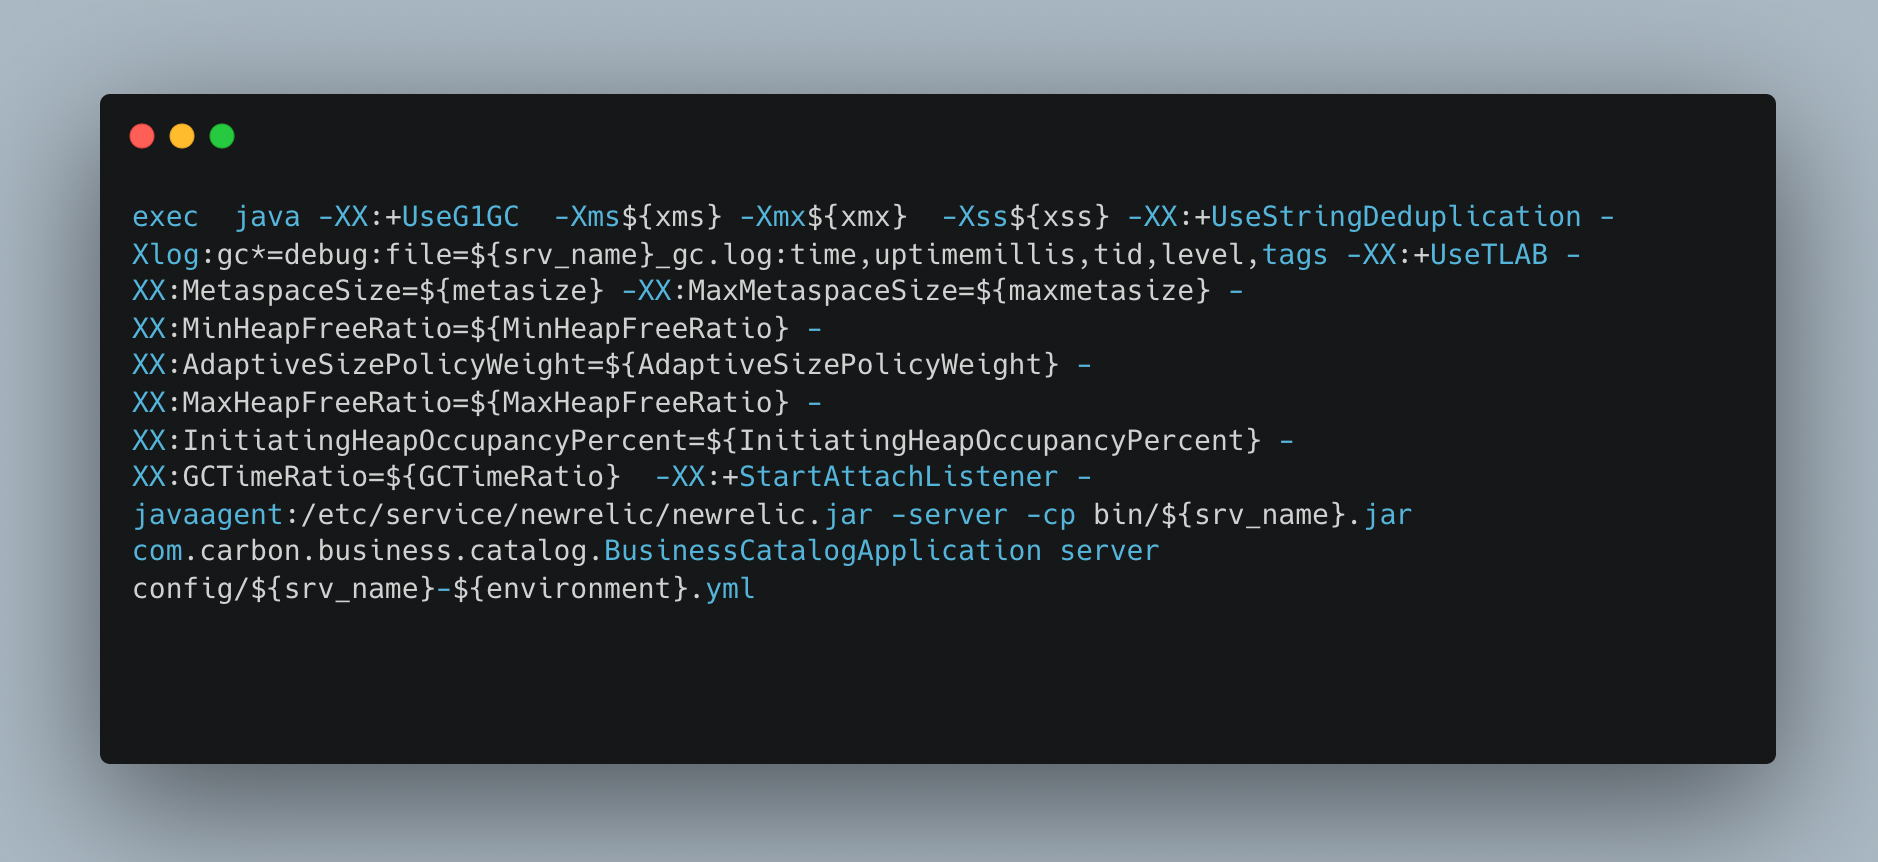
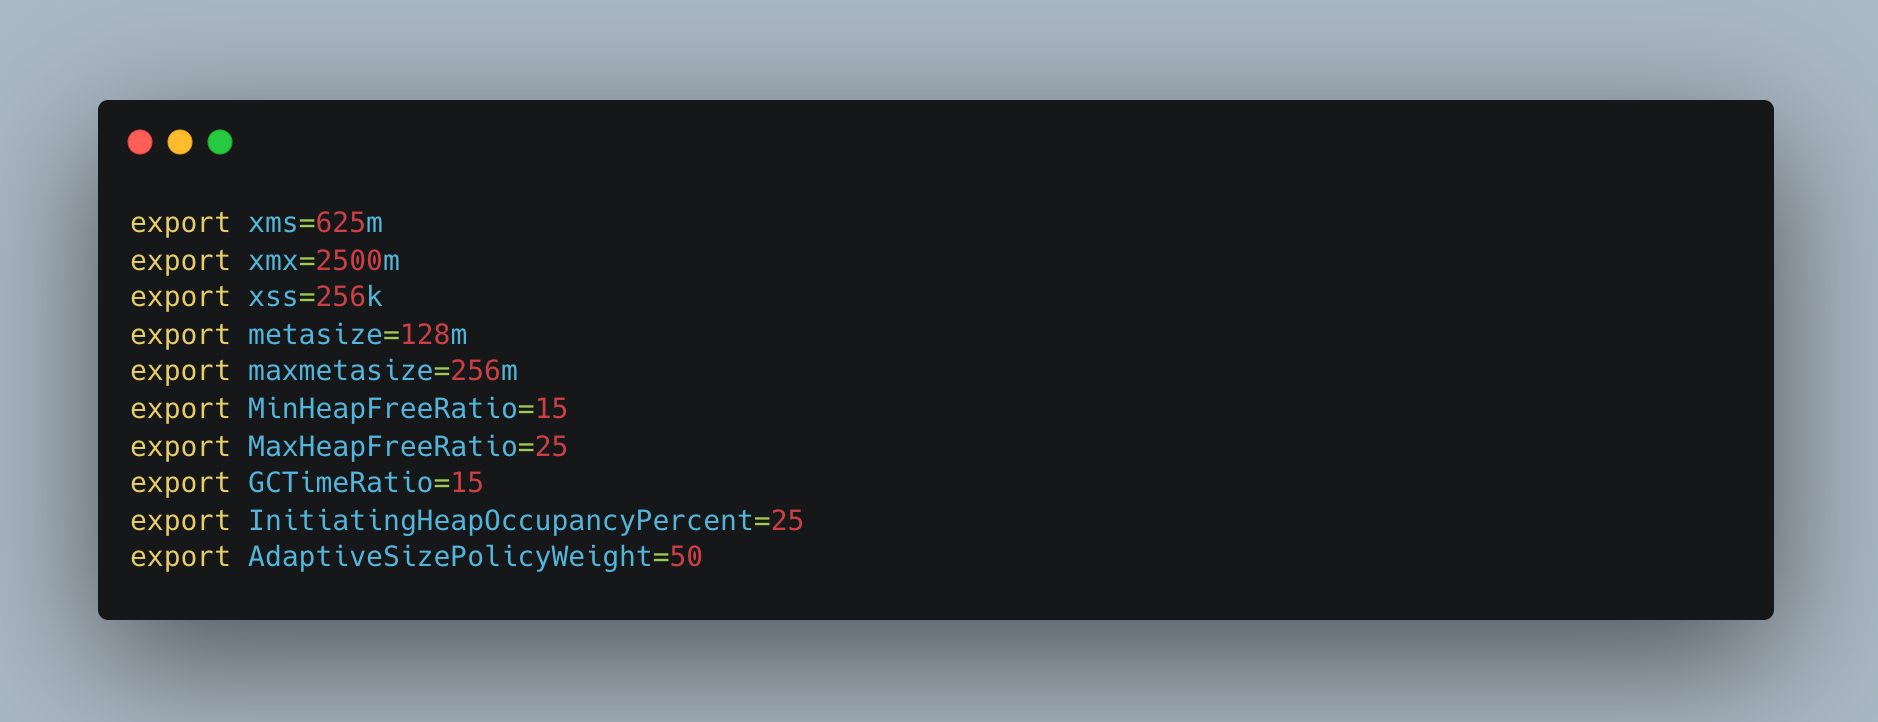
In the graphic up top, xms represents the initial heap memory allotted to the service on boot up. The maximum heap memory that a service may allocate is xmx, while the stack memory size is xss. The initial metaspace size is known as metasize, while the maximum metaspace size that may be assigned to a service is known as maxmetasize.
Note: JVM takes data in MB/GB units, but K8s supports data in MiB/GiB units.
1 GB  = 1000 Bytes
1 GiB = 1024 Bytes
Step 2 (Applying JVM params for aggressive GC) :
Regarding committed heap, there is a problem with java-based services. The committed heap grows in accordance with the volume of traffic, but it doesn't contract after the garbage collection (GC) trigger; only the utilised heap does. As a result, even after the GC trigger, the committed heap did not decrease, therefore if we activate the HPA trigger based on memory, the pod would not scale down to the minimal replicas.
Reason:
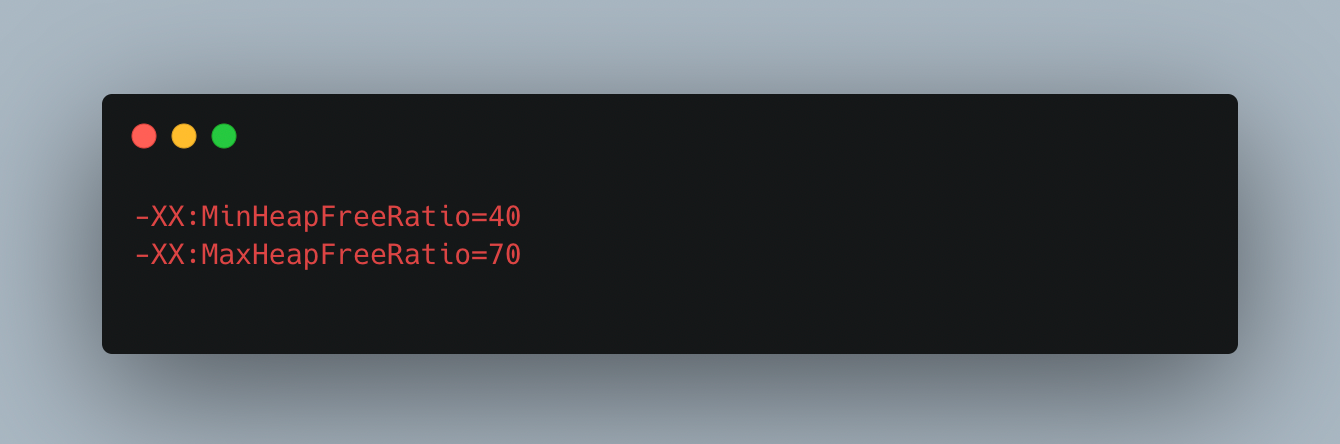
The default settings for MinHeapFreeRatio and MaxHeapFreeRatio are 40% and 70%, respectively. With these choices, if a generation's free space percentage drops below 40%, the generation will grow until it reaches its maximum permitted size in order to retain 40% free space. Similar to this, the generation shrinks if the free space surpasses 70%, subject to the minimum size of the generation, so that only 70% of the space is free.
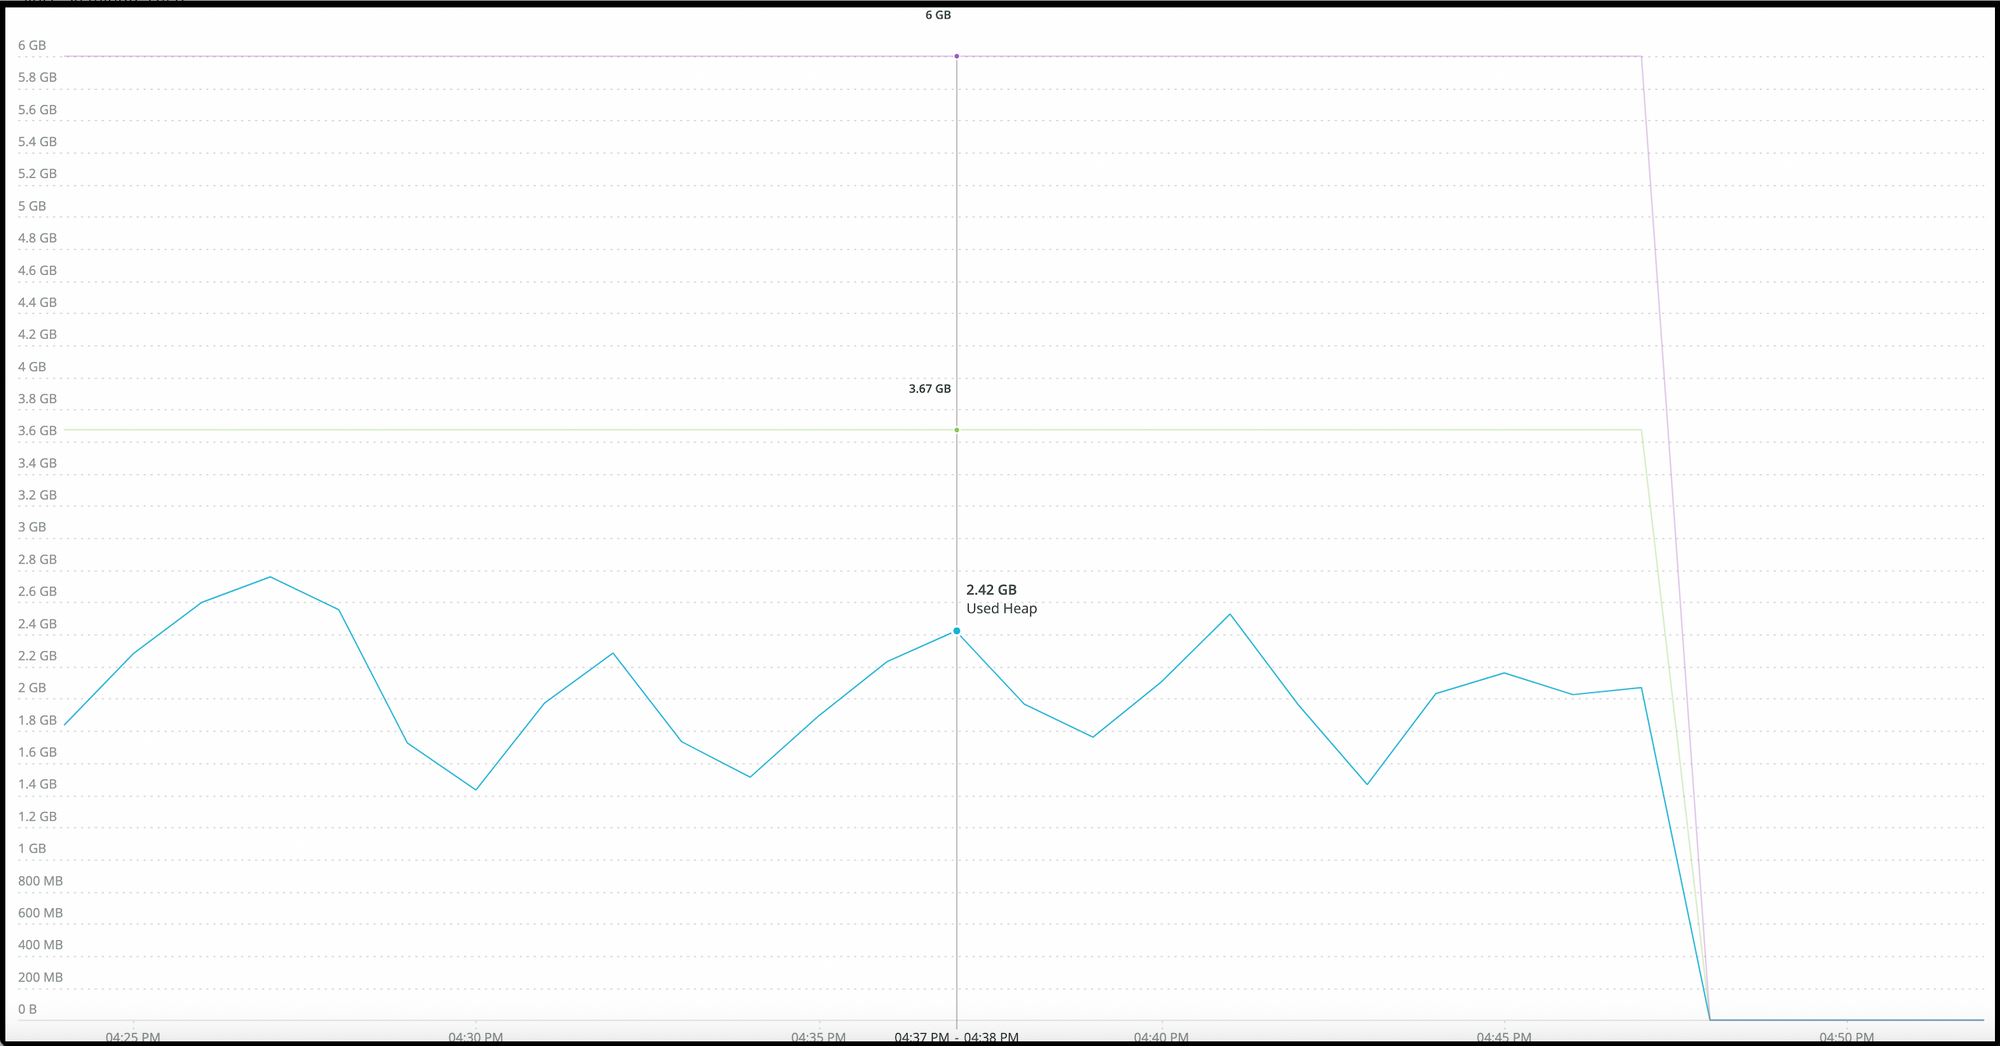
Here, the maximum heap is 6 GB, the committed heap is 3.67 GB, and the used heap is 2.42 GB. The difference between the committed and utilised heaps is increasingly pronounced, and the used heap is not decreasing as anticipated.
Solution:
Both MinHeapFreeRatio and MaxHeapFreeRatio should be given a custom value and a few extra parameters for an aggressive GC.
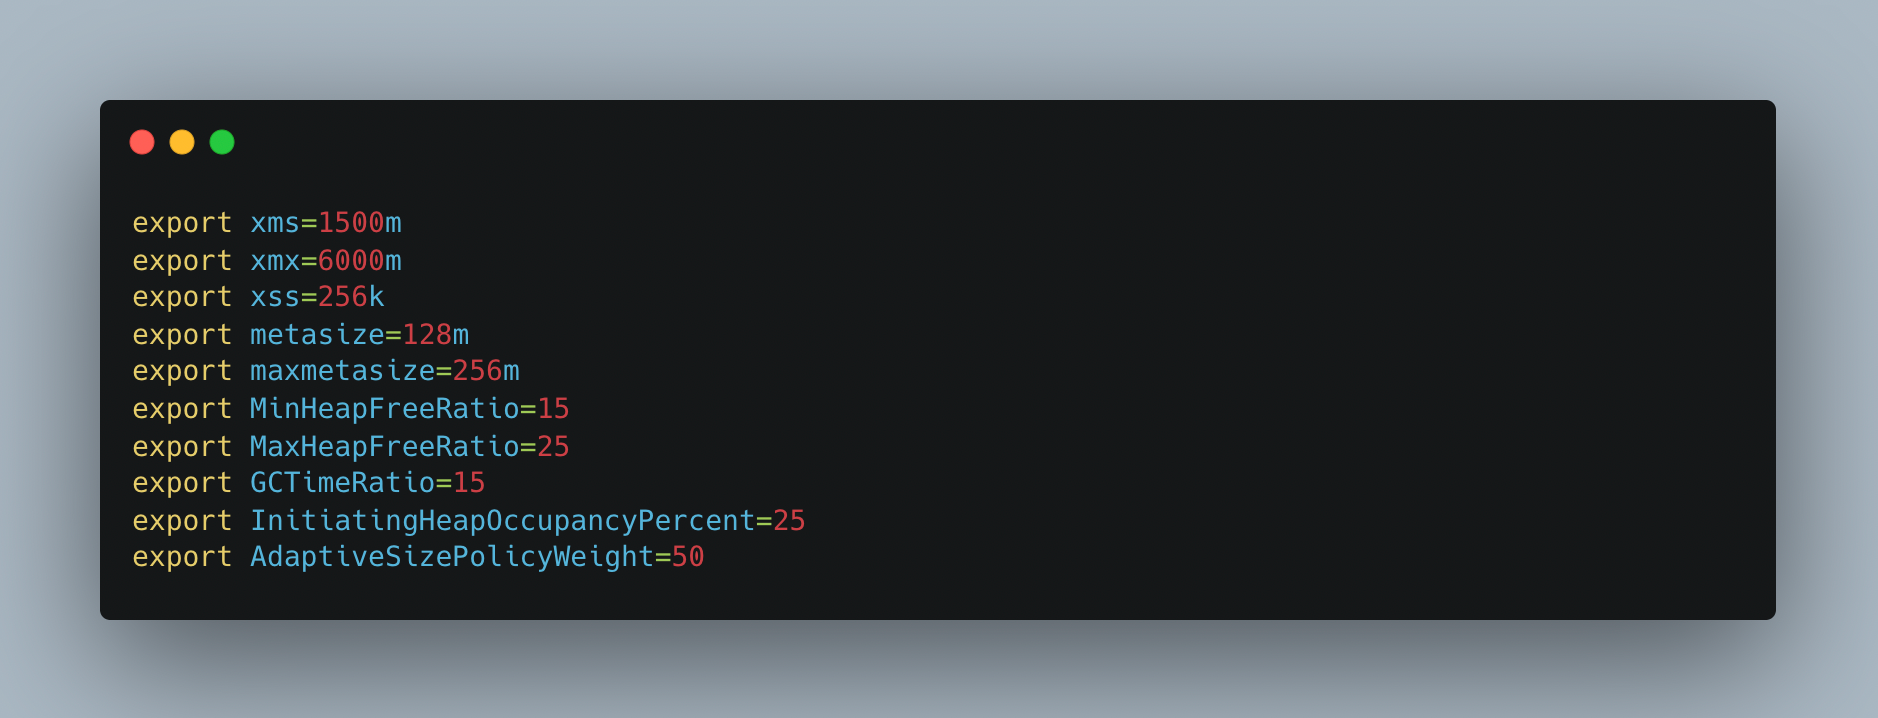
GCTimeRatio: The maximum throughput target can be set by using the -XX:GCTimeRatio flag. It defines the ratio between the time spent in GC and the time spent outside of GC. It is defined as 1/(1 + GC_TIME_RATIO_VALUE) and it’s a percentage of time spent in garbage collection.
InitiatingHeapOccupancyPercent: Percentage of the (entire) heap occupancy to start a concurrent GC cycle. GCs that trigger a concurrent GC cycle based on the occupancy of the entire heap and not just one of the generations, including G1, use this option. A value of 0 denotes 'do constant GC cycles'. The default value is 45.
AdaptiveSizePolicyWeight: controls how much previous GC times are taken into account when checking the timing goal. The default setting, 10, bases the timing goal check 90% on previous GC times and 10% on the current GC time. Resetting this to 90 means that the timing goal check is mostly based on to the current GC execution time, i.e. it is more responsive to current rather than historical memory use. This greater responsiveness also usefully limits the extent to which space gets traded off against time.
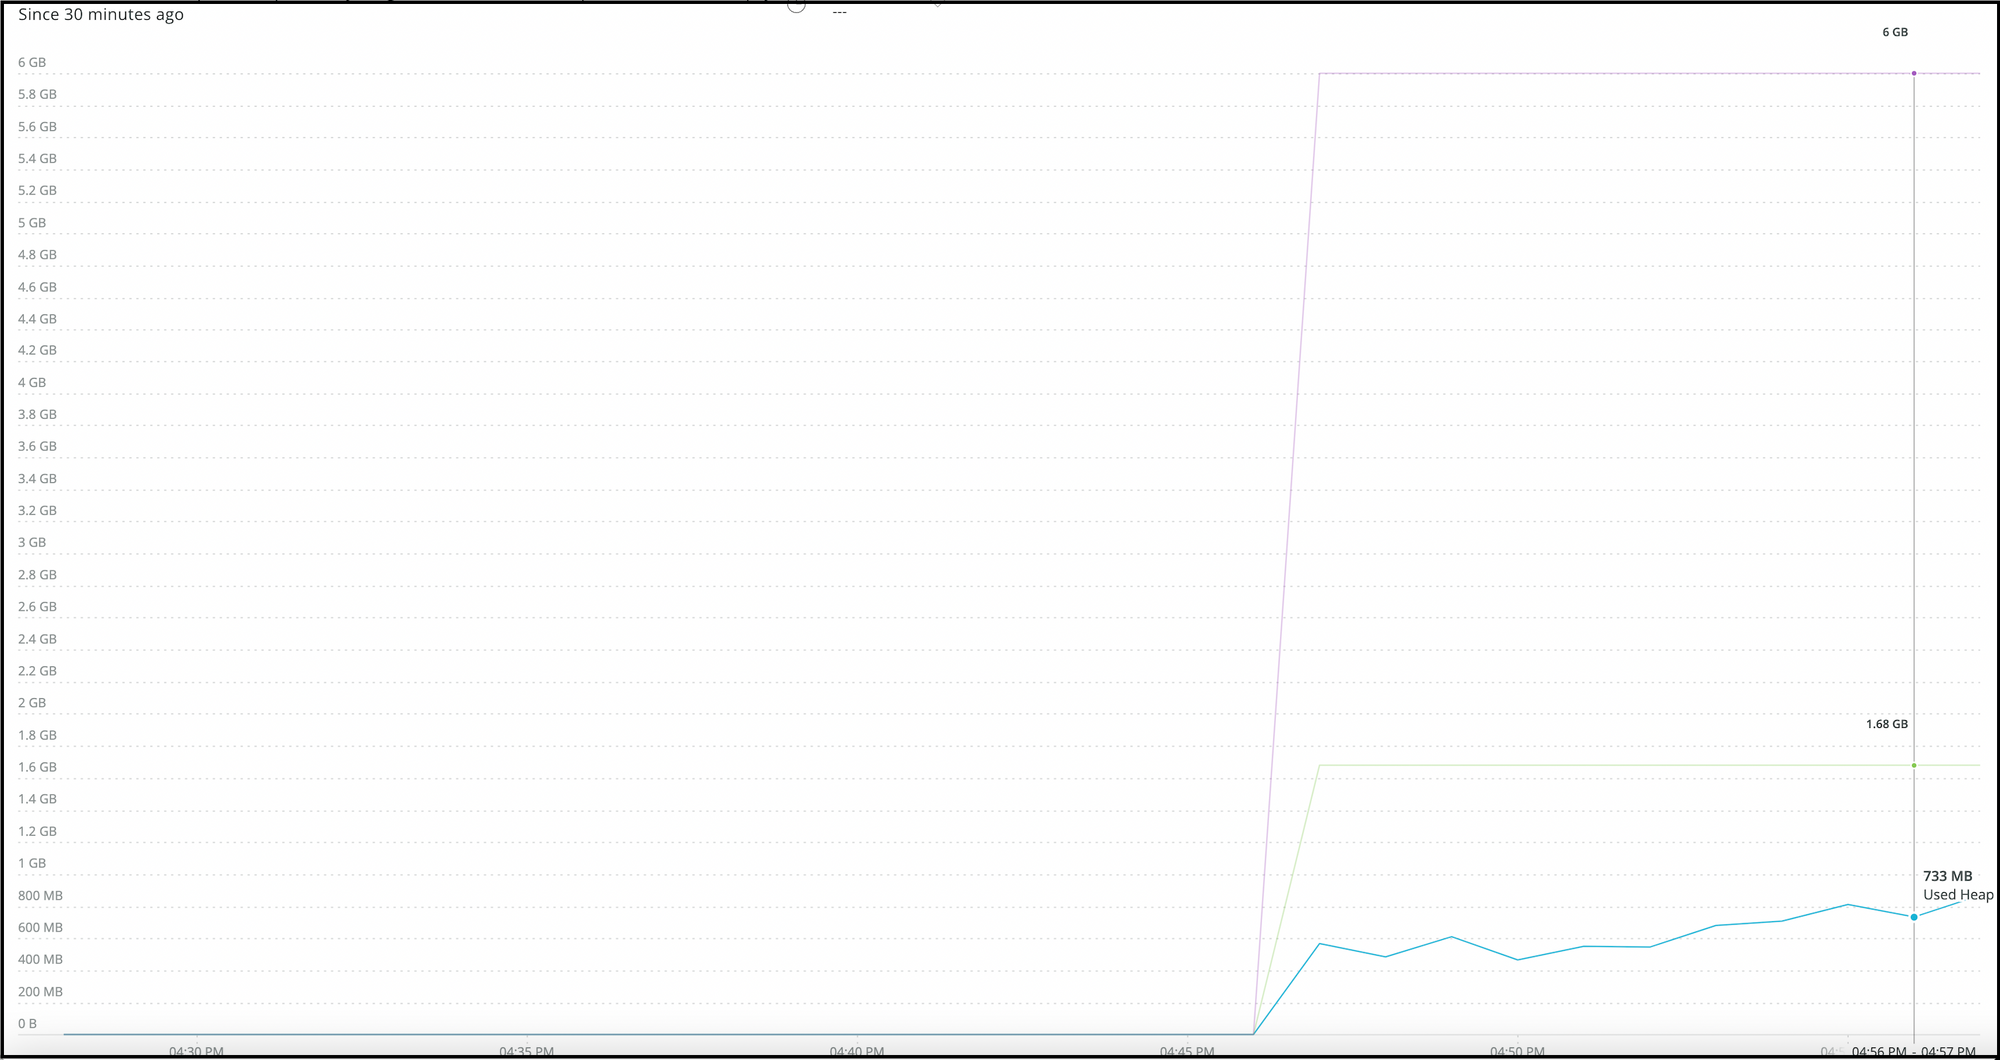
Here, the maximum heap is 6 GB, utilised heap is 733 MB, and committed heap is 1.68 GB. As can be seen, the difference between the committed and utilised heaps is decreasing and used heap reduction is functioning as predicted.
Step 3 (Tuning JVM heap specific params):
We can observe that the committed heap is near to used heap after the first two phases. and a minimum number of replicas can manage the traffic.
We may lower the xmx for the preceding diagram, which is 6 GB and equals 4x of the committed heap, to 1.5x or 2x of the committed heap.
xms = xmx/4
Step 4 (Eliminating memory based autoscaling):
While the CPU may be totally compressed, memory cannot. In order to allow HPA triggering that will efficiently scale up and scale down, we may set the threshold value for the CPU instead of the RAM. In contrast, scaling down takes a lengthy time if memory-based thresholds are enabled.
For instance, let's take a scenario where a service is operating on 5 pods with minReplicas 2 and maxReplicas 8 with averageUtilisation memory set to 75% and cpu set to 70%, and where the current average memory utilisation is 65% and cpu 58%.
It should scale down to 2 (minReplicas) because the average CPU and memory usage values are both below the threshold. However, that is untrue. Let's determine the average memory use figure needed to reduce the number of pods from 5 to 2.
HPA's formula for determining desired pod count:
desiredReplicas = ceil[currentReplicas * ( currentMetricValue / desiredMetricValue )]
Modified:
currentMetricValue = ceil[desiredMetricValue*(desiredReplicas/currentReplicas)]
substitute currentReplicas = 5, desiredReplicas= 2, desiredMetricValue= 75%
currentMetricValue= ceil[ 75 * ( 2/5) ] = ceil[ 75 * 0.4 ] = ceil[ 30 ] = 30 %
As a result, the pods will scale down from 5 to 2 if their average memory usage is less than 30%; otherwise, nothing will change. Because the memory is not very compressible, scaling down takes longer.
Consequently, choosing the CPU threshold value over RAM is preferable since the CPU is more highly compressible.
Conclusion:
By optimizing the pods in this manner, we eliminated unnecessary resource allocation, increase efficiency, and decrease the number of nodes while also lowering costs.
Using the pod optimization method, we were able to reduce the number of nodes by 45%. (m5.2xlarge). This reduced our monthly Ec2 instance cost by ~ $19000. Pod resource (cpu/memory) utilization also improved by 30%
References:
1. https://kubernetes.io/docs/tasks/run-application/horizontal-pod-autoscale/
2. https://sematext.com/blog/java-garbage-collection-tuning/
3. https://hub.docker.com/r/adorsys/java
Join us
The three pillars of scalability, dependability, and maintainability guide everything we create at Halodoc Tech. If solving difficult issues with demanding specifications is your strong suit, please get in touch with us with your resume at careers.india@halodoc.com. We are currently seeking for engineers at all levels.
About Halodoc
In Indonesia, Halodoc is the most popular healthcare app overall. Our goal is to provide easy-to-access, high-quality healthcare throughout Indonesia, from Sabang to Merauke. Our Tele-consultation service links patients in need with 20,000+ doctors. We work with more than 4000 pharmacies in 100+ cities to deliver medication right to your house. To top it off, we just introduced a premium appointment service that collaborates with 500+ hospitals and enables users to make a medical appointment inside our application. We've also worked with Indonesia's leading lab supplier to give lab home services. We are incredibly fortunate that our investors, including the Bill & Melinda Gates Foundation, Singtel, UOB Ventures, Allianz, GoJek, Astra, Temasek, and several more, have faith in us.Our Series C investment, which we recently finished, brought in about US$180 million towards our objective. Our team is constantly striving to make healthcare in Indonesia simpler by working nonstop to ensure that we provide the greatest healthcare solution that is tailored to meet the demands of each and every one of our patients.