Halodoc's Journey from EFK to New Relic Log Management
In the dynamic world of digital healthcare, Halodoc is dealing with a lot of data. Halodoc platform provides Tele consultation, Online Pharma Delivery, Labs & Hospital appointment services to millions of Indonesians. This platform is backed by 100+ micro services that collectively generate thousands of logs every minute.
This blog unfolds our journey about how we changed our old way of dealing with logs to a better and effective solution. We chose New Relic Log Management because it works smoothly with our existing tools, especially the New Relic observability platform that we’ve been using to monitor our applications and infrastructure since 2017. In this blog, we’ll take you through the journey from EFK to New Relic, talking about the challenges we encountered and the innovative solutions we employed.
The Original Architecture:
Before diving into the migration, it's crucial to understand our original logging setup with the EFK stack. This architecture involved FluentBit as a sidecar in our Kubernetes environment, channelling logs from over 100 services to Elasticsearch and visualized through Kibana. While this system served its purpose, operational complexities began to surface with our scaling needs.
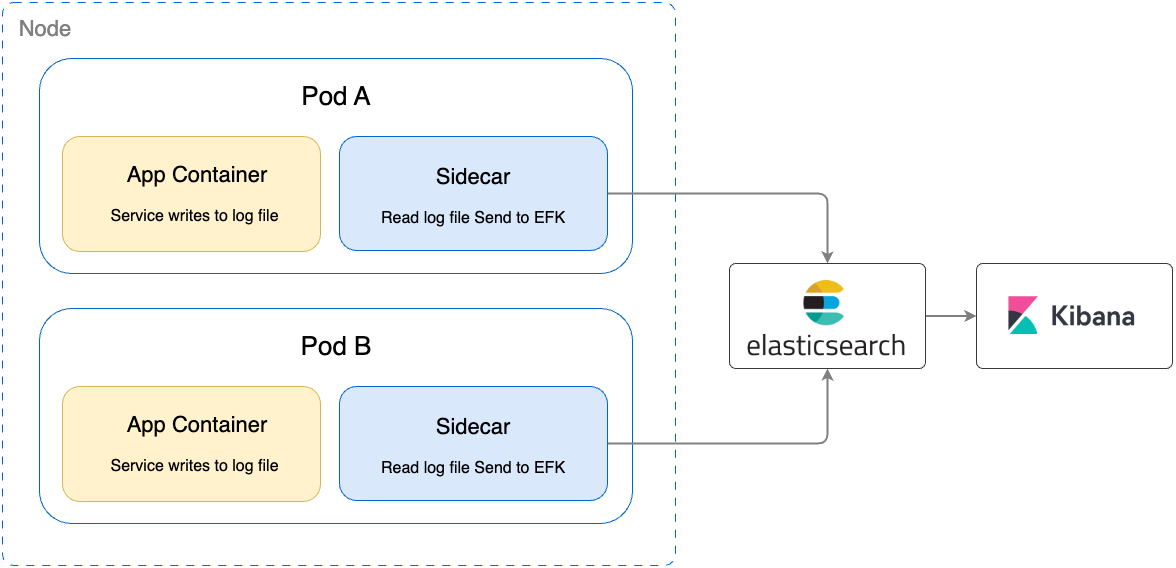
Figure 1: The old logging architecture of Halodoc services. While service is running, it writes the logs to a file, parallelly sidecar reads the logs from the file inside service container and push the logs to EFK.
Why did we decide to replace the EFK stack?
As we discussed previously, the initial architecture involved FluentBit in a sidecar container configuration, handling log reading and parsing for each service through sidecar and sending data to ElasticSearch, visualised through Kibana. This system, although functional, posed several operational challenges:
- Correlating service resource metric from New Relic with the logs from EFK was challenging.
- Mapping error between New Relic error trace inbox and EFK was inefficient and time consuming for engineers.
- EFK stack maintenance was complex and resource-intensive.
- The sidecar model introduced performance & resource overheads on backend service.
- Configuration updates across multiple services were time-consuming.
Why did we choose New Relic Log Management?
At Halodoc, our primary tools for Application Performance Monitoring (APM) and infrastructure monitoring have been consolidated under the New Relic platform. This integration is essential for monitoring errors, traces, and alerts effectively. However, our previous reliance on the EFK (ElasticSearch, FluentBit, Kibana) stack for logging presented some challenges. Developers found it challenging to switch between New Relic and EFK, particularly when tracing errors. Adding multiple filters on EFK to pinpoint specific logs related to an error or transaction was not only tedious but also time-consuming, averaging about 90 seconds per case.
Our extensive research and comparison between EFK and the New Relic Log Management tool revealed several compelling advantages of the latter. New Relic offers a host of features that encompass and extend beyond those provided by EFK. These include:
- Live Log Monitoring: Real-time visibility into application logs.
- User-friendly Configuration: Simplified setup for log parsing and creating drop rules.
- Enhanced Error Debugging: Faster resolution of 5xx errors.
- Customizable Dashboards: Tailored views for log analysis.
- Integrated Alerting: Ability to attach logs directly within New Relic alerts.
- Versatile Log Filtering: Advanced options for log filtering.
- Easy Export Options: Simplified process for exporting log data.
Recognizing the need to improve our logging efficiency, especially under high application throughput conditions, we revisited our approach of using sidecar containers for log capture. The sidecar model, while functional, had a noticeable impact on the performance of our application containers. Additionally, any changes to FluentBit configurations necessitated manual updates across all service containers, adding to the operational overhead.
To address these challenges, we decided to adopt a more centralised method for log capture, utilising the Kubernetes DaemonSet approach. This shift not only streamlined our logging process but also reduced the performance burden on individual application containers, marking a pivotal step in our continuous efforts to optimise our application monitoring and logging systems.
New Architecture:
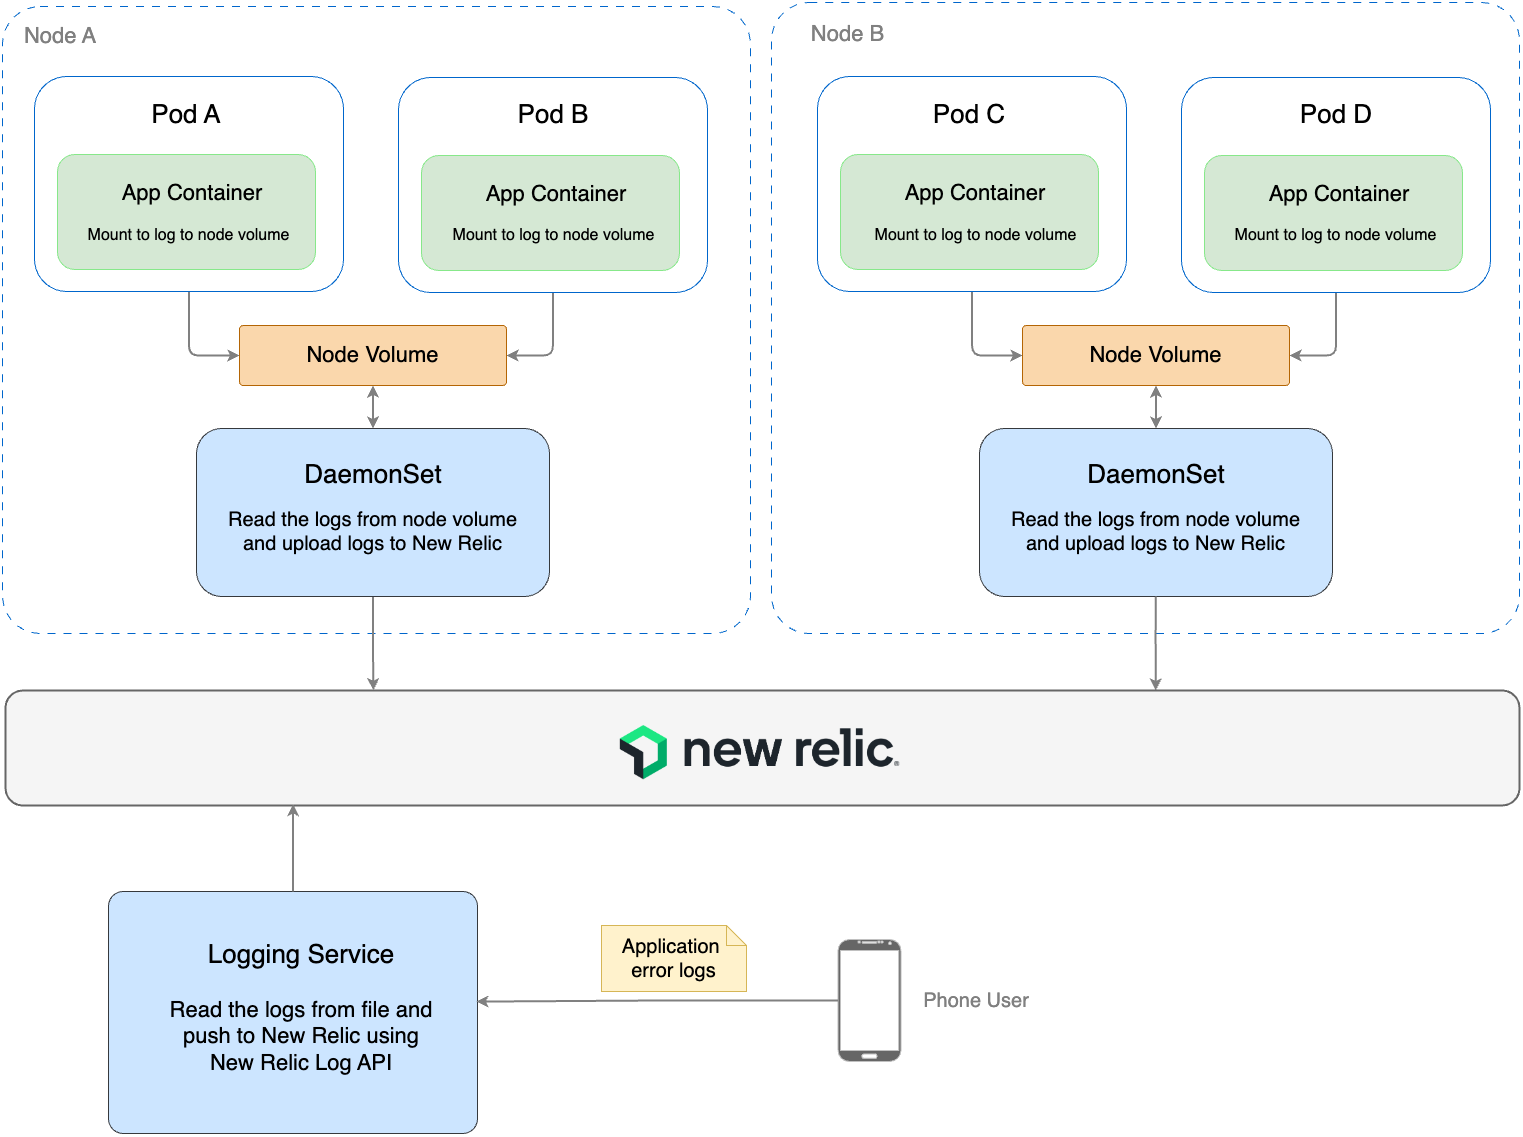
Figure 2: The new architecture for logging, Here all service logs written on console are mounted to Node Volume. Using DaemonSet (which is attached to each node) we read the logs from the node volume and upload logs to New Relic.
Additionally, the logs coming from Android/IOS application are pushed to our internal logging service, which reads the incoming logs and uploads them to New Relic using New Relic Log Management API.
Figure 2 illustrates the strategic shift we made from the sidecar model to a centralized approach using Kubernetes DaemonSet. In this new setup, we have configured FluentBit within the DaemonSet. This deployment is crucial for our logging process, as it is tasked with reading and parsing logs from the node volume, specifically from the path /var/logs/containers/<service_pod>.log. Once the logs are processed, they are then forwarded to New Relic for monitoring.
A key aspect of this transition involves our use of Amazon Elastic Kubernetes Service (EKS) version 1.23. In this version, Docker is utilised for mounting pod logs onto the Node filesystem. These logs are stored in a JSON format, providing a structured and easily parsable data format. This structure is essential for our FluentBit setup within the DaemonSet, enabling efficient log processing and transmission.
Challenges we faced during migrating sidecar to DaemonSet
In our initial migration phase, we employed the default configurations of FluentBit within our DaemonSet. These configurations were similar to those we used in the sidecar approach. However, this transition presented us with unique challenges, particularly in managing log data more effectively.
Excluding Non-Essential Logs
One of the challenges was the exclusion of non-essential logs. Our EKS (Elastic Kubernetes Service) cluster hosts has both micro services and internal tools, each writing logs to the same directory on the node volume, located at /var/log/containers/<container_id>.log. Within each pod, we typically had three containers running:
- Backend service container
- Vault agent
Logs from Vault agent and internal tools are useful in specific contexts, but not always necessary for our primary logging needs. Therefore, we decided to exclude these logs. Additionally, we chose to filter out logs from other internal tools running on EKS, such as ArgoCD, Grafana, Jenkins, and Karpenter.
We used a straightforward method in the FluentBit Input tag configuration to filter out unnecessary logs and tackle this challenge. This approach allowed us to filter out logs from non-essential sources. Below is an overview of the FluentBit configuration we implemented:
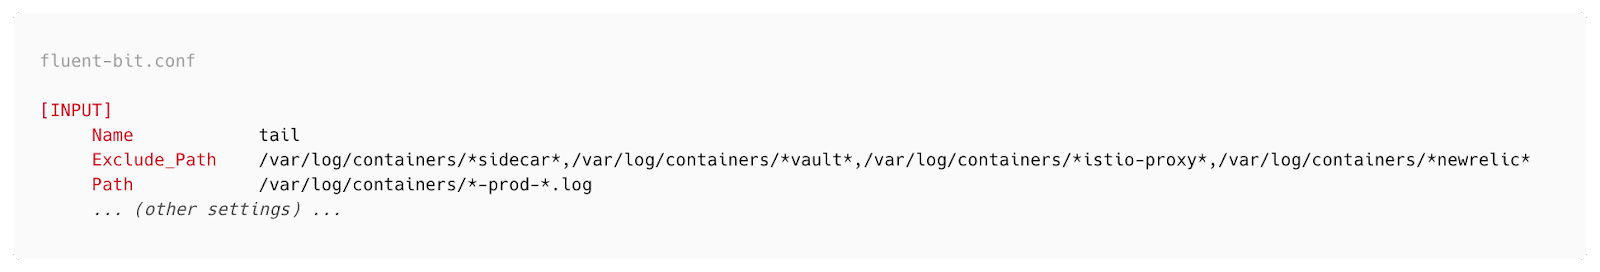
This configuration enabled us to efficiently exclude logs from Vault agent, and various internal tools, ensuring that our logging system focused primarily on capturing and processing logs that were essential for our operations. And only read those log files, where the file name has -prod- keyword (which indicates actual service pod log).
Backend Logs and Request logs (exclude request logs):
Our backend services generate two types of logs (application logs and http request logs) in single container and mount logs on Node volume, which looks like:
Backend Log Format:
- Log Format:
[%date{dd/MMM/yyyy:HH:mm:ss +SSSS}] %c{15} [%thread] %-5level [%X{X-Transaction-Id} - %X{X-Request-Id}] - [%X{Referer}] - %-0.-500msg%n%rEx - Example:
[27/Oct/2023:18:30:26 +0983] c.h.b.c.s.k.ABCConsumer [Thread-33] INFO [Txn-66efa129-4de7-45d5-79d00a633148 - d62f84da-534c-4d54-00e42782nc475c] - [Referer-abc-service] - [Prescription] not a valid event, eventType: order_track, Consultation: X4W0NK-4926, Order: P4ONGP-5377
HTTP Request Log Format:
- Log Format:
[%ClientIp - - [%date{dd/MMM/yyyy:HH:mm:ss +SSSS}] "%Method %URL %Protocol" %StatusCode %HttpResultSize "-" "%AgentName" %LogLatency - Example:
11.34.12.115 - - [27/Oct/2023:18:35:37 +0700] "GET /api/subpath/id HTTP/1.1" 200 7050 "-" "HD customer app/19.000/android 13" 57
The backend logs are required for debugging purposes, but http request logs are being used very rarely by engineers. New Relic agent running along with the service main process already capturing every request, so pushing http request logs from FluentBit was redundant and additional cost. so to avoid duplicates we decided to eliminate request logs from FluentBit. And created a dashboard in New Relic to display HTTP request logs by using source from New Relic APM Agent using following NRQL query:SELECT timestamp, namespaceName as 'Namespace' , appName as 'Service', podName ,request.uri as 'URL',request.method as 'Method', request.headers.userAgent as 'Agent' ,http.statusCode as 'HttpStatusCode', request.headers.referer as 'Referer', duration, databaseCallCount FROM Transaction where request.uri is not null limit max
Initially we were excluding HTTP requests from New Relic itself using the drop rule, but it involves cost in Data Transfer (EKS out to internet New Relic), so we decided to exclude HTTP request logs from FluentBit itself (within our CIDR). We faced challenges while eliminating HTTP request logs from FluentBit as both types of logs are coming from a single file as an input to FluentBit, and it's challenging for FluentBit to distinguish between backend and HTTP request logs.
We updated FluentBit configurations as:
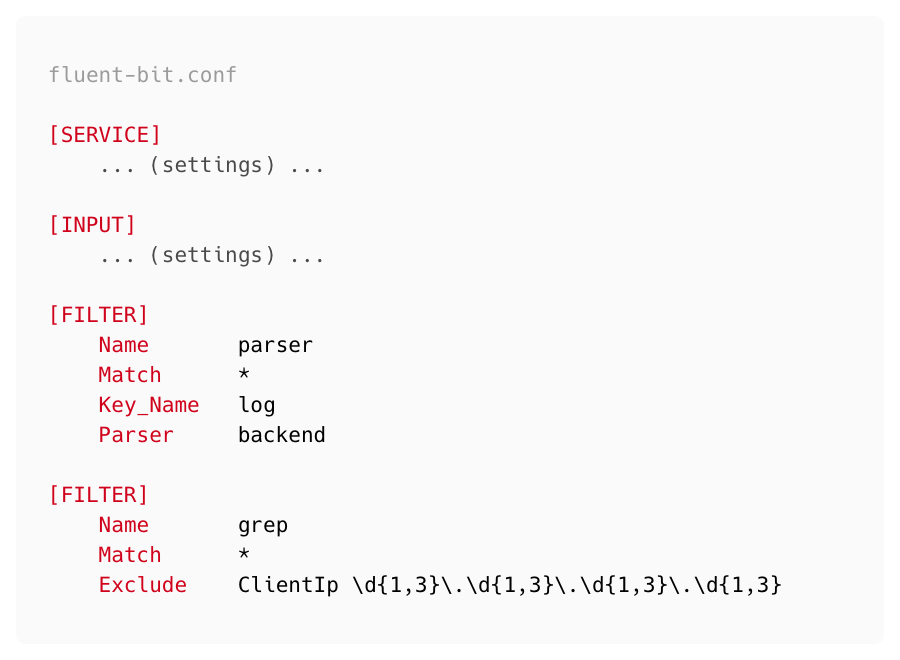
In the above configuration, first we applied a parsing rule, by doing this we get to know what attributes are present in the logs. We used the ClientIp attribute as a primary key to distinguish Backend and HTTP request logs (because the ClientIp attribute only exist in HTTP request logs and not present in Backend logs). On top of that we applied the exclude log rule if the ClientIp attribute is present in log.
By doing this we are successfully able to exclude HTTP request logs from FluentBit and save 30% logs data ingestion in New Relic.
Multiline log parsing:
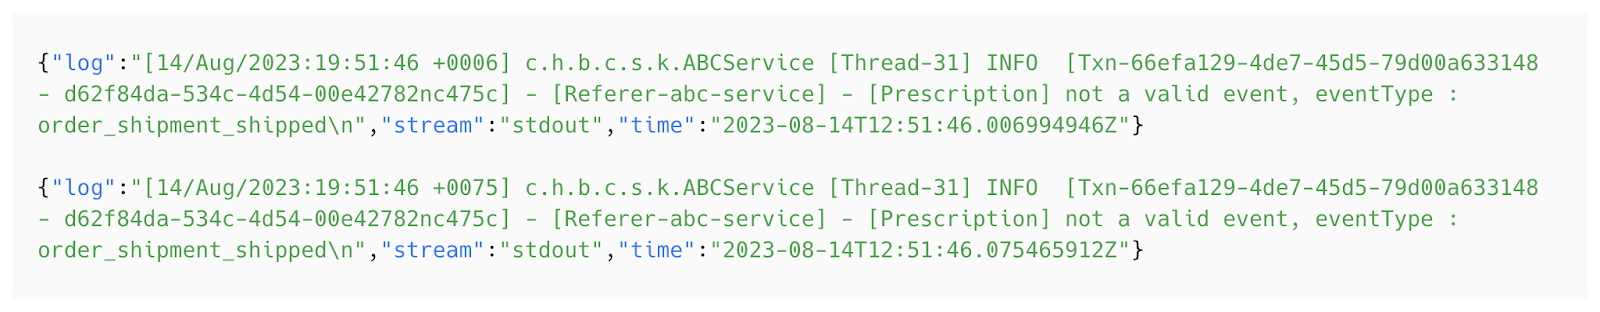
After migrating from sidecar to DaemonSet, we noticed that multiline logs are coming as a separate log entry, because when the pod logs get mounted in the node volume it is considered every multiline logs as a new log line which affected the multiline logs (like: traces, exceptions).
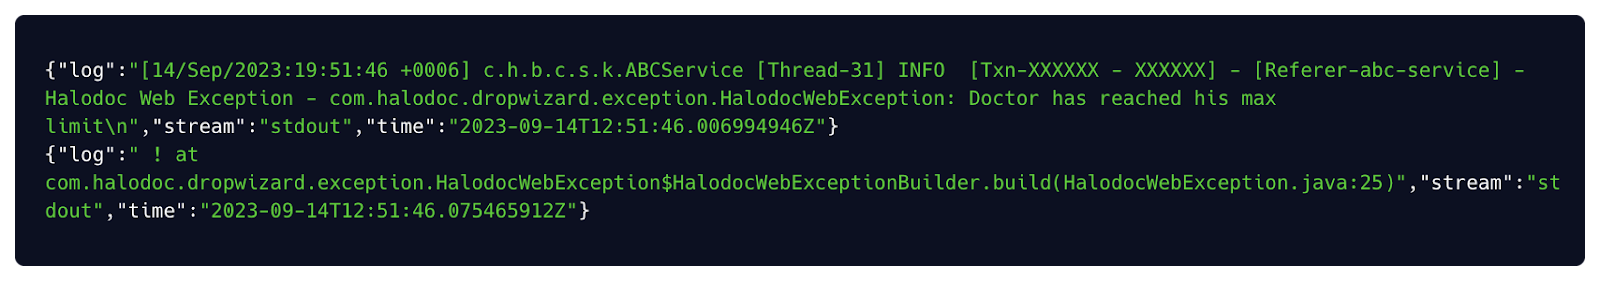
Appeared as separate log entry in New Relic

To solve this problem, we configured multiline parser in FluentBit.
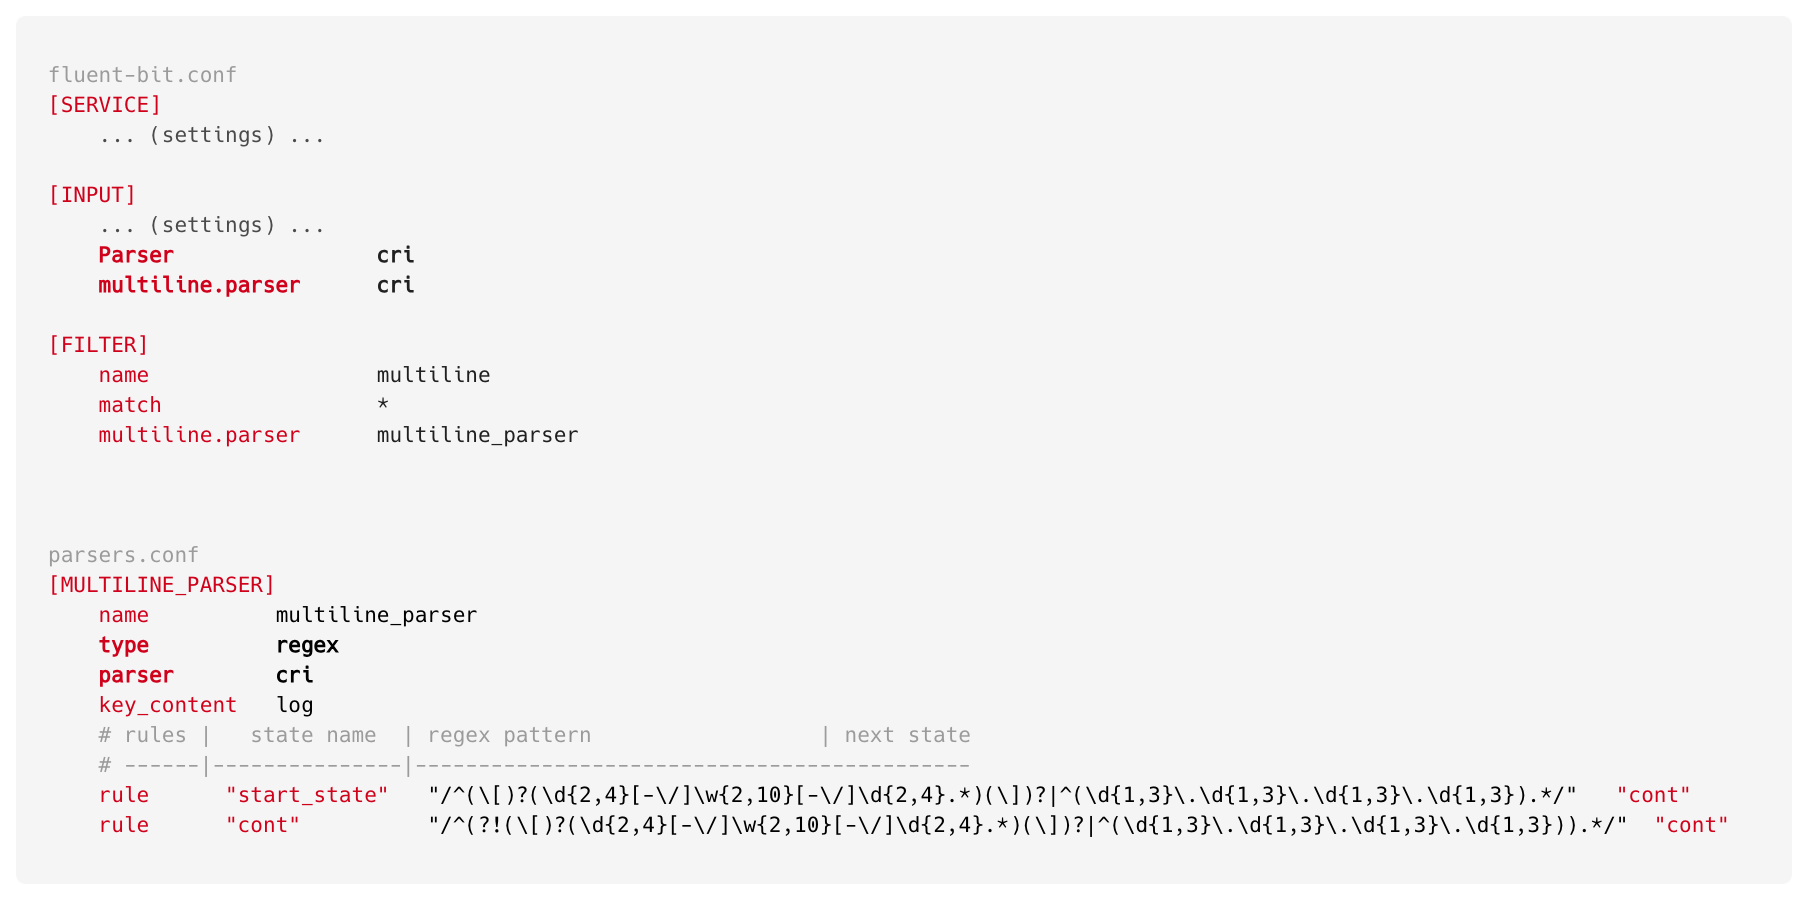
We analysed our log pattern from different services, and all of our logs either start with timestamp or with a client ip, based on that we finalised all possible patterns which will help us to know the start of a log line and considering any trailing line as part of it.
Start state of log: Any log which starts with any one of the following patterns.
Continuation of previous log: Any line which do not start with below patterns
Patterns: 2023-10-31 2023-Oct-21
2023-10-31 13:47:49,093 2023/10/31 13:47:49,093 [31/Oct/2023:13:47:49 +0931] [31-Oct-2023:13:47:49 +0931] [31/10/2023:13:47:49 +0931] [31-10-2023:13:47:49 +0931] 10.31.49.122
By applying this configuration, we were able to fix multi line issues, and multiline logs are coming as a single log entry.
At Halodoc, we consistently stay at the forefront of cutting-edge technologies. Recently, we upgraded our EKS version from 1.23 to 1.24 to enhance performance and efficiency. With EKS 1.24, we transitioned from using the Docker runtime to Containerd. This change altered the way logs are mounted to node volume, as Containerd writes logs in CRI (Container Runtime Interface) format instead of the JSON format used by Docker. Due to this infrastructure modification, multiline logs did not function as expected. To support CRI format, we updated our FluentBit config as follows:
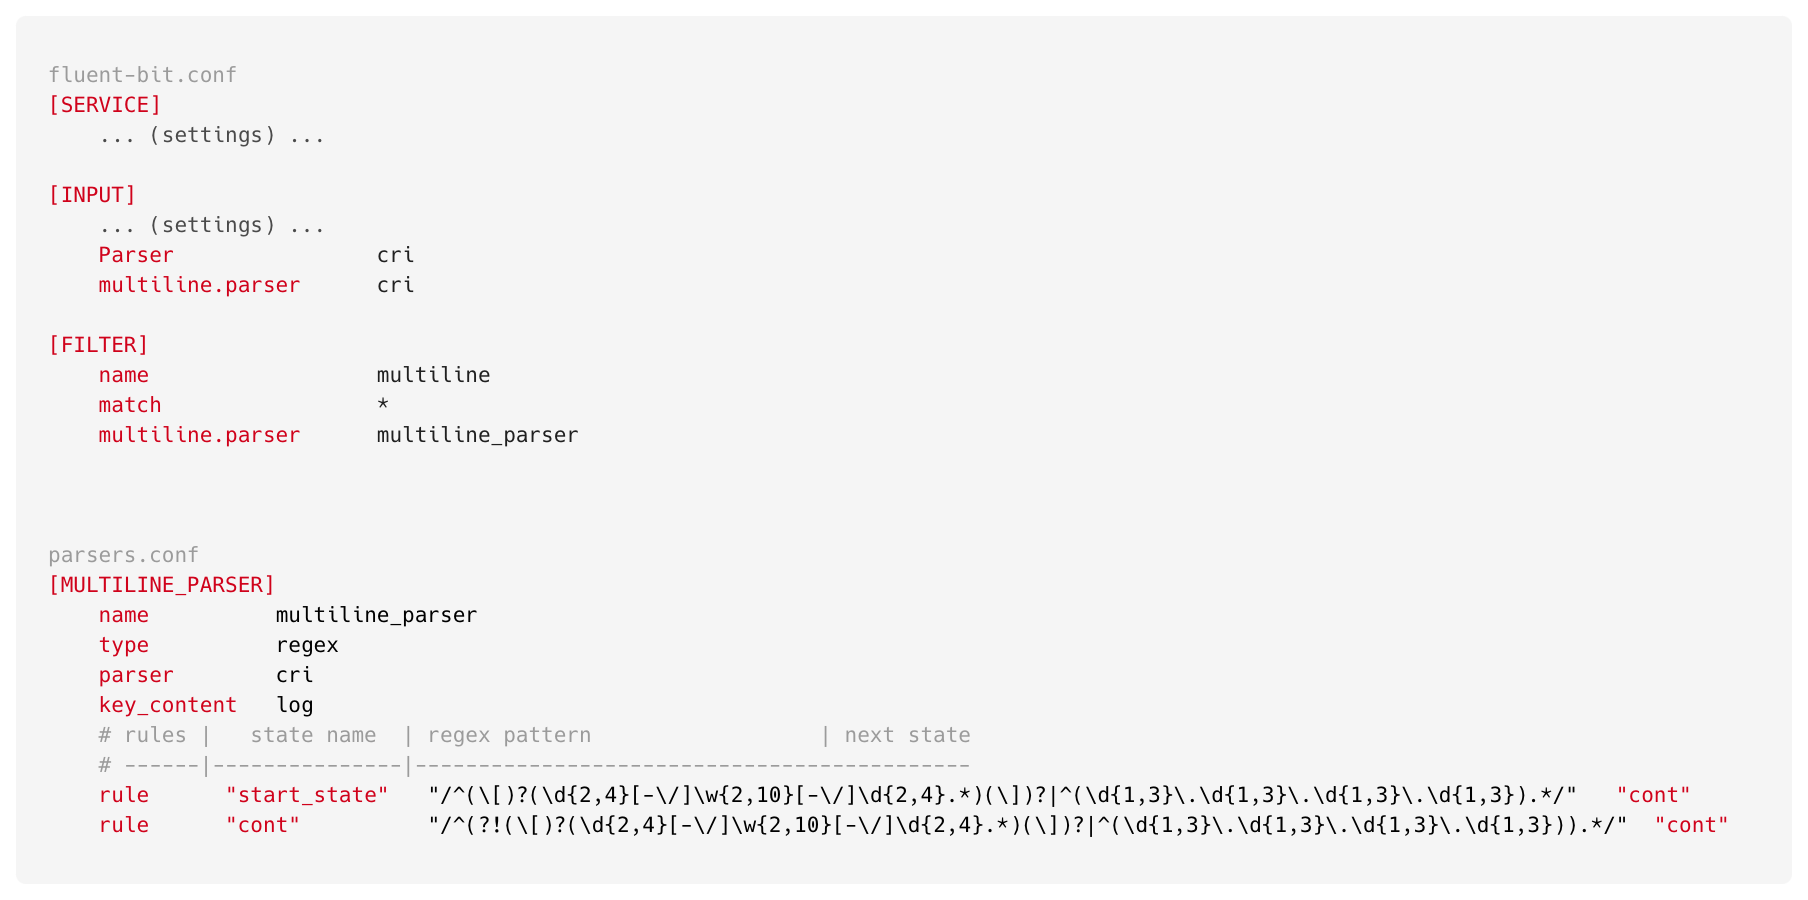
By making these changes, multiline parsers are able to understand log patterns and successfully are able to apply start & continuation states on logs. And we are able to fix the multiline issue on EKS 1.24 (Containerd).
Missing overall 20-30% logs:
Our current services generate average of 80K logs per minute. Unfortunately, we found that 30% of these logs are not being sent to New Relic from DaemonSet. After investigating, we discovered that logs stored on node volumes are rotated when the file size reaches 10MB (as per default Docker behaviour).
This rotation, along with default FluentBit settings, results in slow log reading and parsing performance. FluentBit is unable to keep up because it reads log lines while the log file is simultaneously being rotated, causing unread lines to be missed.
We did multiple rounds of testing on the stage environment with the following FluentBit settings to resolve the missing logs issue.
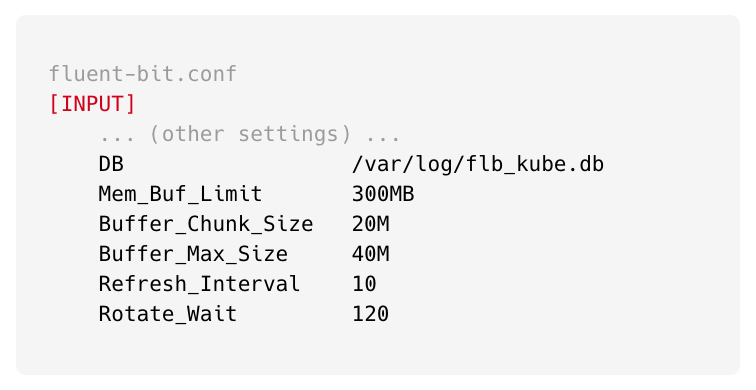
DaemonSet resources:
As a result of the configuration update, the FluentBit log reading & parsing capacity has improved drastically, and now it is able to handle a minimum 200,000 logs/minute without any log loss.
Optimise Data ingestion:
In the older stack (EFK) our data ingestion on average was 600 GB/day, but after migrating to New Relic our logs data ingestion increased to 2TB/day. We observed there is a huge gap in data ingestion between older (EFK) and new stack (New Relic), consequently increase in the overall costs incurred by New Relic.
Iteration 1: Addressing additional unused attributes
New Relic provides standard settings for FluentBit to configure in Kubernetes DaemonSet, but those default settings capture a lot more data than required. In EFK, each log entry had following attributes:
hostname, service, Date, Thread, LogLevel, TxnId, ReqId, Refere, and Message
But, After configuring default settings provided by New Relic, the attribute count in each logs increased significantly. A lot of metadata was added to each log entry and many more attributes started coming in each logs. Out of these attributes, we found the ones which are unnecessary for developers to debug.
We analysed and identified following attributes which were captured by FluentBit settings, but they are not proving useful for our intended purpose:newrelic.ERROR_CODE, newrelic.URL, newrelic.source, labels.name, labels.app, labels.app.kubernetes.io/component, labels.app.kubernetes.io/instance, labels.app.kubernetes.io/managed-by, labels.app.kubernetes.io/name, labels.app.kubernetes.io/part-of, labels.app.kubernetes.io/version, labels.controller-revision-hash, labels.helm.sh/chart, labels.pod-template-hash, labels.statefulset.kubernetes.io/pod-name, labels.version, newrelic.IP_01, newrelic.IP, container_hash, container_image, docker_id, plugin.version, entity.type, entity.guids, plugin.source, plugin.type, pod_id, stream
We decided to exclude those attributes to push to New Relic. Using the drop filters feature provided by New Relic, we are able to exclude those attributes from the New Relic server side. But to optimise it more and save Data Transfer cost we decided to exclude it from FluentBit level as well. We used the following configuration to exclude unused attributes.
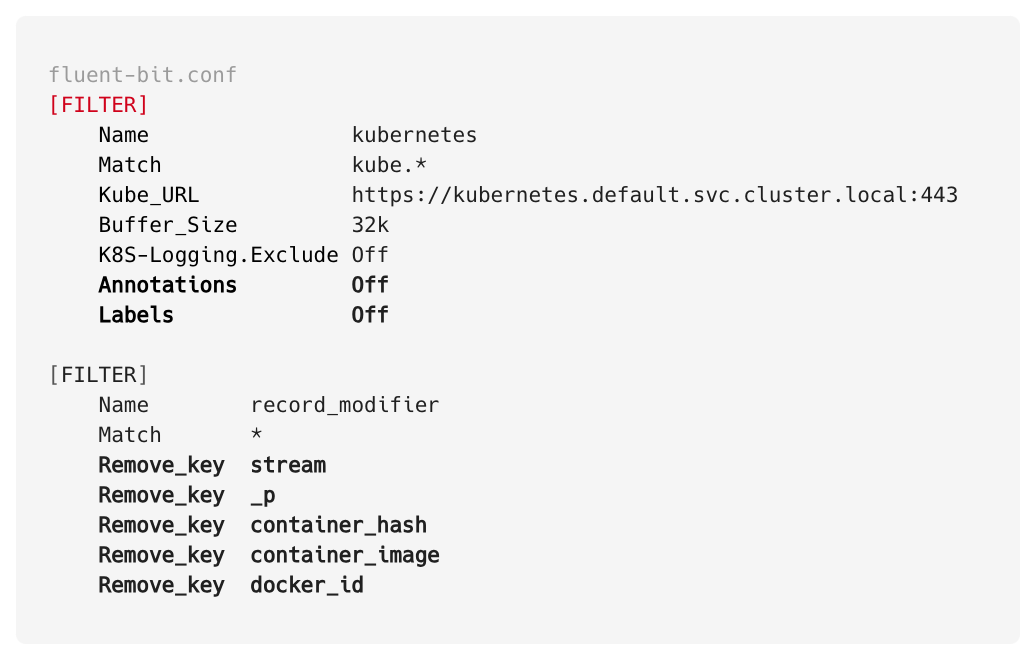
Note: Few of following attributes are necessary for New Relic log-in-context for APM & Service and other internal mapping purpose, so we retained the required attributes: trace.id, timestamp, Pod_name, Hostname, Entity.guid, Entity.name, host
Iteration 2: Excluding health check logs
Every service in our infrastructure gets a health check request and it gets logged by a service. We excluded health-check API logs using New Relic drop rules feature using following NRQL query: SELECT * FROM Log WHERE message like '%/api/healthcheck%' OR message like '%/api/ping%'
Iteration 3: Tricking default behaviour of New Relic
We noticed after applying parsing rules on raw input log from /var/logs/containers/<service_pod>.log, our FluentBit were able to parse data from raw logs and push the following attributes to New Relic. className, entity.guid, entity.name, host, LogLevel, message, methodName, namespace_name, Partition, pod_name, Referer, ReqId,TxnId, service_name, ThreadId, timestamp.
Upon parsing the raw log, we faced a challenge where the message field was still populated with the original raw log content.
For example:
Raw log: {"log":"[14/Sep/2023:19:51:46 +0006] c.h.b.c.s.k.ABCService [Thread-31] INFO [Txn-66efa129-4de7-45d5-79d00a633148 - Req-d62f84da-534c-4d54-00e42782nc475c] - [Referer-abc-service] - Halodoc Web Exception - com.halodoc.dropwizard.exception.HalodocWebException: Doctor has reached his max limit\n","stream":"stdout","time":"2023-09-14T12:51:46.006994946Z"}
Post FluentBit Parsing:
timestamp : 14/Sep/2023:19:51:46 +0006
className: c.h.b.c.s.k.ABCService
LogLevel: INFO
Referrer: Referer-abc-service
ReqId: Req-d62f84da-534c-4d54-00e42782nc475c
TxnId: Txn-66efa129-4de7-45d5-79d00a633148
ThreadId: Thread-31
Message: Doctor has reached his max limit
Despite our parsing rules, the New Relic overrode the message field with the input from the log field in the raw logs and the result looked like:

To address this issue, we implemented specific parsing rules and made strategic modifications in our configuration as follows:
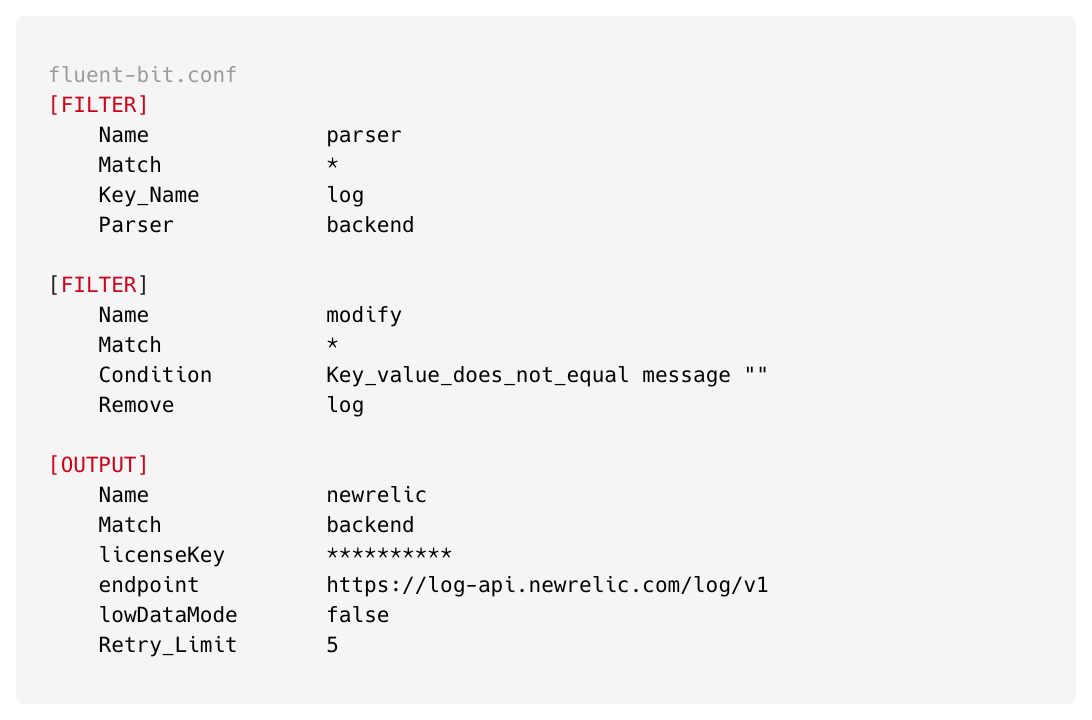
In the aforementioned configuration, we meticulously structured our settings and executed each operation sequentially.
Steps:
- We applied a parsing rule to the input log, allowing FluentBit to extract attributes from the raw log.
- After ensuring that the parsing was successful (by confirming the creation of the message attribute), we proceeded to remove the original log attribute. By doing this, we are completely removing log attribute and we are not giving chance to New Relic to overwrite message attribute with log attribute
- Finally, we configured the
[output]block to transmit the log entry attributes to New Relic's Log Management system.
By implementing these steps, we achieved a significant reduction in data ingestion, decreasing it from an average of 2TB/day to approximately 550GB/day. These configurations allowed us to migrate seamlessly from EFK to New Relic Log Management without losing any valuable log content and helped Halodoc engineers to debug logs more efficiently.
Conclusion
Halodoc's migration from the traditional EFK stack to New Relic Log Management represents was strategic evolution in log management for our healthcare platform.
The decision to centralize log capture using Kubernetes DaemonSet, coupled with FluentBit configurations, addressed operational challenges and significantly improved logging efficiency. The transition not only streamlined the process but also optimized performance by decommissioning sidecar, excluding non-essential logs, implementing parsing rules, reduction in logs data ingestion, enhancing overall system reliability and empowering engineers at Halodoc to troubleshoot issues more effectively through New Relic Log Management tool in the fast-paced world of digital healthcare.
Reference
 newrelic


Join us
Scalability, reliability and maintainability are the three pillars that govern what we build at Halodoc Tech. We are actively looking for engineers at all levels and if solving hard problems with challenging requirements is your forte, please reach out to us with your resumé at careers.india@halodoc.com.
About Halodoc
Halodoc is the number 1 Healthcare application in Indonesia. Our mission is to simplify and bring quality healthcare across Indonesia, from Sabang to Merauke. We connect 20,000+ doctors with patients in need through our Tele-consultation service. We partner with 3500+ pharmacies in 100+ cities to bring medicine to your doorstep. We've also partnered with Indonesia's largest lab provider to provide lab home services, and to top it off we have recently launched a premium appointment service that partners with 500+ hospitals that allow patients to book a doctor appointment inside our application. We are extremely fortunate to be trusted by our investors, such as the Bill & Melinda Gates Foundation, Singtel, UOB Ventures, Allianz, GoJek, Astra, Temasek, and many more. We recently closed our Series D round and in total have raised around USD$100+ million for our mission. Our team works tirelessly to make sure that we create the best healthcare solution personalized for all of our patient's needs, and are continuously on a path to simplify healthcare for Indonesia.